Streaming Learning Center Where Streaming Professionals Learn to Excel


Related Articles
I’m adding some lessons that identify and describe the operation of Mac video utilities to the online course Streaming Media 101 and took this as an opportunity to have a look at Apple’s Advanced Video Quality Tool (AVQT) which launched at the company’s 2021 World Wide Developers Conference. I’m making the lesson available as a lesson of the week, immediately below. I will follow up in a few days with some basic observations about the metric itself.
The text below covers some of the material covered in the video, though not in as much detail. Here’s the video, and here’s a link to the test files referenced in the video.
Contents
Video Quality Metric Overview
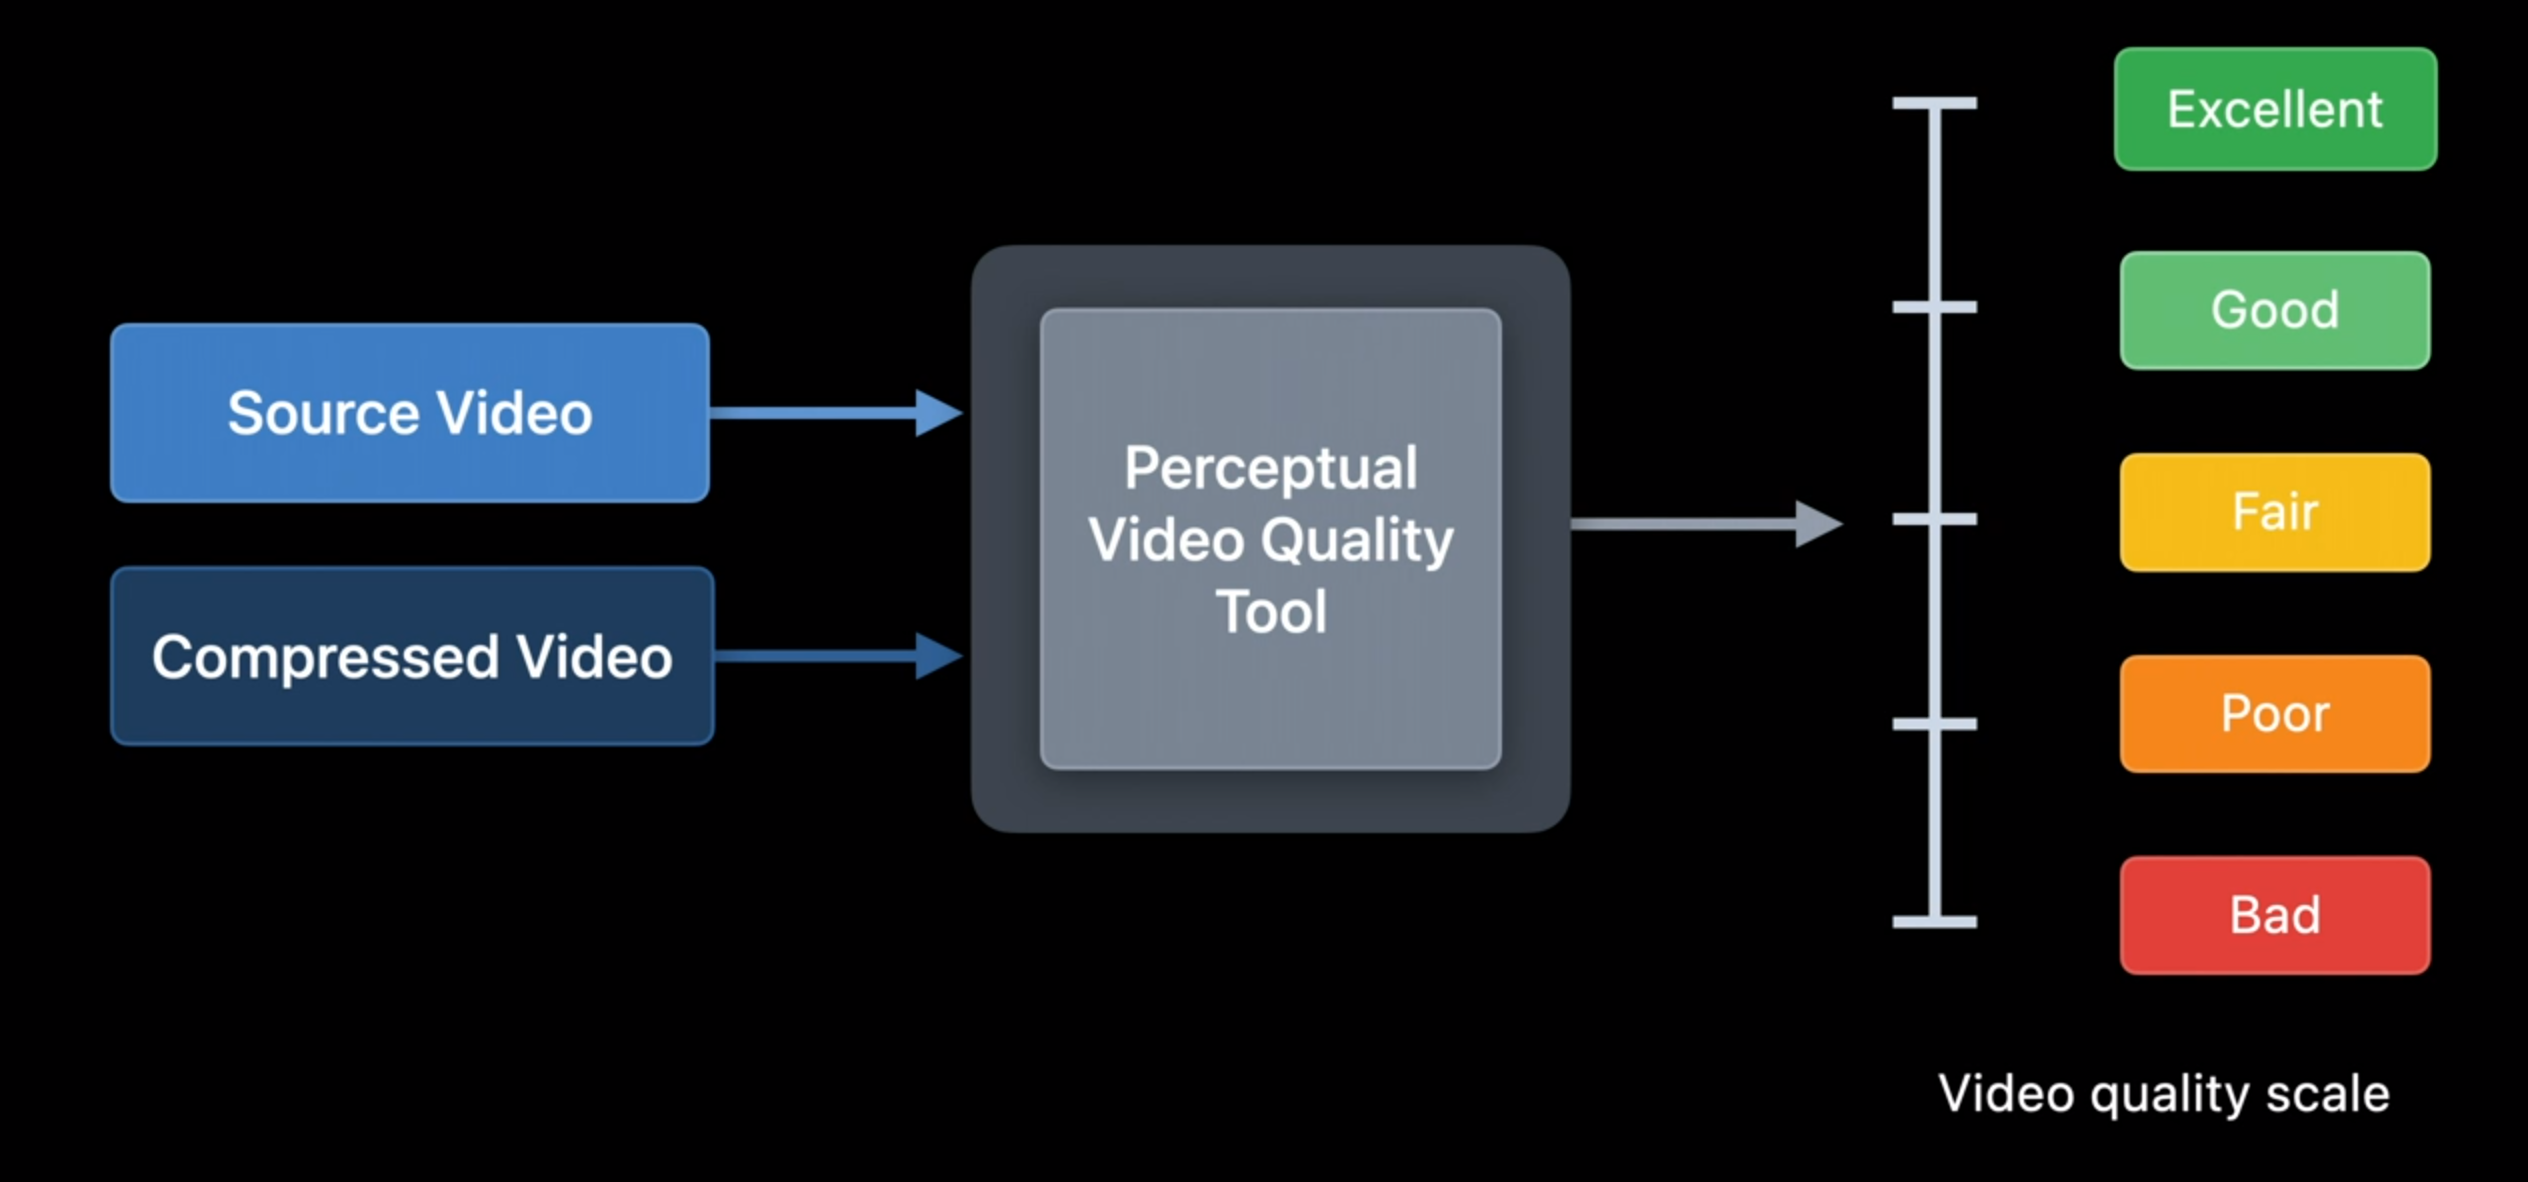
By way of background, AVQT is a command-line-driven full-reference metric like VMAF or PSNR. By full-reference metric, I mean that it compares the compressed file to the source to measure quality and score the video, which means that it can’t be used in downstream environments where the source file isn’t available (again, like VMAF and PSNR, but unlike SSIMPLUS which now has a no-reference metric). Scores are delivered on a scale from 1-5 with 1 being bad and 5 being excellent. This maps directly with how most subjective, human-based evaluations are scored, which is convenient.
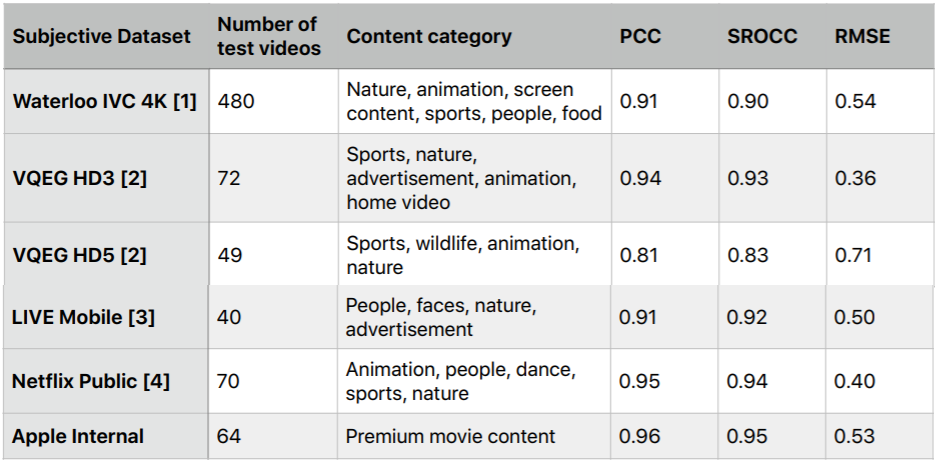
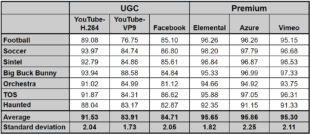
AVQT ships with impressive scores that confirm alignment with subjective evaluations. In particular, a score of .81 or higher in the Pearson Correlation Coefficient (PCC) means that there is a very strong correlation between the subjective ratings in the public databases and the AVQT scores. This means that AVQT should be a strong predictor of subjective ratings.
Running the Metric
The AVQT command line is very simple:
AVQT [<Options>] -t <test-video> -r <reference-video>
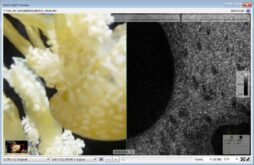
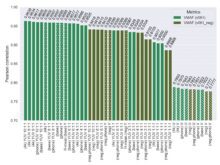
AVQT computes the score which it displays in the Terminal window and in the CSV or JSON file it outputs (your choice). There are no visualization functions but it’s trivial to combine CSV files in Apple Numbers to create a graph like that below. Of course, while great for viewing the score, you can’t view the actual video frames like you can with the Moscow State University Video Quality Measurement Tool or SSIMPLUS VOD Monitor.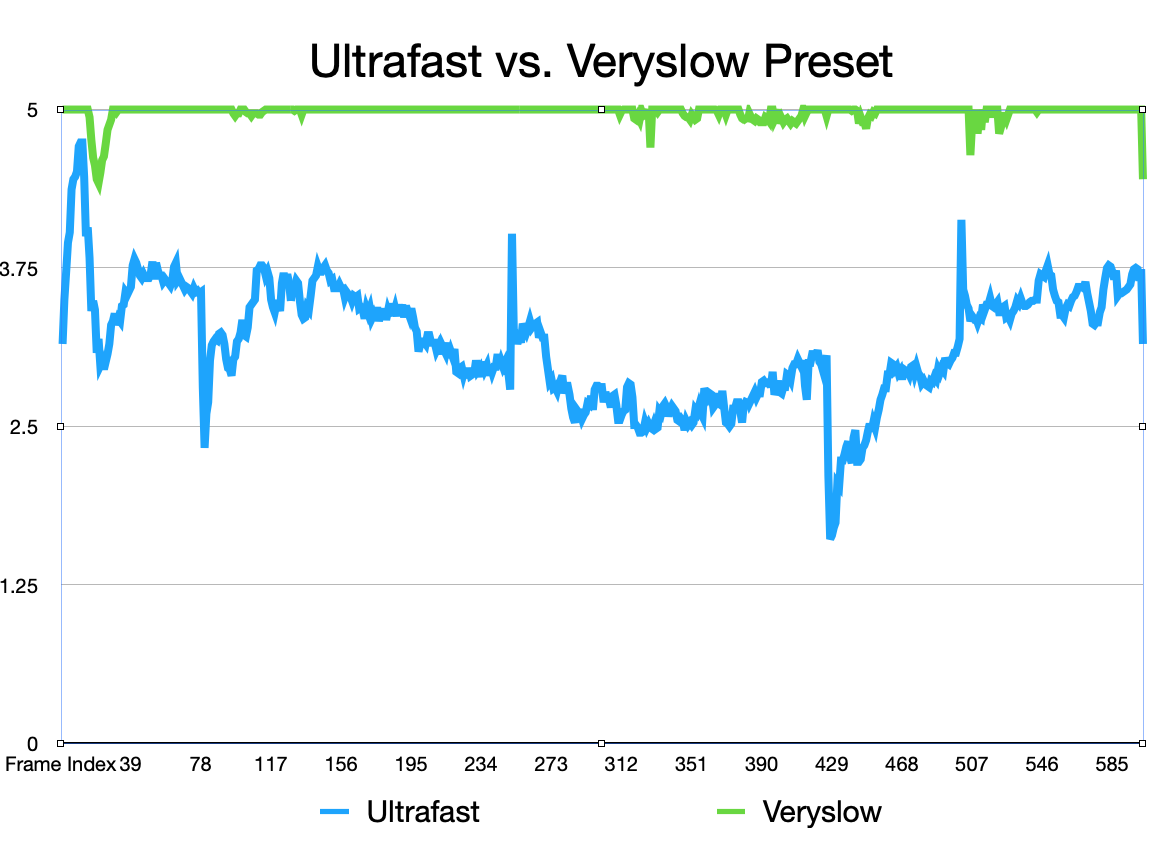
AVQT comes with a strong feature set, which includes:
- The ability to compute MSE and PSNR (but not VMAF)
- The ability to choose different temporal pooling techniques that reflect quality variability in the scoring (like harmonic mean)
- It can compare lower resolution videos to the source without pre-scaling
- It can measure at different display resolutions. So, if you were displaying a 640×360 video in a 640×360 display window, you could compute one score, or another if it was being viewed at full screen.
- You can test at different viewing distances.
- The tool supports Dolby Vision 5 content if both the source and reference videos are in that format.
- The program natively supports all video formats and codecs supported by AVFoundation, and you can extend support by installing the Pro Video Formats package.
Metric Scoring and Output
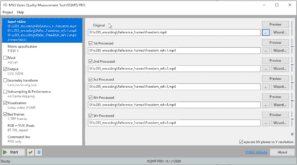
Initial operation revealed a couple of easily fixable rough edges. First, at least in the AVQT CSV output file, the core is at the bottom of the table not at the top. Here’s the top of the CSV file that identifies the test parameters, but no score. Instead, the tool inserts it at the bottom so you have to scroll down to see it.
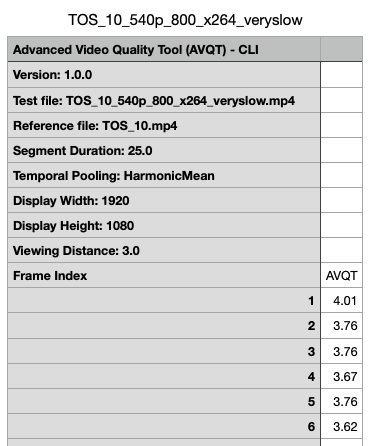
You see the scores at the bottom of the file below. It’s not a huge inconvenience, but why make me scroll through the entire file just to see the score?
Second, scores are presented by segment, not for the entire file. The file in the CSV snippet above is a ten-second test file, so I set the segment duration to 25 to get a single score. The snippet below is for a 60-second file using the default 6-second segments so you see ten segment scores at the bottom, and no consolidated score. Obviously, a consolidated score is just a few clicks away in Numbers, but why not just compute and show it?
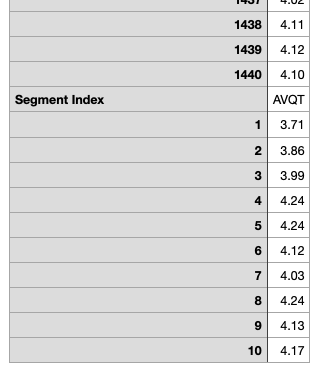
I could set the segment length to 60 seconds for this file, but that’s the maximum segment length; for longer files, you’ll have to compute it yourself.
I did ask for the logic behind these presentation issues on the Apple Developer Forum and will let you know if and when I hear back.
In my next post, I’ll compare AVQT scores with VMAF (and perhaps other metrics) and make some observations about how they compare and contrast.
Resources
Here are some additional resources on video quality metrics.