 Streaming Learning Center Where Streaming Professionals Learn to Excel


Related Articles


The top rung of your encoding ladder is the most expensive to deliver, and in many regions, it’s also the most frequently viewed. Encode at too high a bit rate and you’re wasting money; encode too low, and you’re potentially reducing viewer quality of experience. This makes choosing the top rung bitrate a key task for all streaming producers.
This post will help simplify this task. I’ll review two white papers that correlate VMAF scores with subjective quality ratings and share the results of research into the top rung produced by several UGC and cloud encoding facilities. You’ll get a mix of theoretical and real-world data.
The bottom line is that if your top rung VMAF score exceeds 95, you’re wasting bandwidth on video quality that your viewers won’t notice. For premium content producers, this makes VMAF 95 a good target; for UGC and similar content, YouTube and Facebook produce at between 84 – 92.
Contents
Key Research Findings
The first paper, written by RealNetworks CTO Reza Rassool, is entitled VMAF Reproducibility: Validating a Perceptual Practical Video Quality Metric. The paper starts by recounting the benefits of objective metrics and reviews the strengths and weaknesses of metrics like PSNR, SSIM, VQM, and VMAF. Then it describes the testing performed to correlate VMAF scores with subjective ratings.
This involved ten 4K video clips from a Xiph dataset [VQEG4K] encoded at a range of bitrates from 3 to 10 Mbps. First, the clips were evaluated by 18 subjects using double stimulus standardized testing as defined in REC-BT.500 with Normalized Differential Mean Opinion Scores (DMOS) computed on the following scale.
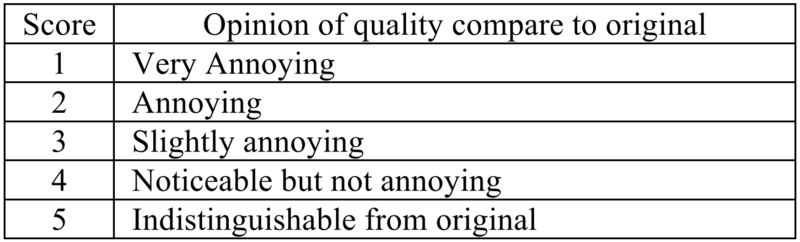
Then Rassool computed VMAF scores for all the clips and correlated the VMAF and MOS scores, finding that ”if a video service operator were to encode video to achieve a VMAF score of about 93 then they would be confident of optimally serving the vast majority of their audience with content that is either indistinguishable from original or with noticeable but not annoying distortion.” In other words, a MOS rating of between 4 and 5.
Regarding the VMAF model used, Rassool writes, “even though the original VMAF was trained on 1080p data we demonstrate its applicability to 4K video.” So, I believe his testing occurred before the 4K model shipped in 2018. After reviewing his findings, I’ve recommended that publishers target VMAF scores of between 93 – 95 VMAF points for their top rung.
The next paper is Fundamental relationships between subjective quality, user acceptance, and the VMAF metric for a quality-based bit rate ladder design for over-the-top video streaming services, written by Andreas Kah, Christopher Friedrich, Thomas Rusert, Christoph Burgmair, Wolfgang Ruppel, and Matthias Narroschke. Kah, Friedrich, Ruppel, and Narroschke are researchers from the RheinMain University of Applied Sciences in Wiesbaden, Germany. Rusert and Burgmair are with the streaming provider Joyn GmbH in Munich, Germany. The goal of this paper was to define an encoding ladder for OTT services that maximized subjective quality while minimizing storage costs.
Like the first paper, the authors performed extensive subjective testing on a 4K TV set using 4K clips and 1080p clips scaled to 4K for viewing. Most clips are from the ISO/ITU test set. The researchers here applied the Double Stimulus Impairment Scale test method defined in the documents JVET-H1002 and ITU-R BT.500 using an 11-grade numerical scale ranging from 0 (very disturbing impairments) to 10 (imperceptible impairments) to evaluate the video signals. Then they measured the VMAF scores of the clips, correlated the scores to the subjective findings, and drew several conclusions. The authors computed VMAF using the default model for 1080p source clips and the 4K model for 4K clips.
At the top end of the encoding ladder, the authors found that a VMAF score of 95 delivered a file that was “on average subjectively indistinguishable from the original video signal.” At the bottom, they attempted to define the “lowest VMAF score for which the video is acceptable for watching by the users” by measuring the acceptance rate for a large range of VMAF scores. For an acceptance rate of 50%, VMAF scores were 55 for free services and 70 for paid services. Their measurements show that the acceptance rate drops below 50% for VMAF scores lower than 55/70.
Having set the ceiling and floor, the authors focused on defining the number of rungs necessary between them. Here they focused on the quality loss associated with the difference between the rung being retrieved and played by the device and the quality of a theoretical rung encoded and played at the actual bandwidth the device was capable of retrieving. This is the quality difference that the service provider can control by adding rungs to the ladder.
To explain, suppose a device could retrieve a 10 Mbps stream, but there was no rung at the bitrate, and the next lowest rung was 8 Mbps. The difference between the 8 Mbps and 10 Mbps stream was leading to the quality delta.
How to minimize this? By creating rungs that are close enough “so that the subjective quality of the video signal is the same for neighboring renditions…This way, any potential quality loss due to not fully exploiting the available transmission rate can be avoided. In addition, switching between neighboring renditions remains subjectively unnoticeable, so that the temporal consistency of the video playback is maximized.”
Testing revealed that viewers were unable to distinguish videos with VMAF scores within 2 points. So, if two videos had scores of 92 and 94, they were visually indistinguishable; beyond that level, viewers started being able to tell them apart. To create a ladder where viewers experience no quality loss due to the difference between the available transmission rate and the actual ladder, you simply produce a ladder where all rungs are no more than 2 VMAF points apart.
For ladders targeting free services, you have a floor of 55 and a ceiling of 95. So, the ideal ladder would include 21 rungs ((95-55)/2)+1). Using the same math, the ideal ladder for a paid service with a floor of 70 and a ceiling of 95 would have 13 rungs. If you less than the recommended number of rungs in either case, the quality loss between the rungs may become noticeable.
Analysis:
At the top of the ladder, while “subjectively indistinguishable from the original video signal” might be too high a bar for some services, it seems clear that VMAF scores above 95 likely waste bandwidth on video quality that no viewer will notice.
At the bottom of the ladder, if you’re creating one encoding ladder for all viewers, including mobile, computer, and smart TVs, in my opinion, it’s unlikely that you’ll want to stop at a VMAF score of 55/70 since this will leave few if any streams for devices connecting at 1.5 Mbps or below. I asked the researchers about using a single ladder created for mobile, desktop, and living room viewing. They responded, “Our investigations focused on large screen TVs as these are most sensitive with respect to impairments becoming subjectively visible.”
Even for ladders targeting only smart TVs, depending on the business model, many services may likely decide to offer streams below the 55/70 VMAF level with acceptance rates of less than 50% so viewers can decide whether to continue watching rather than experiencing playback stoppages or seeing a buffering icon. That said, the sections of the scientific research paper detailing how viewers reacted to temporary and perceived permanent low quality make for interesting reading.
Regarding the finding that viewers notice a VMAF difference greater than 2 points, Netflix advised back in 2017 that 6 VMAF points constituted a Just Noticeable Difference (JND), which is defined as a difference that most viewers can notice greater than 50% of the time. I asked the authors about this and they responded, “At the top end of the VMAF scale, we measured a noticeable subjective quality difference for VMAF scores being lower than 95, i.e. 94 and smaller. This seems to be in the same range as for Netflix. In the range below 95, we observed people seeing no subjective differences for the case of videos being up to 2 VMAF scores apart for the same content. Starting from 3, people start seeing differences.”
Assuming these researchers and Netflix are both correct, a VMAF delta under 2 is irrelevant, deltas above 2 will start to be noticeable, and deltas above 6 will be noticeable by 50% of the viewers.
Finding the Top Rung
Both papers tie VMAF scores to subjective quality ratings but not to specific publisher practices. The second paper’s distinction between paid and free services also raises the question of whether the quality ceiling should change based on that distinction. To explore this issue, I uploaded the same seven test clips to five services shown in Table 2, then downloaded the clips and measured their VMAF scores using the default model.
Note that all of these services deploy some form of per-title encoding that customizes the encoding parameters for each clip. Implicit in per-title encoding is some perception of the quality necessary for the top-rung of the encoding ladder, which provides real-world input to consider with the theoretical input of the two papers.
Obviously, YouTube and Facebook are user-generated video (UGC) services. YouTube produces all clips in both VP9 and H.264 formats, so I downloaded and measured both. Interestingly, Facebook uses a sophisticated cost/benefit model to predict views of an uploaded clip and encodes at different quality levels depending on that finding. Correctly predicting the low playback volume of my clips, Facebook encoded them at 720p using the H.264 codec. As you can see here, Facebook encodes some clips up to 1080×1080 and potentially beyond, using a mix of H.264 and VP9, and reportedly in AV1, though I found no AV1 encoded clips in my brief study.
Vimeo, Azure, and Elemental are all premium services. I selected these services because, unlike those from Bitmovin, Brightcove, and Tencent, users don’t have the ability to set a target quality level. You upload the files, and you get what you get. Since all of these services are mature, presumably, this top rate has been customized to provide their customers with a commercially acceptable blend of quality and efficiency.
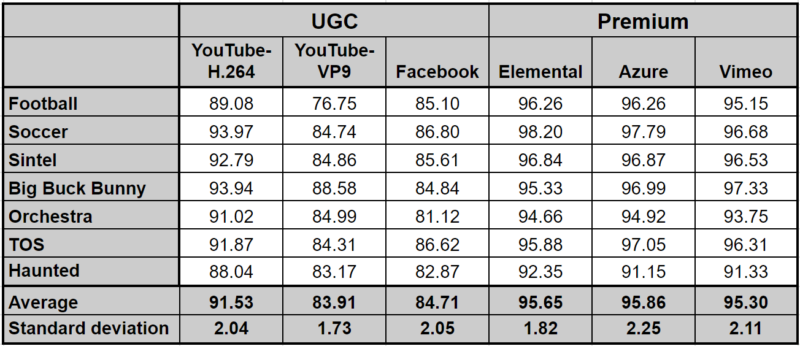
Though the dataset is limited, the results seem to suggest that:
- Premium services tend to target between 95 – 96 for the top rung
- UGC services set a lower threshold which ranges from 84 to 92.
Quality Deltas Between H.264 and VP9
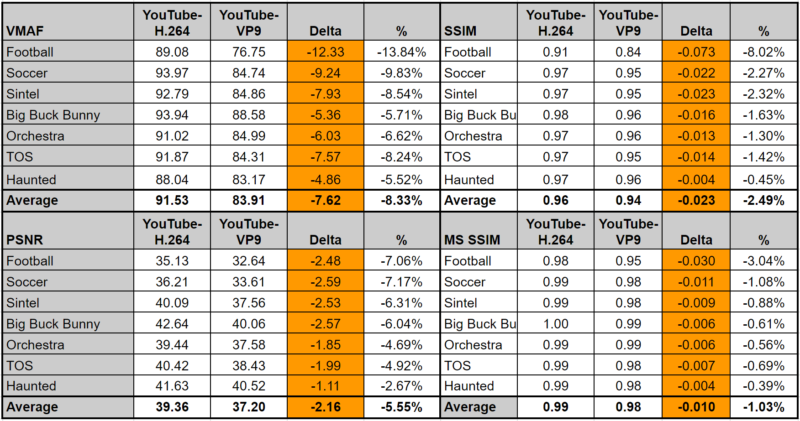
The quality difference between YouTube H.264 and VP9 was a head-scratcher. The VP9-encoded videos were produced at 51% of the data rate of the H.264 videos, but you would expect that the quality targets would be the same. I wondered whether the quality difference might be VMAF specific, so I measured with PSNR, SSIM, and MS SSIM, and that appeared to be partially the case (Table 2). Still, in all instances, H.264 delivered superior quality, and the difference was significant for VMAF, PSNR, and SSIM.
The Bottom Line
The bottom line is that if the VMAF score of any of your videos exceeds 95, you’re wasting bandwidth on quality that viewers can’t distinguish. If you’re distributing premium content, 93-95 should be your target since viewers wouldn’t notice the difference between videos with VMAF scores of 93 and 95. However, video at a VMAF score of 93 is subjectively distinguishable from the original video signal on average. If you’re distributing UGC or similar content, VMAF scores of between 84 – 92 have proven acceptable for Facebook and YouTube and might be a more acceptable target.
I’m guessing that few streaming producers will start deploying ladders with 21 or even 13 rungs since this might double or even triple encoding costs. Similarly, it feels like most producers, even those with living room-specific ladders, will serve videos at bitrates lower than the 55/70 VMAF quality point on the assumption that it’s better to serve a stream the viewer gauges as unacceptable than to simply provide a “streaming not available” or similar message. That said, the second paper provides useful input into the implications of both decisions.
As a final note, all of the tests discussed above are related to large-screen devices. Obviously, if you’re creating an encoding ladder exclusively for mobile distribution, you should use the mobile VMAF model. Even with that model, however, none of the above findings verify that 95 is the magic number.


