Streaming Learning Center Where Streaming Professionals Learn to Excel

Related Articles
Moscow State University’s Video Quality Measurement Tool (MSU VQMT) is my go-to utility for computing and visualizing objective metrics like VMAF, PSNR, and SSIM. In version 13, MSU increased codec compatibility and metric performance, added new HDR metrics and display capabilities, and enhanced VQMT’s already best-in-class visualization tools. If you’re a VQMT user, it’s an essential upgrade. If you’re not, now would be a great time to consider buying the $999 utility.
Contents
AV1 Support
You can access a complete list of new features here. Near the top of the list is native support for AV1-encoded videos. In previous versions, you had to decode your AV1 files to YUV before analyzing them in VQMT. With version 13, you can now input AV1 files directly into VQMT, which is a nice convenience.
Faster VMAF
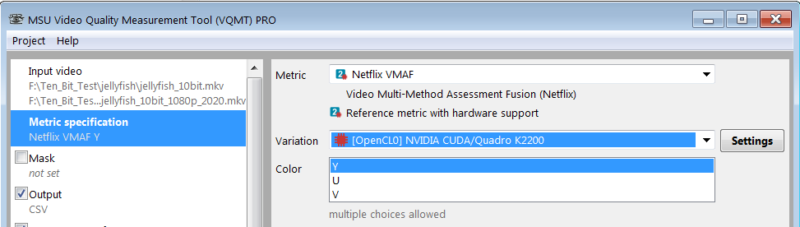
VMAF is certainly the benchmark that I run the most and computing VMAF is inherently slow because it’s composed of four separate metrics (that’s why it’s called Video Multimethod Assessment Fusion). In version 13, MSU accelerated VMAF via OpenCL which should work on both AMD and NVIDIA graphics cards. You enable the feature by selecting that variation in the Metric specification screen as shown in Figure 1.
I tested the new feature on two computers, an HP Z840 workstation with two E5-2687W v3 Xeon CPUs running at 3.1 GHz totaling 40-cores, and a Quadro K2200 GPU-based graphics card. I also tested on an 8-core HP ZBook Studio G3 running a Xeon E3-1505M CPU and Quadro M1000M GPU.
In the first test for both computers, I computed VMAF for a single ten second file. On the Z840, the GPU-based approach was 67% faster, which is quite dramatic. On the Z-book, with a less powerful mobile GPU, the improvement was 40%; still impressive but less so. Then I tested two ten-second files in a single VQMT instance, and comparative performance improved slightly on both computers.
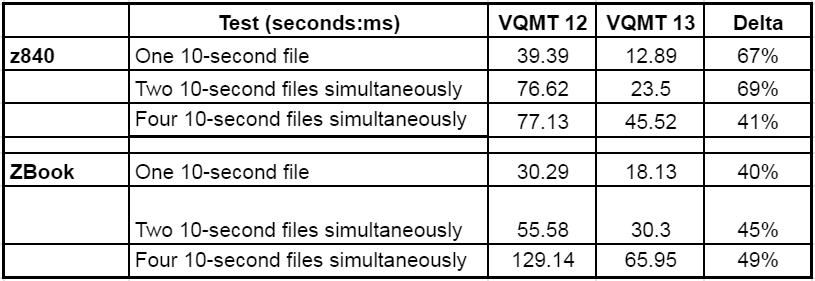
Then I tested four simultaneous calculations with four instances of VQMT running simultaneously. I run simultaneous computations frequently because VMAF computation is single threaded and you get much better throughput running 4-6 instances than you would running just one or two, particularly on the Z840. Interestingly, here, comparative performance on the Z840 dropped to 41%, while the benefit on the notebook increased to 49%.
I was testing to see if there was a crossover point in terms of the number of VQMT instances where CPU-based computations might make sense, though my tests didn’t reveal that threshold. If you’re running multiple VQMT instances on a fast multicore computer with a weak GPU, you might perform similar tests to gauge the benefit of the GPU-based computations. For the record, I checked the GPU and CPU-based scores, and they were identical.
Subsampling Operation
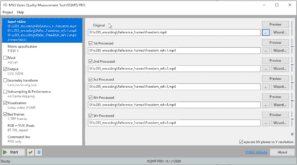
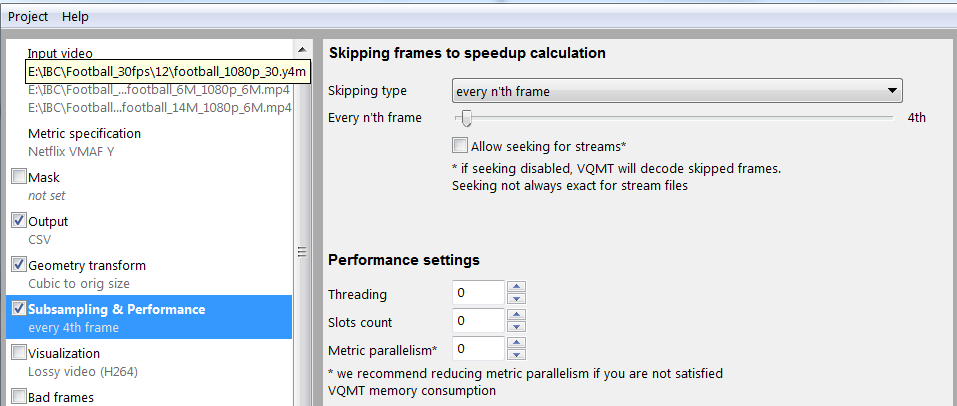
If you’re really under the gun timewise there’s another feature you should know about that was introduced in version 12; subsampled operation. You select this in the Subsampling & Performance tab shown on the left in Figure 2, using the controls on the upper right. In the figure, I’m scoring every fourth frame, which should speed operation significantly, and does. The question is, how does it change the scoring? The answer is, yes, but not much.
You see this in Table 2. Testing every frame on two one-minute test files took 131 seconds, which dropped to 42 seconds when testing every fourth frame, not quite the expected 75% savings but close enough. However, neither the VMAF mean nor the low frame score (a measure of the potential for transient quality problems), changed by anywhere near a relevant amount.

I would confirm these results with other files before adapting a subsampled approach for my research, but this approach looks promising when you need VMAF scores in a hurry.
HDR Metrics and Visualization
The next major version 13 additions were HDR metrics, specifically PSNR, SSIM, MSSSIM, VQM, and Delta ICtCp. By way of background, SDR metrics have been proven unreliable when applied to HDR videos because SDR and HDR use different transfer functions and color spaces with very different brightness levels (see Benchmarking of objective quality metrics for HDR image quality assessment and Practicalities of predicting quality of high dynamic range images and video. For a simple explanation of the different color spaces and transfer functions, see here). In essence, SDR metrics don’t “see” the pixels the same way that human eyes would on HDR displays so can’t accurately predict human ratings.
The bottom line is that you can’t reliably use SDR metrics to analyze HDR videos. VMAF doesn’t have an HDR version; in this video Christos Bampis from Netflix acknowledges that whether you can use VMAF with HDR video is an open question. In this blog post, respected compressionist Fabio Sonnati states that “VMAF 4K is not tuned for HDR so I’ll limit my considerations to the SDR case.” If you’re an HDR producer, these new metrics make VQMT exceptionally relevant to your practice.
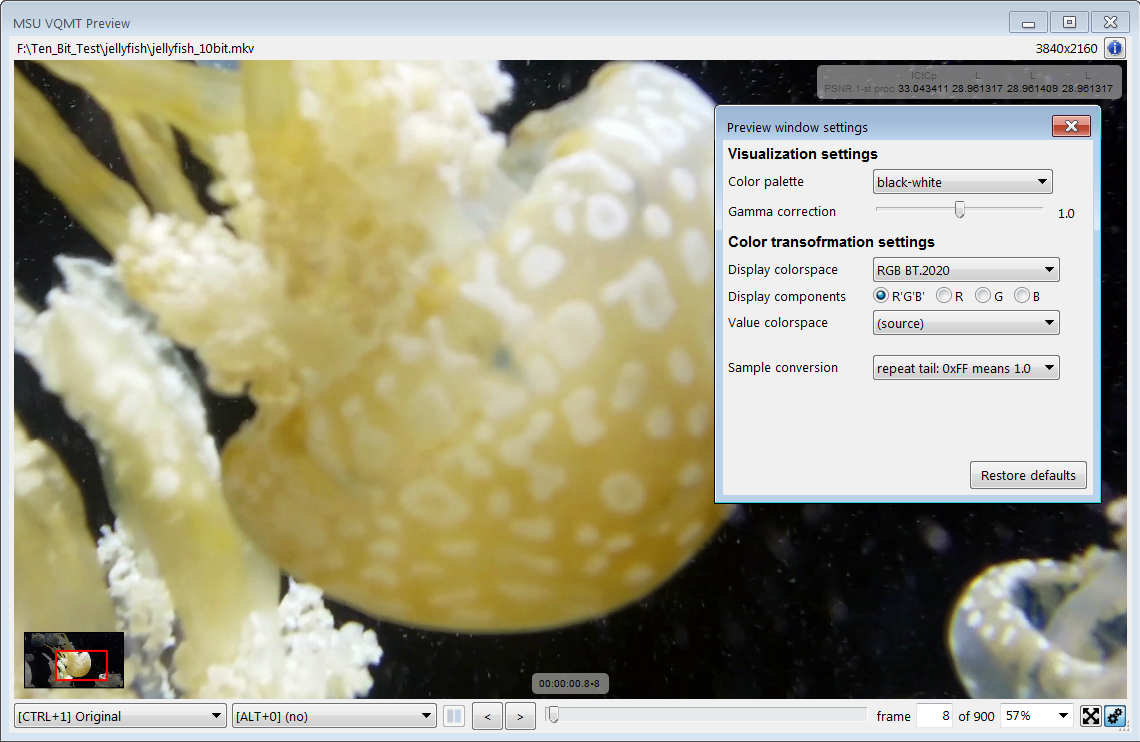
Operating the HDR metrics is very flexible. For example, before starting the measurements you can choose the input color space for the videos, with choices like BT.709, BT-2020 and others. After you run the metric, you can display the video frames using different display color spaces to simulate the appearance of the video on another device. There’s little by way of explanation however, so unless you’re very conversant in color spaces you may find the flexibility daunting. I certainly did, but with HDR increasing in prominence it’s good to have a tool with the features to address it.
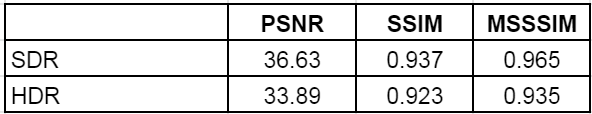
To get a sense of the new HDR metrics, and how they differ from the SDR versions, I tested an HDR clip using both the SDR and HDR versions of PSNR, SSIM, and MS SSIM (Table 3). As you can see the scores are different though not radically so. Still, if you’re benchmarking HDR quality you should use HDR metrics. For the sake of completion, note that SSIMWAVE’s SSIMPLUS metric is HDR compatible providing another valuable option (see here).
Improved Visualization Tools
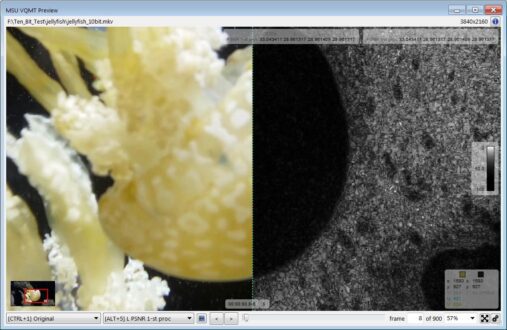
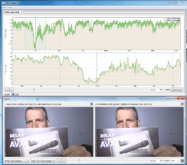
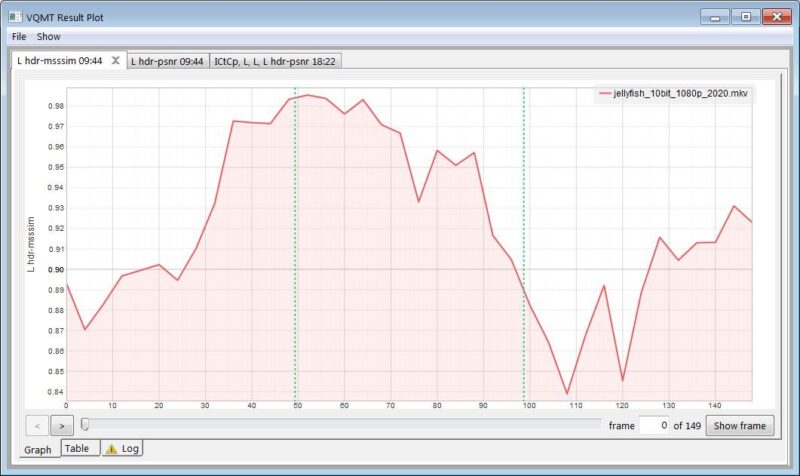
Video quality metrics often get criticized as inaccurate predictors of subjective evaluations. For this reason, it’s critical to confirm key scores by actually watching the videos and observing the frames. VQMT has always excelled at this by producing a Results Plot (Figure 4) that shows the score of one or two clips over the file duration to visually identify any problem areas. Then you can move the playhead to that frame and click Show Frame on the bottom right to view the source and compressed frames.
In previous versions, you could load the frames side-by-side or toggle between the views with simple keystrokes (Ctrl + 1 for original frame; Ctrl +2 for first encode; Ctrl +3 for second encode). However, side-by-side views make it tough to see subtle differences and sequential viewing of the source frame and encoded frames was effective when running VQMT but hard to show in a PowerPoint deck or report.
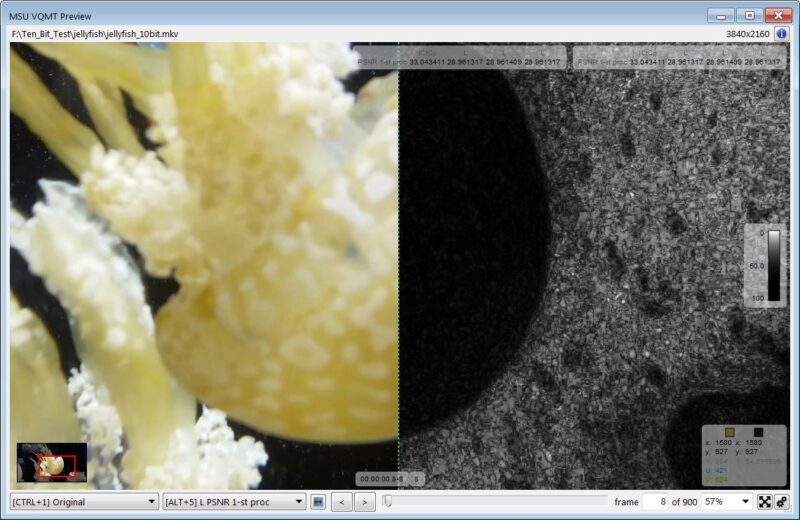
With Version 12, MSU added the ability to visualize the frame differences via the residue plot shown in Figure 5 with configurable color pallets and gamma correction for the visualization. In this view, the greater the residue in the visualization plot the greater the distortion. Not only does this help verify your observations when driving the tool in person, it’s an exceptionally useful way to show encoding related impairments in a graphic form.
I’ve been a huge fan of VQMT (and the MSU team) since I started using the tool in 2015 or so, and MSU continues to evolve the tool in all relevant vectors; performance, included quality metrics, and usability. If you’re serious about experimenting with different codecs and/or encoding parameters, it’s an absolutely essential tool.