Streaming Learning Center Where Streaming Professionals Learn to Excel


Related Articles

Author’s note: After completing this long and arduous post, Apple sent a note that I was interpolating their scores incorrectly, leading to more analysis shown as an addendum below.
What: This article compares Apple’s AVQT metric to VMAF and SSIMWAVE’s SSIMPLUS metrics, with very limited subjective testing from Subjectify.us. The testing was extremely limited as are the conclusions you should draw from the results. This is the third article in the AVQT series, with an overview article here, and the user experience described here.
What conclusions should you draw from this testing?
1. That AVQT, VMAF, and SSIMPLUS gauge quality differently. It doesn’t appear that you can use AVQT as a faster VMAF or cheaper SSIMPLUS and achieve the same results.
2. Compared to the very, very limited subjective testing that I performed, SSIMPLUS and VMAF both performed slightly better than AVQT.
What conclusions should you NOT draw from this testing?
VMAF and SSIMPLUS are better predictors of subjective evaluations than AVQT. This may be, but I didn’t perform sufficient testing to validate this conclusion.
Why did you perform such limited testing?
Let’s get this out of the way. I wanted a quick and dirty look at how AVQT compared to VMAF and SSIMPLUS. If the scores aligned perfectly, it might be that AVQT could serve as a faster VMAF or a cheaper SSIMPLUS. That didn’t turn out to be the case.
I added subjective testing via Subjectify.us because I wanted a quick look at how these results would compare to the metrics.
Some who read this article may feel that too little data is less useful than no data, or certainly potentially more misleading. That’s only true if you attempt to draw conclusions beyond those listed above. Publish your own study and I’ll be glad to share the results on this blog.
Contents
Testing Overview
I tested 10-second versions of two clips, Harmonic’s Football, and Blender Foundation’s Sintel. I measured video quality with AVQT, VMAF, and SSIMPLUS.
I tested three scenarios that I define further below.
- 1080p quality from 5000 kbps to 300 kbps
- The quality of full x264-encoding ladders for each clip.
- The quality of 800 kbps outputs at 270p, 360p, 540p, 720p, and 1080p. This is the scenario that I also tested with Subjectify.
I don’t claim that these tests represent any “perfect” or even “appropriate” test cases to differentiate the three metrics; they are just the tests I was interested in and had time to produce.
Metric Settings
Here are the tools and settings that I used for each metric. Here are some considerations that impacted all settings:
- The Subjectify service tests only on computers, not mobile devices or smart TVs. For this reason, I customized all scoring for these conditions.
- When possible, I computed the results using the Harmonic Mean pooling method because this reflects the negative impact of low-quality frames in the video on the overall quality of experience. In contrast, the arithmetic mean pooling method simply averages the frame scores.
Settings for AVQT
For those just joining the series, AVQT is Apple’s free Advanced Video Quality Tool that runs only on Macs. I computed scores using the AVQT command-line application using the following settings.
AVQT -sd 25 -tp HarmonicMean -o football_1080p_800.csv -t football_1080p_800.mp4 -r football_10.mp4
- SD – forces a segment duration of 25 seconds so AVQT will deliver one score for the entire 10-second video
- TP – Harmonic Mean temporal pooling
- Display Resolution – not listed, so AVQT used the default setting of 1080p
- Viewing distance – not listed, so AVQT used the default setting of 3H, or 3x the display height
According to the AVQT ReadMe file, “AVQT scores align with the MOS (Mean Opinion Score) scale. The score is a floating-point number between 1 and 5, where 1 is BAD, 2 is POOR, 3 is FAIR, 4 is GOOD and 5 is EXCELLENT quality.
Settings for VMAF
VMAF is Netflix’s open-source video quality metric that’s available in FFmpeg and a number of other tools on Windows, Mac, Linux, and other operating systems, like the Moscow State University Video Quality Measurement Tool (VQMT) that I used in this study. Specifically, I computed VMAF scores with version 13.1 alpha, January 2021, using the following command line.
msu_metric.exe" -orig football_10.mp4 -in football_1080p_800.mp4 -csv -metr vmaf over YUV-Y -dev OpenCL0 -resize lanczos A to orig -no-upscale-uv
- Resized lower resolution videos to 1080p using Lanczos method (see here)
- This string uses the default VMAF model which predicts subjective quality on a “1080p display with a viewing distance of three times the screen height (3H)“
- MSU reports both the arithmetic and harmonic means in the CSV file and I recorded the latter results
According to this Netflix article, “VMAF scores range from 0 to 100, with 0 indicating the lowest quality, and 100 the highest…[T]he default model v0.6.1 is trained using scores collected by the Absolute Category Rating (ACR) methodology using a 1080p display with a viewing distance of 3H. Viewers voted the video quality on the scale of “bad”, “poor”, “fair”, “good” and “excellent”, and roughly speaking, “bad” is mapped to the VMAF scale 20 and “excellent” to 100.”
Settings for SSIMPLUS
The SSIMPLUS metric is produced by SSIMWAVE, and is available only in products from SSIMWAVE. In the interest of full disclosure (and as mentioned in the last AVQT article), I occasionally produce training videos for SSIMWAVE on a consulting basis.
I produced the SSIMPLUS scores using version 2.6.1-8 of the SSIMPLUS VOD Monitor. The SSIMPLUS metric has multiple analysis modes and multiple scores, and you can compute those scores using different device profiles. Here are the key parameters that I used:
- Expert mode – According to the SSIMPLUS documentation, experts “examine the details of quality degradation, such as loss of detail, blur, noise, false contour, blockiness and flickering,” and “inspect videos by standing very close to a monitor.” In contrast, “Consumers look at the overall impression of video quality” and “watch videos on a TV in their living room.” I chose expert mode as the best match for the tests performed by Subjectify which I’ll detail below. Note that one result from this selection is that “For the same video and device, the expert scores are generally lower than the consumer scores.”
- SSIMPLUS Viewer Score (SVS) – As you can read about here, SSIMPLUS has multiple metrics. I used the SVS which measures “the overall quality experienced by the viewer, as it considers both the quality of the original asset and the impact of the encoding process as perceived by the human visual system.”
- Device preset – I measured quality using the VG27HE preset, which is for an older 27″ 1080p monitor. I used this 1080p preset to match the viewing assumptions of the other metrics. SSIMWAVE disagreed with this approach for reasons that I’ll share in the analysis below.
According to this article by the developer of SSIMPLUS, “SSIMPLUS provides straightforward predictions on what an average human viewer would say about the quality of the video being viewed on a scale of 0-100, which is evenly divided to five quality ranges of bad (0-19), poor (20-39), fair (40-59), good (60-79), and excellent (80-100), respectively.”
Mapping the Scores
Both VMAF and SSIMPLUS rate from 0 to 100 using a similar scale so the scores are easy to compare. AVQT rates from 1-5; to spread these scores from 0 – 100 I used the following formula.
=((AVQT–1)/4)*100
Test Results
Here are the results for the three test cases.
1080p Quality from 5000 kbps to 300 kbps
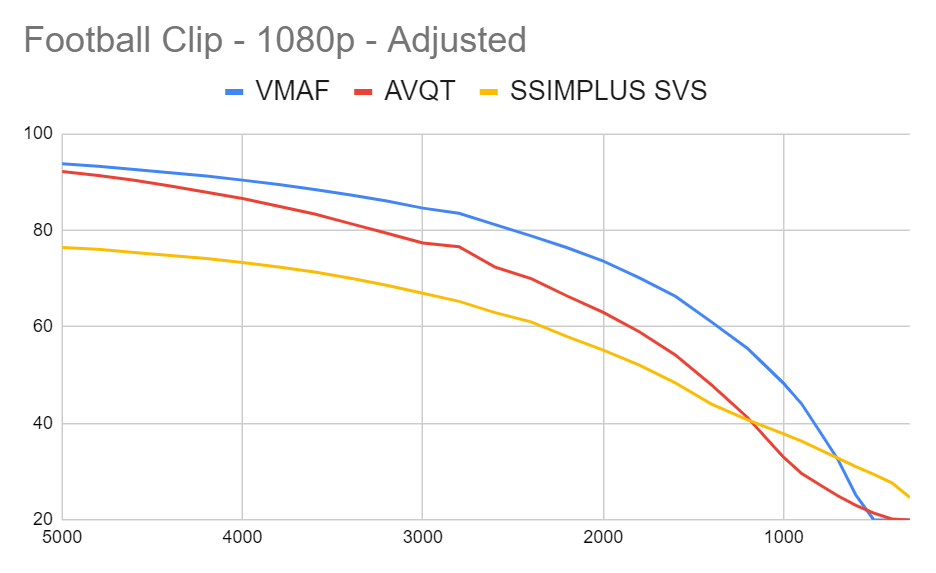
For this test, I encoded the two clips from 300 kbps to 5000 kbps and measured the quality with the three metrics. Figure 1 shows the Football clip (1080p30).
This is a challenging clip with high motion and lots of detail. The relevant range for actually distributing this clip in the first or second rung of the encoding ladder would likely be from 3.5 Mbps – 5 Mbps. Within this range, VMAF and AVQT scores are similar with SSIMPLUS SVS lower, at least in part because I used expert mode.
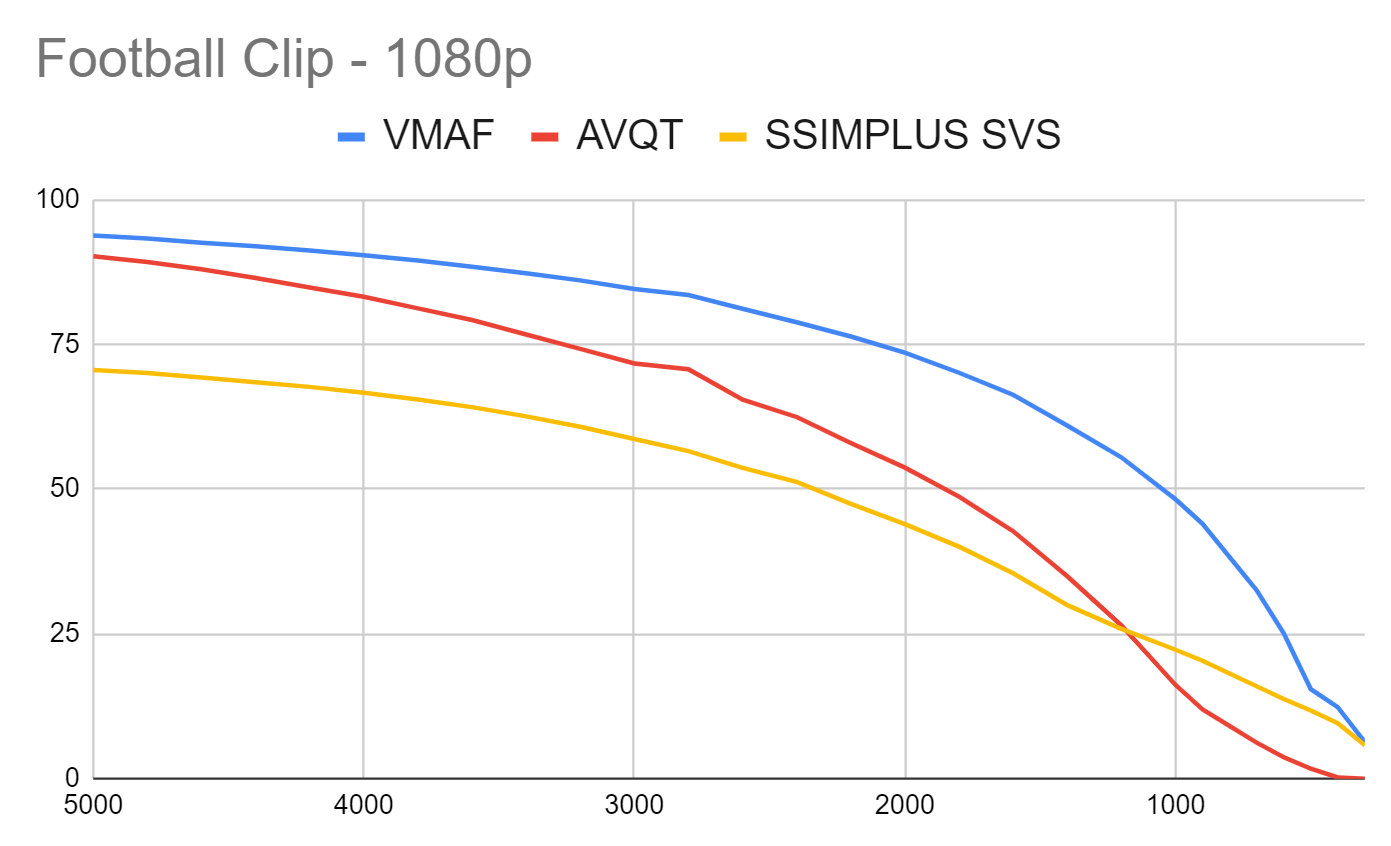
VMAF maintains much higher ratings at lower data rates and then drops precipitously after about 2 Mbps. Still, VMAF produces much higher scores than AVQT or SSIMPLUS below 2.5 Mbps until 400 kbps or so.
SSIMPLUS SVS drops more consistently throughout the data rate range though its slope mirrors VMAF very closely until under 1100 kbps or so. AVQT has a completely different slope indicating a different measure of low bitrate quality.
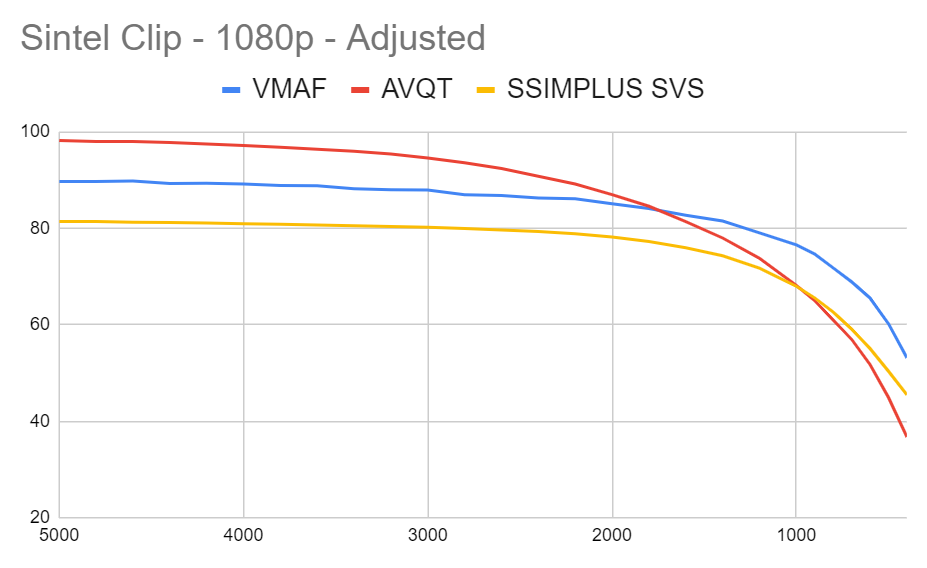
Figure 2 shows the Sintel animation (1080p24). Here the relevant range for shipping the first or second rungs of the ladder is from 2 Mbps – 5 Mbps (though you probably don’t need to ship at higher than 2.5 Mbps).
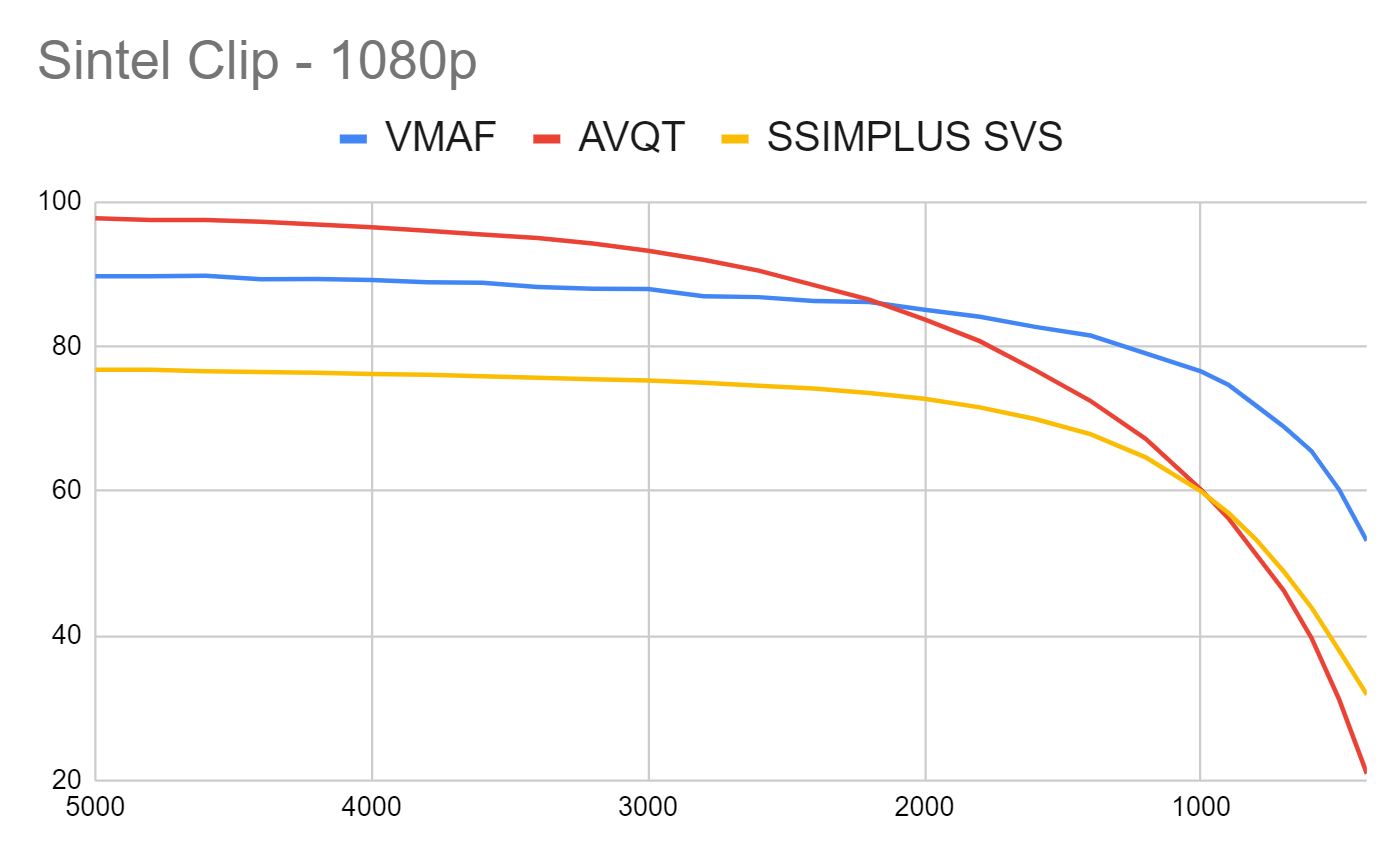
Again, though SSIMPLUS SVS is lower than VMAF, the drops in scoring are relatively consistent. In contrast, AVQT starts out much higher than the other two and then drops much lower, indicating a different quality gauge at lower data rates than the other two metrics.
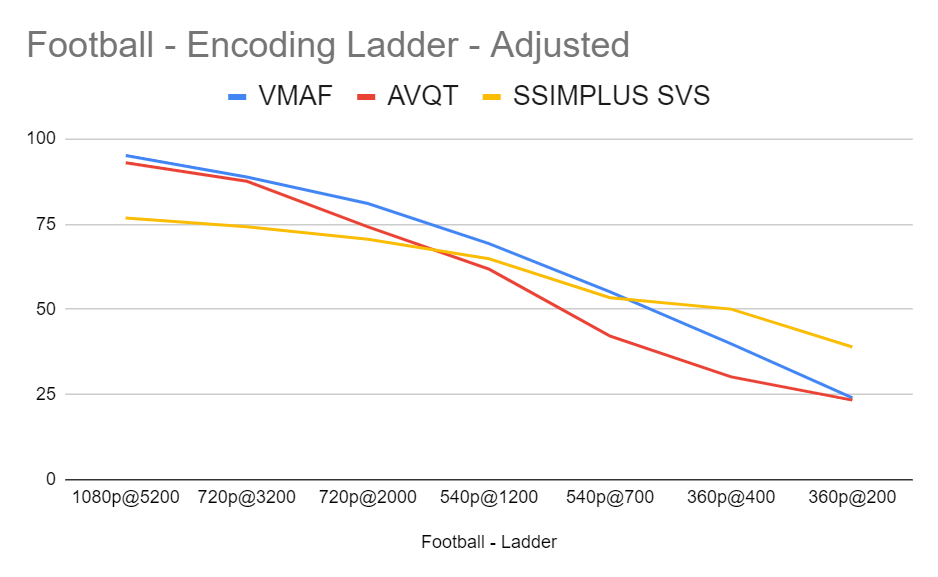
Gauging the Quality of an x264-Encoding Ladder
I used these ten-second clips as part of a VP9 test suite (see here). As part of that exercise, I built custom ladders for each clip using the Convex Hull-based procedure first widely used in Netflix’s per-title encoding technology. This produced optimized encoding ladders for each clip. Here I gauge the quality of those encoding ladders with the three metrics.
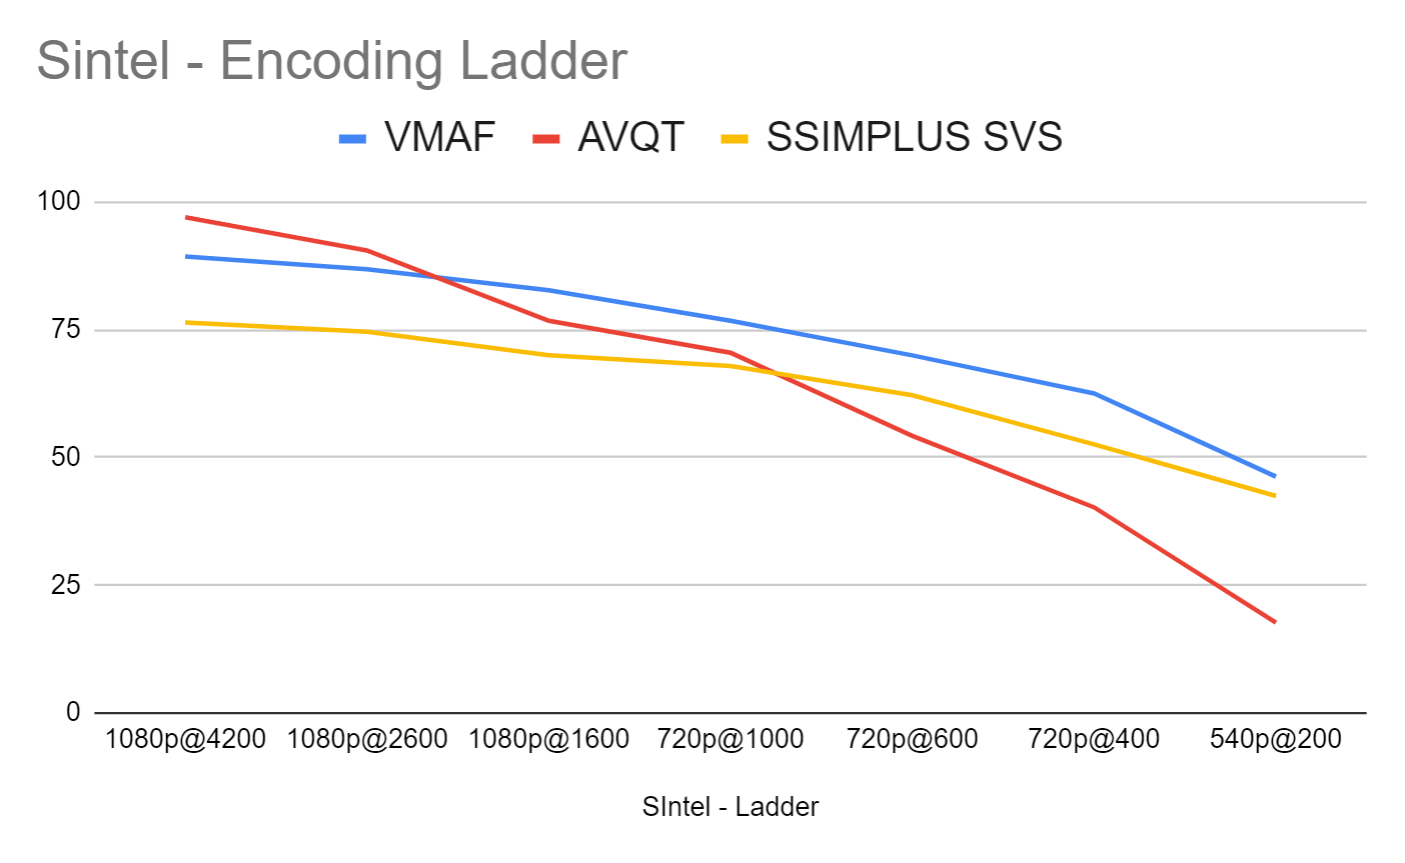
Looking at both clips, it’s no surprise that the VMAF metric is the smoothest of the three since I used VMAF to build the encoding ladder. Again, in both clips, VMAF and SSIMPLUS SVS roughly track the same path with SSIMPLUS lower in part because of using expert mode. In contrast, AVQT starts near VMAF at the top of the ladder and then slashes down in both cases.
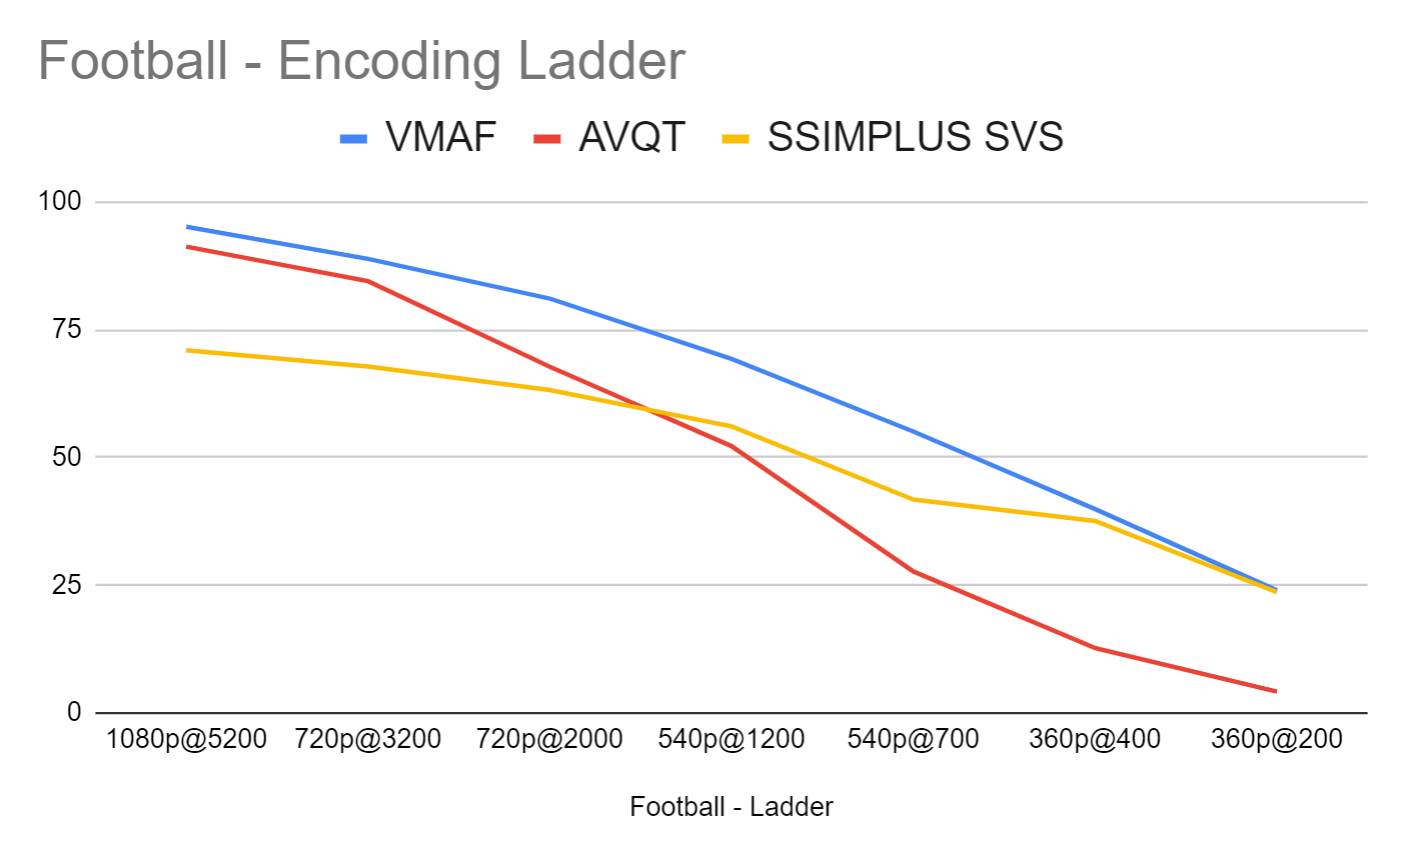
In both clips, it’s surprising how closely SSIMPLUS and VMAF align, particularly at the low end. While all metrics seem to prefer higher resolution files over lower resolution files, AVQT tends to score lower resolution files particularly harshly.
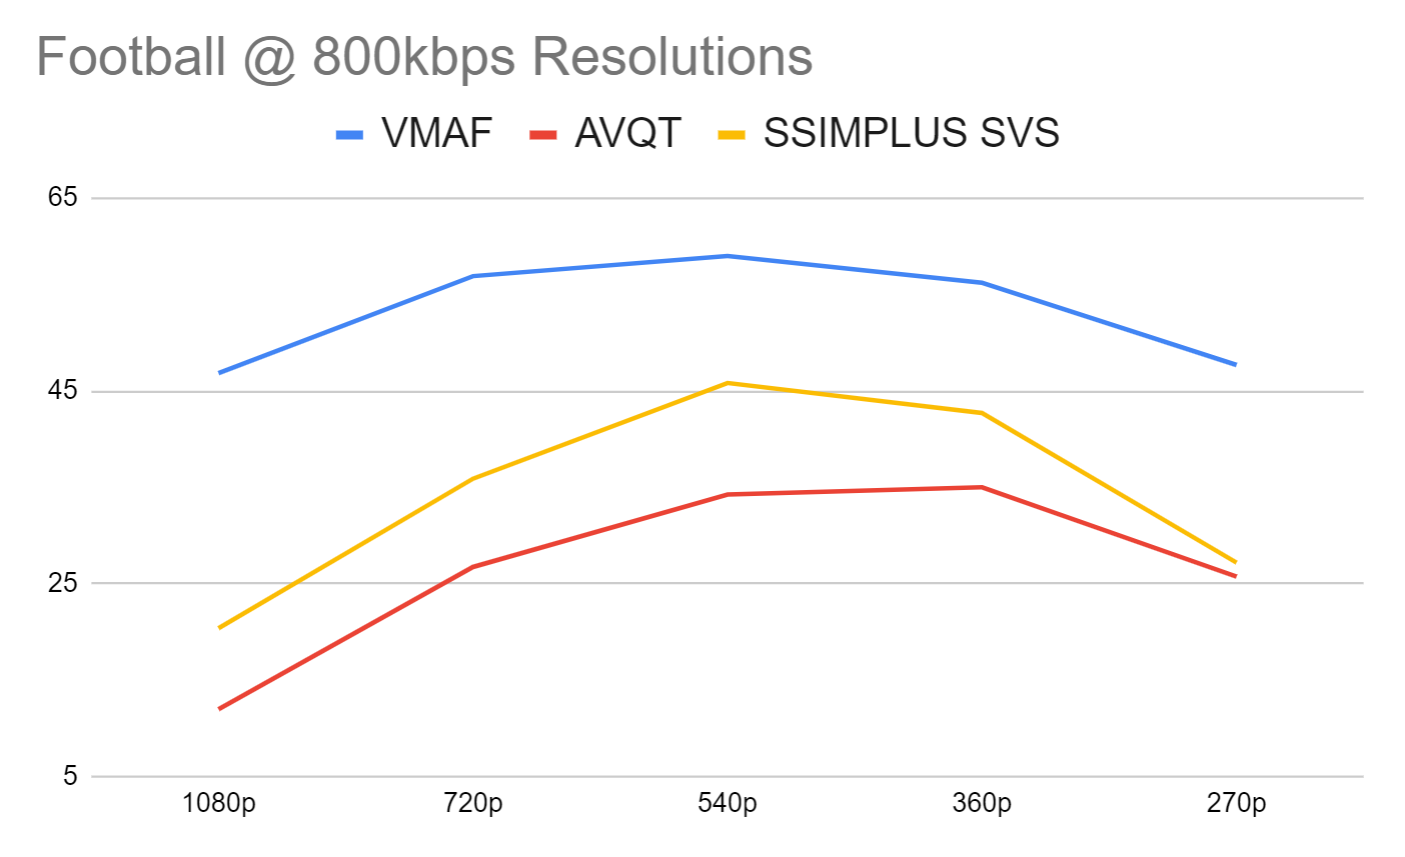
800 kbps Outputs at 270p, 360p, 540p, 720p, and 1080p
In the Convex Hull method discussed above, you encode at multiple resolutions at each data rate and then use your metric to choose the highest quality resolution for that rung. So, in this trial, performed that analysis at 800 kbps at the resolutions shown above and used the metrics to choose the highest quality option. This is the test case that I also verified with Subjectify.
Looking at the Football clip, we see that VMAF and SSIMPLUS SVS identified the 540p version as the top quality alternative, while AVQT narrowly favored the 360p output. We also see that while VMAF rated most clips in the fair range (45 – 60) with a relatively low scoring differential (the lowest quality clip was 79% the value of the highest clip).
In contrast, both SSIMPLUS SVS and AVQT rated clip quality bad to poor with a much higher scoring differential, with the low clip 45% the quality of the high clip for SSIMPLUS SVS and 34% for AVQT. Looking ahead, Subjectify scored the lowest quality clip at 52% of the highest quality, closest to the SSIMPLUS SVS measure of the delta between the highest and lowest quality.
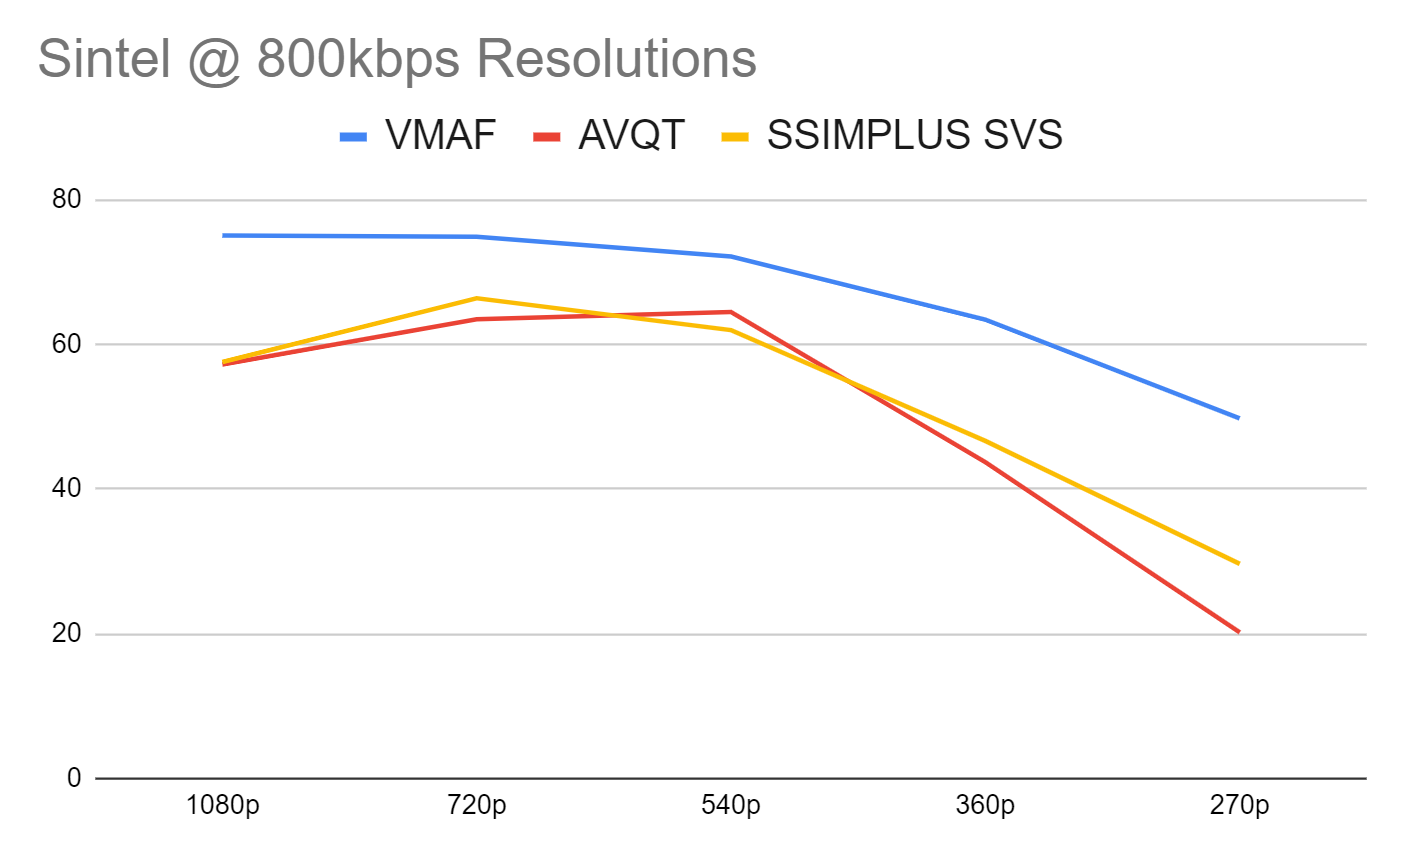
In the animated Sintel clip, VMAF chose the 1080p clip very narrowly over the 720p clip, again with much lower variability than the other two metrics (low clip was 66% the quality of the high clip). SSIMPLUS SVS chose the 720p clip, AVQT the 540p output, while both showed significantly higher variability than VMAF, with the lowest quality SSIMPLUS SVS clip 45% of the highest, and 31% for AVQT. In the Subjectify ratings, the lowest quality clip rated 64% the quality of the highest, closest to VMAF’s scoring.
About Subjectify
Subjectify is a service from Moscow State University, the developers of the Video Quality Measurement Tool and producer of multiple codec and cloud encoding service comparisons. You upload your clips to the service and they recruit test participants and run the tests on computers only, no mobile devices or Smart TVs.
As described here, the reviewers watch two clips and then choose the higher quality option. It’s a great way to rate different codecs or encoding alternatives, but you don’t get an absolute quality rating for any clip. You just get a ranking of how the clips compared quality-wise, which can be a touch limiting.
For example, Figure 5 raises two questions; which metric chooses the right resolution, and whether the clips are really fair in quality (like VMAF indicates) or bad to poor (SSIMPLUS SVS and AVQT). Subjectify will tell you the former but not the latter; for that, you’d need a traditional subjective evaluation that ranks the clips on a scale from 1-5.
Unfortunately, those types of evaluations take weeks and cost in the low four figures. In contrast, for under $350, Subjectify delivered 157 reviewers making 1,570 ratings so each pair was rated around 20 times.
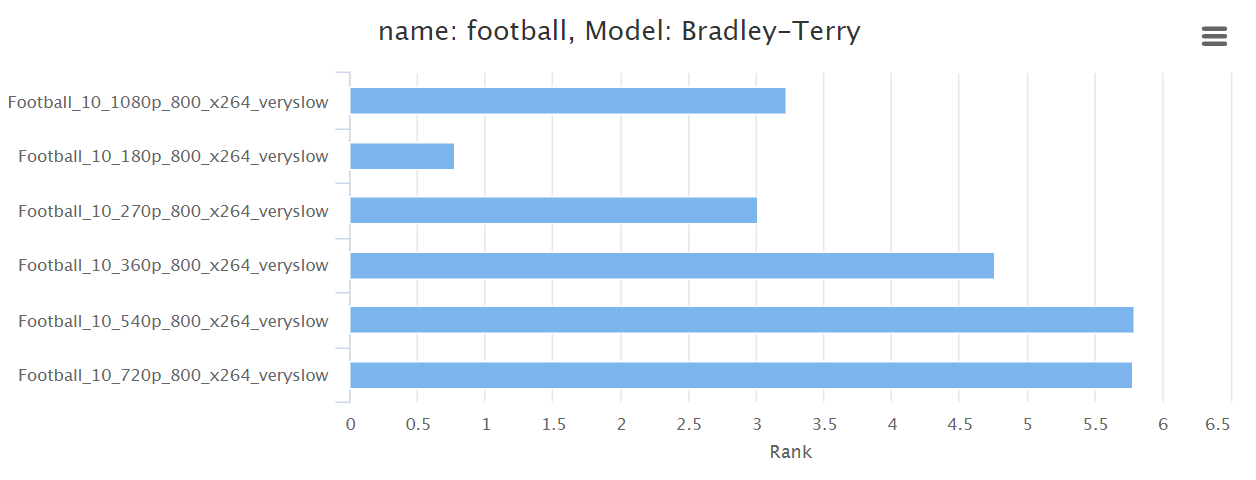
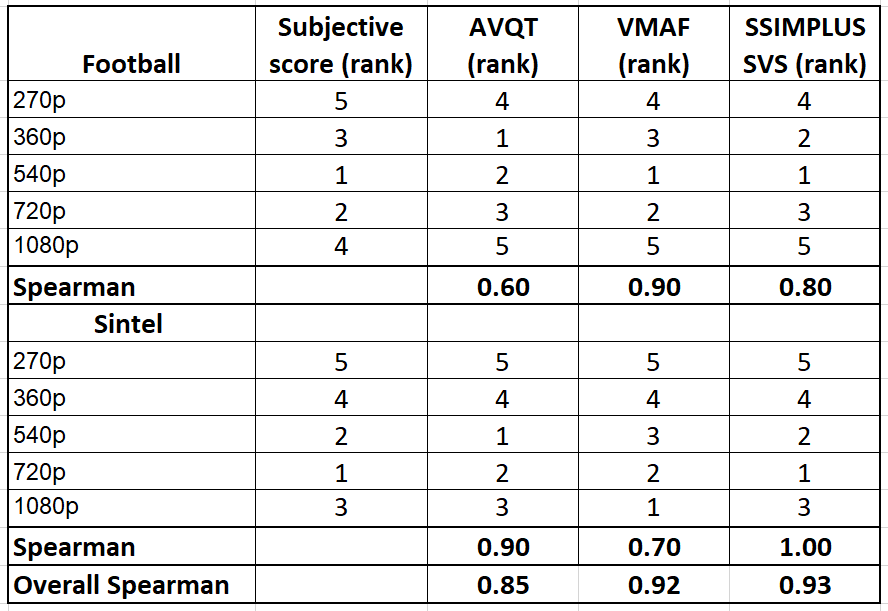
Figure 7 shows the results from the Football clip. Note that the 180p clip was incorporated in the subjective analysis but not the objective metrics because AVQT doesn’t work at that low resolution. Both VMAF and SSIMPLUS SVS chose the 540p as the top clip, though with only a .02 difference between first and second either choice would be fine. However, AVQT chose the 360p as the highest quality which has a much greater margin. We’ve already discussed the scoring differential between these results and the metrics, with SSIMPLUS SVS the closest.
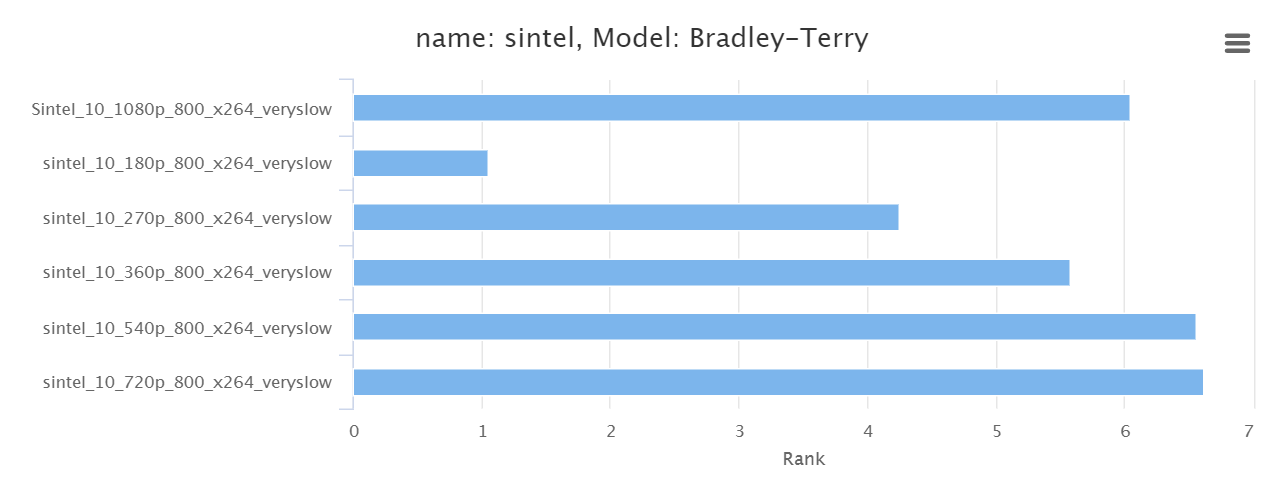
In the Sintel clip, SSIMPLUS SVS did the best job choosing the right order and estimating the differences between the top three alternatives though, as mentioned, the dropoff to 270p is more striking than the subjective evaluations seem to call for. AVQT reversed the order of the top two clips, which is pretty much irrelevant given the .07 delta between them, and also judged the lowest quality clips more harshly than the subjective ratings called for.
VMAF chose the 1080p clip first, a miss that won’t surprise many VMAF users as this metric seems to generally favor higher over smaller resolutions, particularly for animated clips. With about a 9% difference between the selected 1080p clip and the top-rated 720p clip, this is a moderate miss. Though VMAF modeled the differential in the data more accurately than the other two metrics, this is irrelevant when the object of the exercise is to pick the right winner.
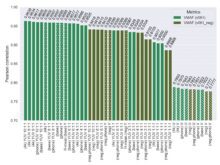
Wouldn’t it be great if we could express this accuracy as a metric? Well, we can by using Spearman’s Rank Correlation Coefficient. As the name suggests, Spearman’s measures the accuracy of the correlation between the ranking in the subjective results and the ranking in the three metrics. You see the individual rankings for each metric in Figure 9, plus the overall metric, which is computed by analyzing the overall rank for all clips together rather than averaging the two scores. By the way, this computation is available in Excel and Sheets as the CORREL function.
How to interpret the Spearman’s score? According to Statistics by Jim:
Spearman’s correlation coefficients range from -1 to +1. The sign of the coefficient indicates whether it is a positive or negative monotonic relationship. A positive correlation means that as one variable increases, the other variable also tends to increase. A negative correlation signifies that as one variable increases, the other tends to decrease. Values close to -1 or +1 represent stronger relationships than values closer to zero.
As you would expect, higher scores are better though the delta between SSIMPLUS SVS and VMAF isn’t significant, particularly since I tested only two clips.
What was the disagreement that I had with SSIMWAVE? The company recommended testing using the preset for a 32″ 4K monitor rather than the 27″ 1080p monitor, under the logical assumption that most participants in the Subjectify study were probably video geeks with monitors much larger than 27″. SSIMWAVE also asserted that since the content was 1080p, display resolutions larger than 1080p wouldn’t change the scores.
I’m not conversant enough on how different graphics cards and monitors scale streaming video during playback to agree or disagree, and went with the 1080p preset for consistency with the other metrics. I did test using the recommended monitor preset and the Spearman score increased to 1.0, 1.0, and 0.98 for Football, Sintel, and the combined dataset respectively. Again, given that I only tested two files, it’s hard to draw any firm conclusions irrespective of the monitor preset used.
Conclusions
As I mentioned at the top, I didn’t test enough data in enough ways to call any metric the clear winner. AVQT performed very well for a new metric, though it clearly sees quality differently than SSIMPLUS and VMAF, particularly at the low end of the encoding ladder. Given that VMAF is used daily to find the Convex Hull in all Netflix clips and SSIMPLUS the same for SSIMWAVE clients, it’s hard not to give these metrics more credibility than a brand new metric.
In my experience, metrics don’t win your heart and mind via articles like this or even authoritative papers. Rather, you start to work with a metric and if the results track what your eyes see in the videos that you analyze, and what your customers see, you start to use it more and more.
That’s where I am with VMAF and SSIMPLUS; I’ve used them both enough times to analyze codecs, encoders, and encoding parameters, and verified their results via Subjectify and client work to feel comfortable using them.
It’s also worth noting that it’s tough to utilize a metric without a tool to simplify operation and perform ancillary functions like viewing frames, synchronizing videos, and the like. If the only way to compute VMAF was via Netflix’s command-line tool or FFmpeg, I wouldn’t use it nearly as much as I do. Paired with the Moscow State Video Quality Management Tool, VMAF becomes much more functional. Ditto for the SSIMPLUS and the SSIMWAVE VOD Monitor. As a purely command-line tool, VQMT doesn’t have that advantage.
So, I’ll close here and return one more time to discuss my overall feelings about VQMT, the tool and metric, compared to other available offerings.
I covered a lot of ground here and consolidated a lot of data pretty quickly which often doesn’t leave time for reflection. I’m also not a mathematician. If you spot any errors or have any observations that I didn’t make, please feel free to leave them as comments to this article, on any related social media posts, or send me an email at janozer@gmail.com.
Addendum
Well, if you made it this far, congrats. Here’s what happened after I posted this article. Apple sent a note that said.
“AVQT scores are aligned with MOS scale. To scale AVQT score to a 0-100 scale (like the one which VMAF uses), AVQT scores should be multiplied with a scale factor of 20. This is because a VMAF score of 20 maps to 1.0 in MOS scale. AVQT (0 to 100 VMAF scale) = AVQT (1 to 5 scale) x 20.0. Applying this normalization scheme will affect some of the conclusions made in the blog post, especially around the low AVQT scores.”
Since AVQT works on a scale from 1-5, this means a low score of 20. So, I responded, “If I multiply by 20 then your range is 20-100 so it doesn’t map to technologies that score 0-100. To make your “bad” map to SSIMPLUS and VMAF “bad” you have to be at zero. Thoughts?”
And heard back, “According to Netflix a VMAF of 20 maps to “bad” which is MOS of 1.0. From the article: Viewers voted the video quality on the scale of “bad”, “poor”, “fair”, “good” and “excellent”, and roughly speaking, “bad” is mapped to the VMAF scale 20 and “excellent” to 100. So VMAF scores below 20 map to MOS values below 1.0 which do not exist. This is why AVQT does not cover this range.”
True enough, but VMAF scores of below 20 do exist; why would you build a metric that ignores them? I guess you could also ask why Netflix built a metric with 20 points below the lowest quality perceived in subjective trials.
Here’s how each metric defined “bad” (copied from above):
- AVQT – “AVQT scores align with the MOS (Mean Opinion Score) scale. The score is a floating-point number between 1 and 5, where 1 is BAD, 2 is POOR, 3 is FAIR, 4 is GOOD and 5 is EXCELLENT quality.
- VMAF – “VMAF scores range from 0 to 100, with 0 indicating the lowest quality, and 100 the highest…[T]he default model v0.6.1 is trained using scores collected by the Absolute Category Rating (ACR) methodology using a 1080p display with a viewing distance of 3H. Viewers voted the video quality on the scale of “bad”, “poor”, “fair”, “good” and “excellent”, and roughly speaking, “bad” is mapped to the VMAF scale 20 and “excellent” to 100.”
- SSIMPLUS – “SSIMPLUS provides straightforward predictions on what an average human viewer would say about the quality of the video being viewed on a scale of 0-100, which is evenly divided to five quality ranges of bad (0-19), poor (20-39), fair (40-59), good (60-79), and excellent (80-100), respectively.”
So, SSIMPLIS defines bad as 0 while VMAF and AVQT define it at 20. How to correctly display all three on the same chart? If I was mapping AVQT to SSIMPLUS SVS, I would use the formula shown above to map the four-point scale to 100. But that misrepresents VMAF.
Alternatively, I could map SSIMPLUS to VMAF and AVQT by converting the 100 point spread to 80 points and adding 20 to the score to set the base.
(SSIMPLUS SVS X .8) + 20
This converts a zero score to 20 while keeping a 100 score at 100. While not a huge difference, cutting the effective range of the metric from 100 to 80 reduces granularity, which is one of the advantages VMAF and SSIMPLUS have over PSNR, SSIM, and MOS scoring. Cutting out scores below 20 also cuts out real VMAF scores under that level.
Still, this doesn’t normalize the “bad” rating at the same level, so let’s have a look.
1080p Quality from 5000 kbps to 300 kbps
Not a significant difference here; SSIMPLUS SVS is a bit higher than before but AVQT shows a completely different pattern than SSIMPLUS SVS and VMAF.
Ditto in this animated clip.
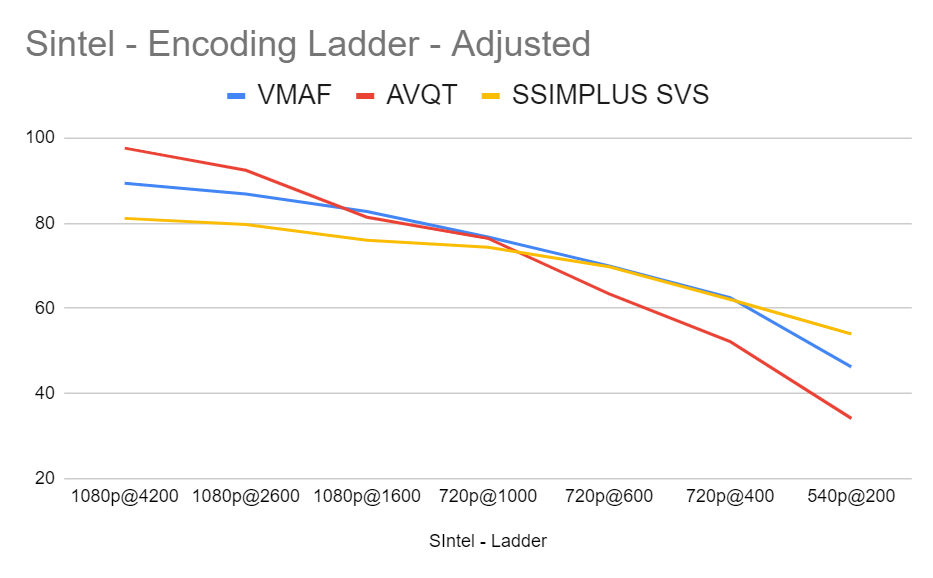
Gauging the Quality of an x264-Encoding Ladder
Again, SSIMPLUS SVS and VMAF remain more closely aligned with AVQT showing a very different pattern.
In the Sintel clip, the new mapping align SSIMPLUS SVS and VMAF very closely with AVQT showing a completely different pattern.
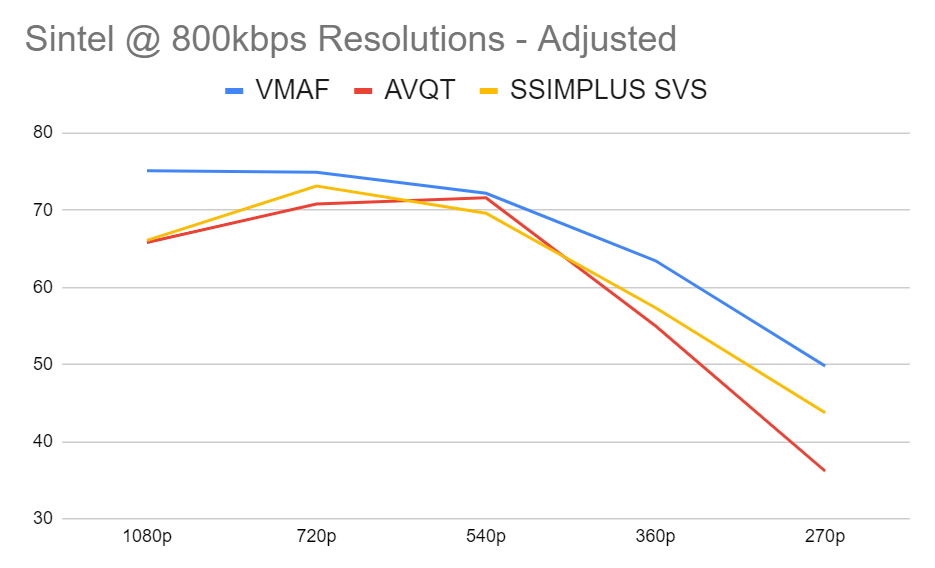
800 kbps Outputs at 270p, 360p, 540p, 720p, and 1080p
The adjusted mapping increased AVQT and SSIMPLUS SVS scores into a similar quality range with VMAF. Apple’s technology still showed the largest difference between the lowest and the highest scores.
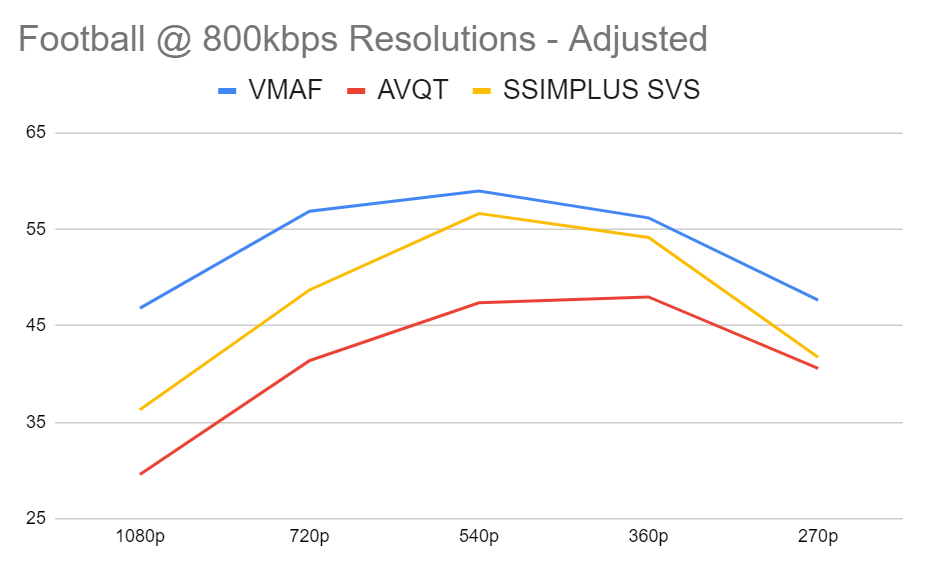
The Spearman’s scores didn’t change because none of these adjustments affected the rankings of the various resolutions for any of the metrics.
Adjusting the scores as described brought the overall quality levels reported by the three metrics into closer alignment. Still, even after the adjustments, it’s apparent that AVQT sees quality differently than SSIMPLUS SVS and VMAF. It is not a faster VMAF or cheaper SSIMPLUS SVS.