Streaming Learning Center Where Streaming Professionals Learn to Excel


Related Articles

Here’s the question on the table. x264’s veryslow preset delivers better quality than the medium preset but takes roughly 4x longer to encode, boosting your encoding costs by a healthy 4x (2-3x if using a cloud encoder). Which is the right preset for you, medium or veryslow? Like everything else in streaming, it depends.
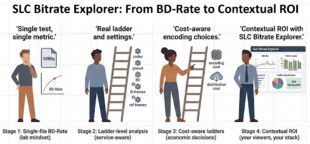
By way of background, in a 2023 article titled “The Correct Way to Choose an x264 Preset,” I argued that you don’t choose an x264 preset to set quality; you choose it to control cost. In this regard, once a title reaches about 1,000 views, the higher-quality preset almost always wins.
The article was correct as far as it went. But it didn’t incorporate two streaming realities. First, it only looked at a single rung, where most services stream full-encoding ladders. Second, it didn’t account for the proportion of each rung actually delivered to its users. That is, if you deliver the top rung of your video files to, say, 95% of your viewers, you get a different result than if you deliver the middle and bottom rungs to mobile viewers.
The bottom line? You can only assess the true value of a slower preset (or any encoding parameter or codec that increases quality while also increasing encoding cost) by testing the ladder rungs you actually ship in the proportions your viewers actually retrieve and play them.
Contents
You can’t make this call on a single file
Let’s take a step back. When I first built the SLC Bitrate Explorer (SBE), it was a single-file tool. That’s fine for analyzing a single encode, but you can’t make a strategic decision like this based on a single clip. The optimal preset depends on how your entire catalog behaves across many titles. So the latest version adds a portfolio feature that lets you combine multiple files into a single analysis. It’s a free upgrade, and I describe the workflow in a separate article I’ll write later.
Using the new version to analyze the medium vs very slow preset decision, I built a 19-file portfolio. I produced two full ladders for each preset, each with a top-rung target of 95 VMAF. So, both presets start at the same quality level, but at different bitrates, with the ladders stepping down normally from there.
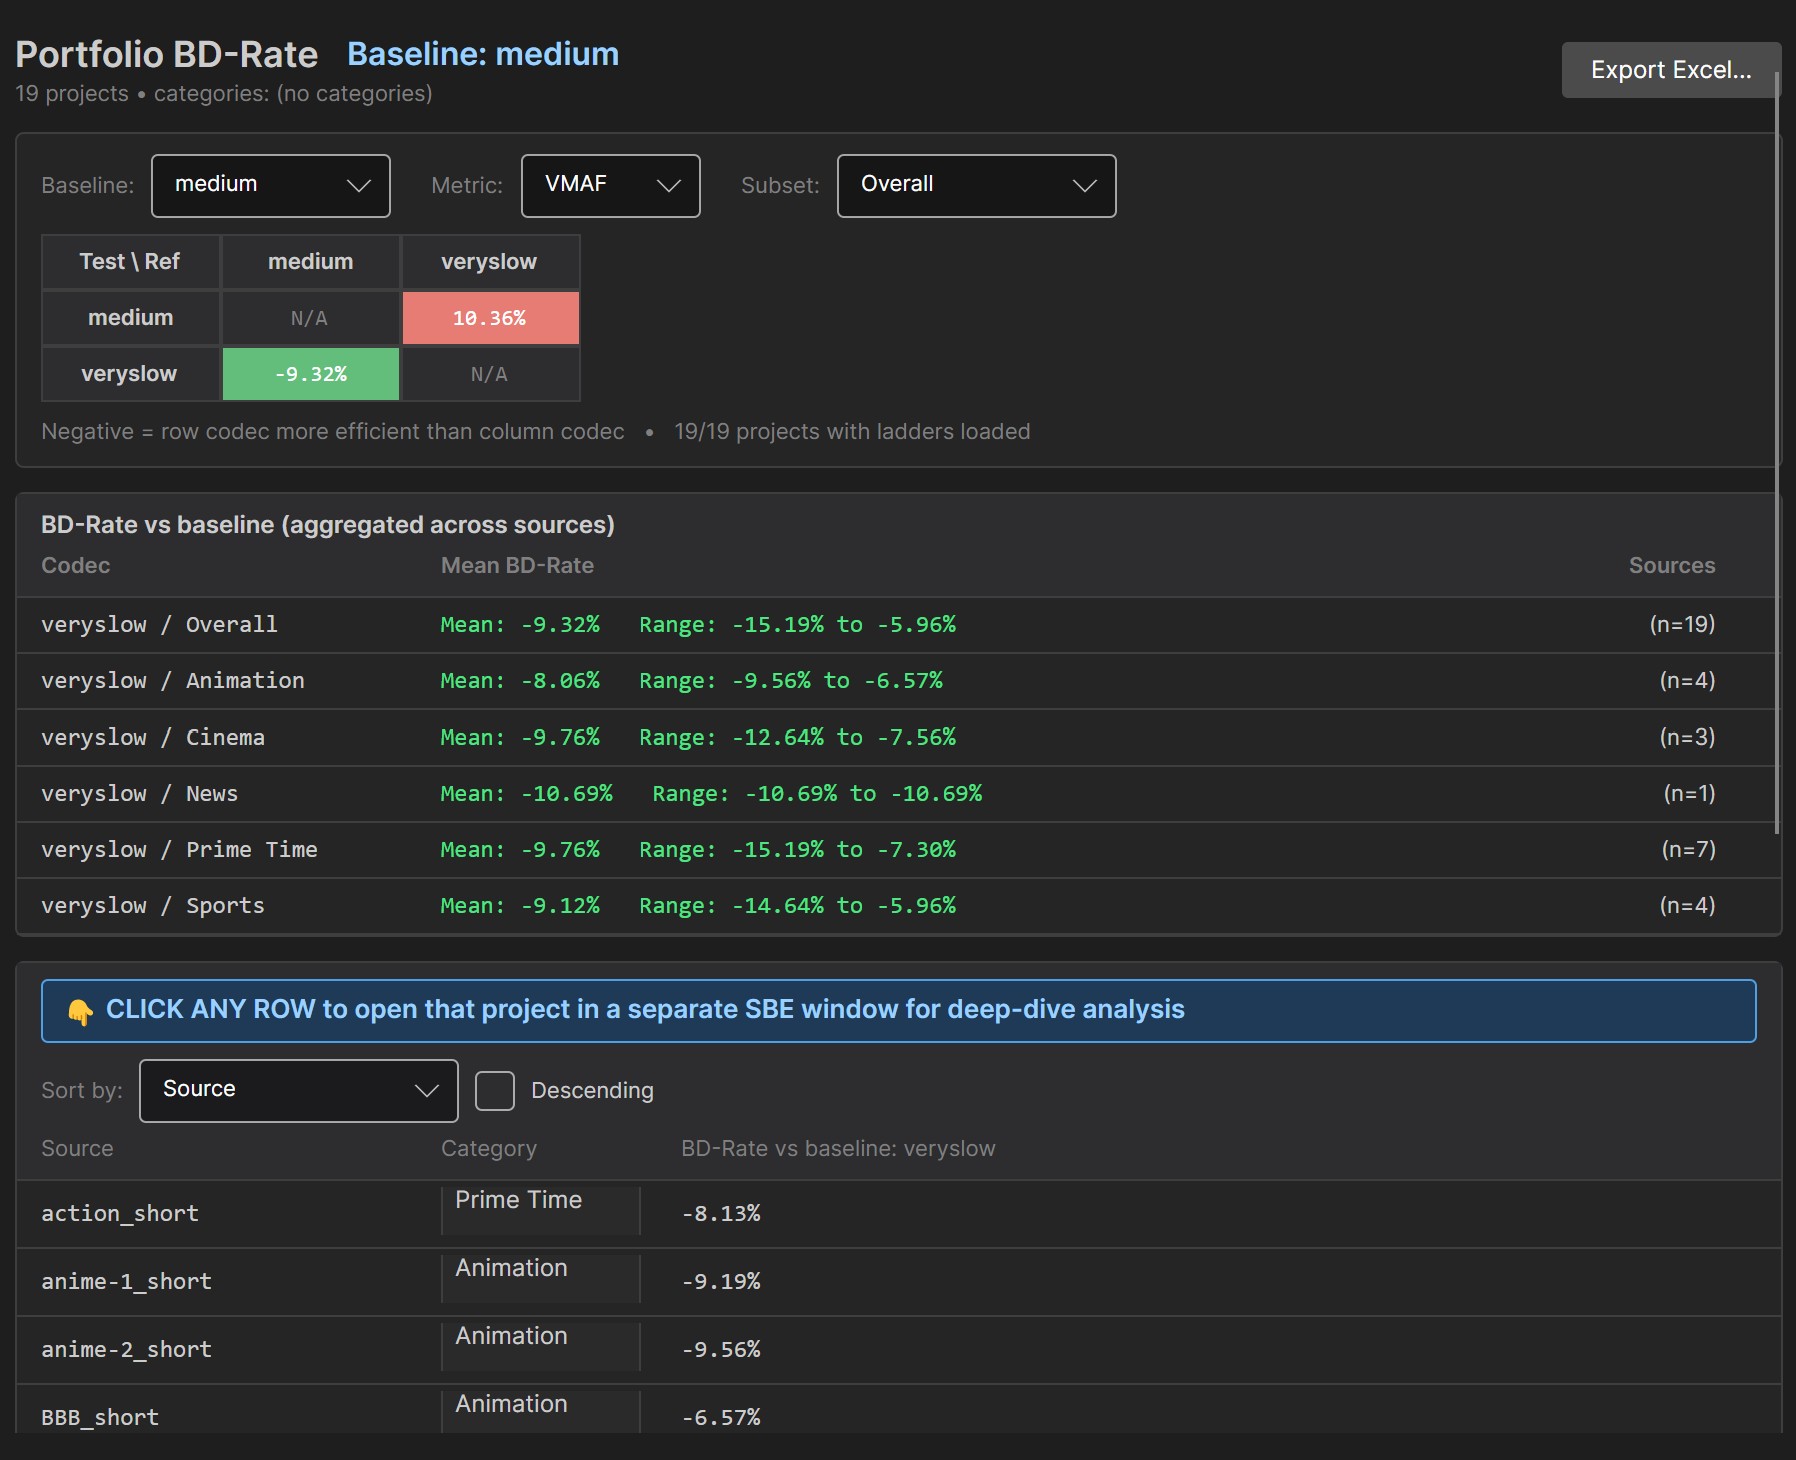
Figure 1. The new portfolio feature lets you consolidate the results from multiple files and categorize them. Click to view any figure at full resolution.
What a slower preset actually buys you
Let’s explore the different bitrates statement for a moment. As I mentioned above, many producers consider the preset decision quality-related. But it’s not. As you know, you can hit 95 VMAF using either the medium or veryslow presets. Veryslow just gets there at a lower bitrate, but bumps your encoding costs by 4x. If you stay with medium, you can achieve the same quality level; you’ve just got to boost the bitrate to get there.
So the preset isn’t really a quality decision. It’s a bitrate decision, which makes it a cost decision: how many bits do I have to spend to hit my target quality? That’s exactly what BD-Rate answers, so that’s where most people start.
What BD-Rate Actually Measures
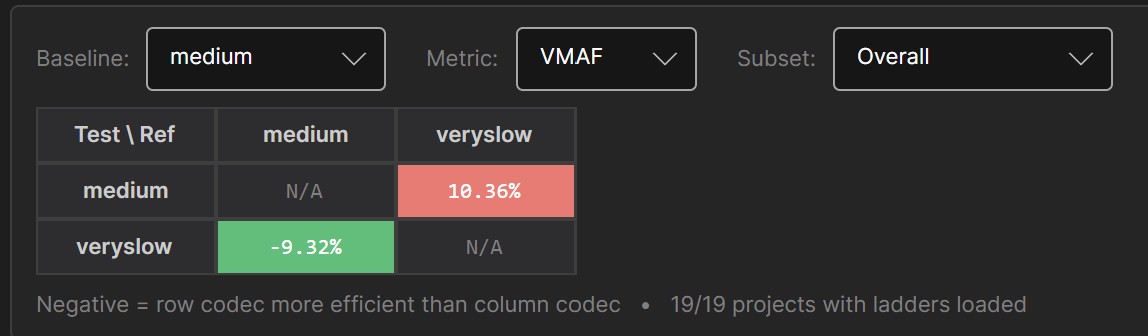
Run a BD-Rate analysis, and the answer looks great. Across the 19 files, veryslow is 9.3% more efficient than medium, ranging from 5.96% to 15.19% depending on the title.
Does this mean that changing to veryslow from medium will reduce your bandwidth costs by 9.32%? Unfortunately, no.
To explain, BD-Rate is a synthetic metric that measures the bitrate difference at a matched quality across the entire rate-quality curve. So, 9.3% is what you’d save if your viewers were evenly distributed across every point on that curve. The problem is, you don’t deliver artificial rungs; you deliver real rungs with real bitrates and real quality levels to different viewers.
We’ll explore this issue further below after a fuller discussion of the facts. For now, What is the most accurate predictor? Measuring the bandwidth and quality deltas using the actual distribution patterns experienced by your users. That’s why, in addition to classic BD-Rate computations, SBE allows you to enter your distribution patterns to measure the quality and bandwidth deltas your encoding alternatives deliver.
Viewer Bandwidth Distribution Settings
SBE ships with multiple preset audience profiles like the three shown in Figure 3, IPTV, Top Heavy, and Mobile. These were inspired by the article “Optimizing Mass-Scale Multi-Screen Video Delivery” by Yuriy Reznik and his colleagues at Brightcove.
In the article, the researchers explained how to produce ladders that optimized performance for different distribution profiles. Inherent to this concept is that ladders perform differently based on their distribution profiles. SBE doesn’t create customized ladders; it measures the performance of alternative ladders based upon the distribution profile experienced by that service.
If you scan through the options in Figure 3, you’ll see the ladder rungs and distributions on the right. You can use these or create your own based on your own service.
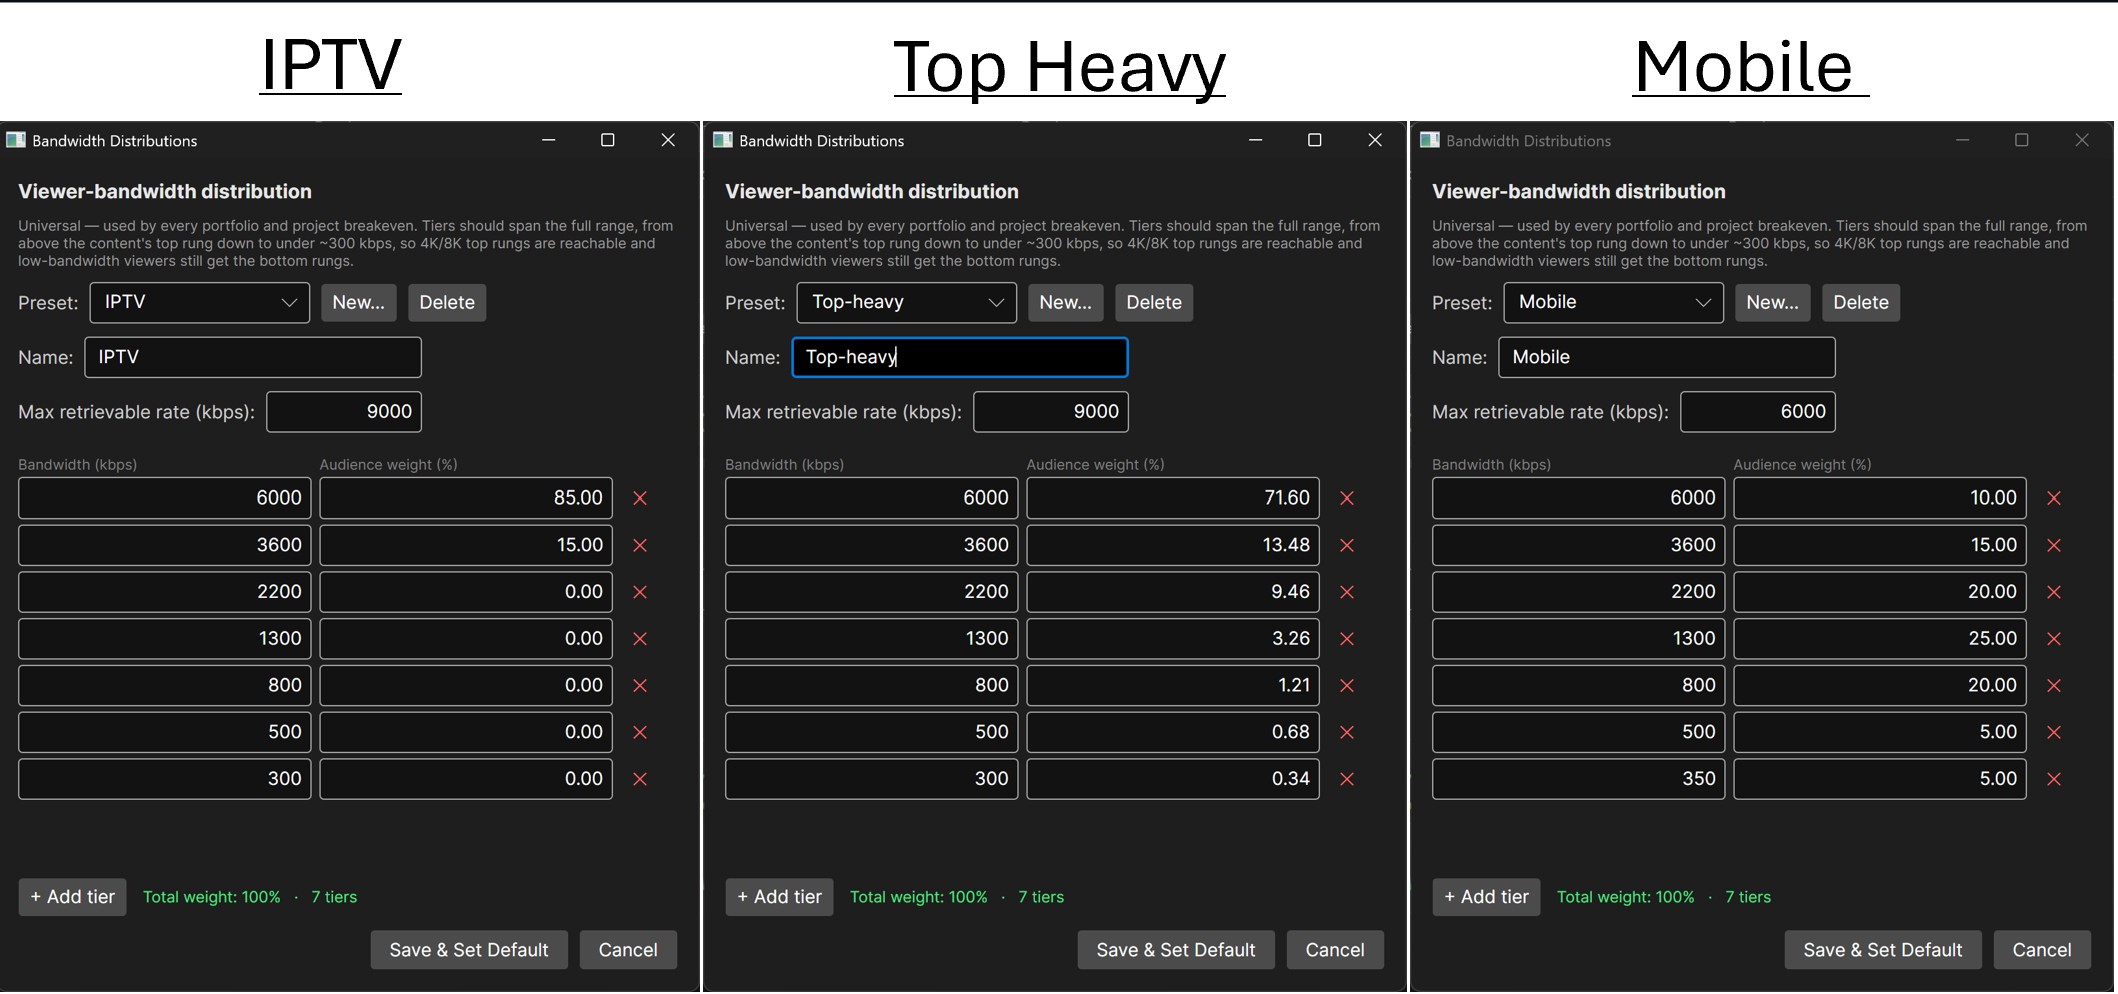
Figure 4 shows multiple results using the three distribution profiles, along with the assumptions underlying their production. The customizable assumptions include:
- Cost per GB for distribution ($0.02)
- Encoding cost per hour ($0.50). You can also directly insert the cost per minute if you’re using a cloud encoder
- Encode time vs baseline (in the veryslow column). Veryslow takes about 4x longer to encode than medium, resulting in a higher encoding cost that must be offset by bandwidth savings.
- Projected viewing hours (to estimate lifetime savings)
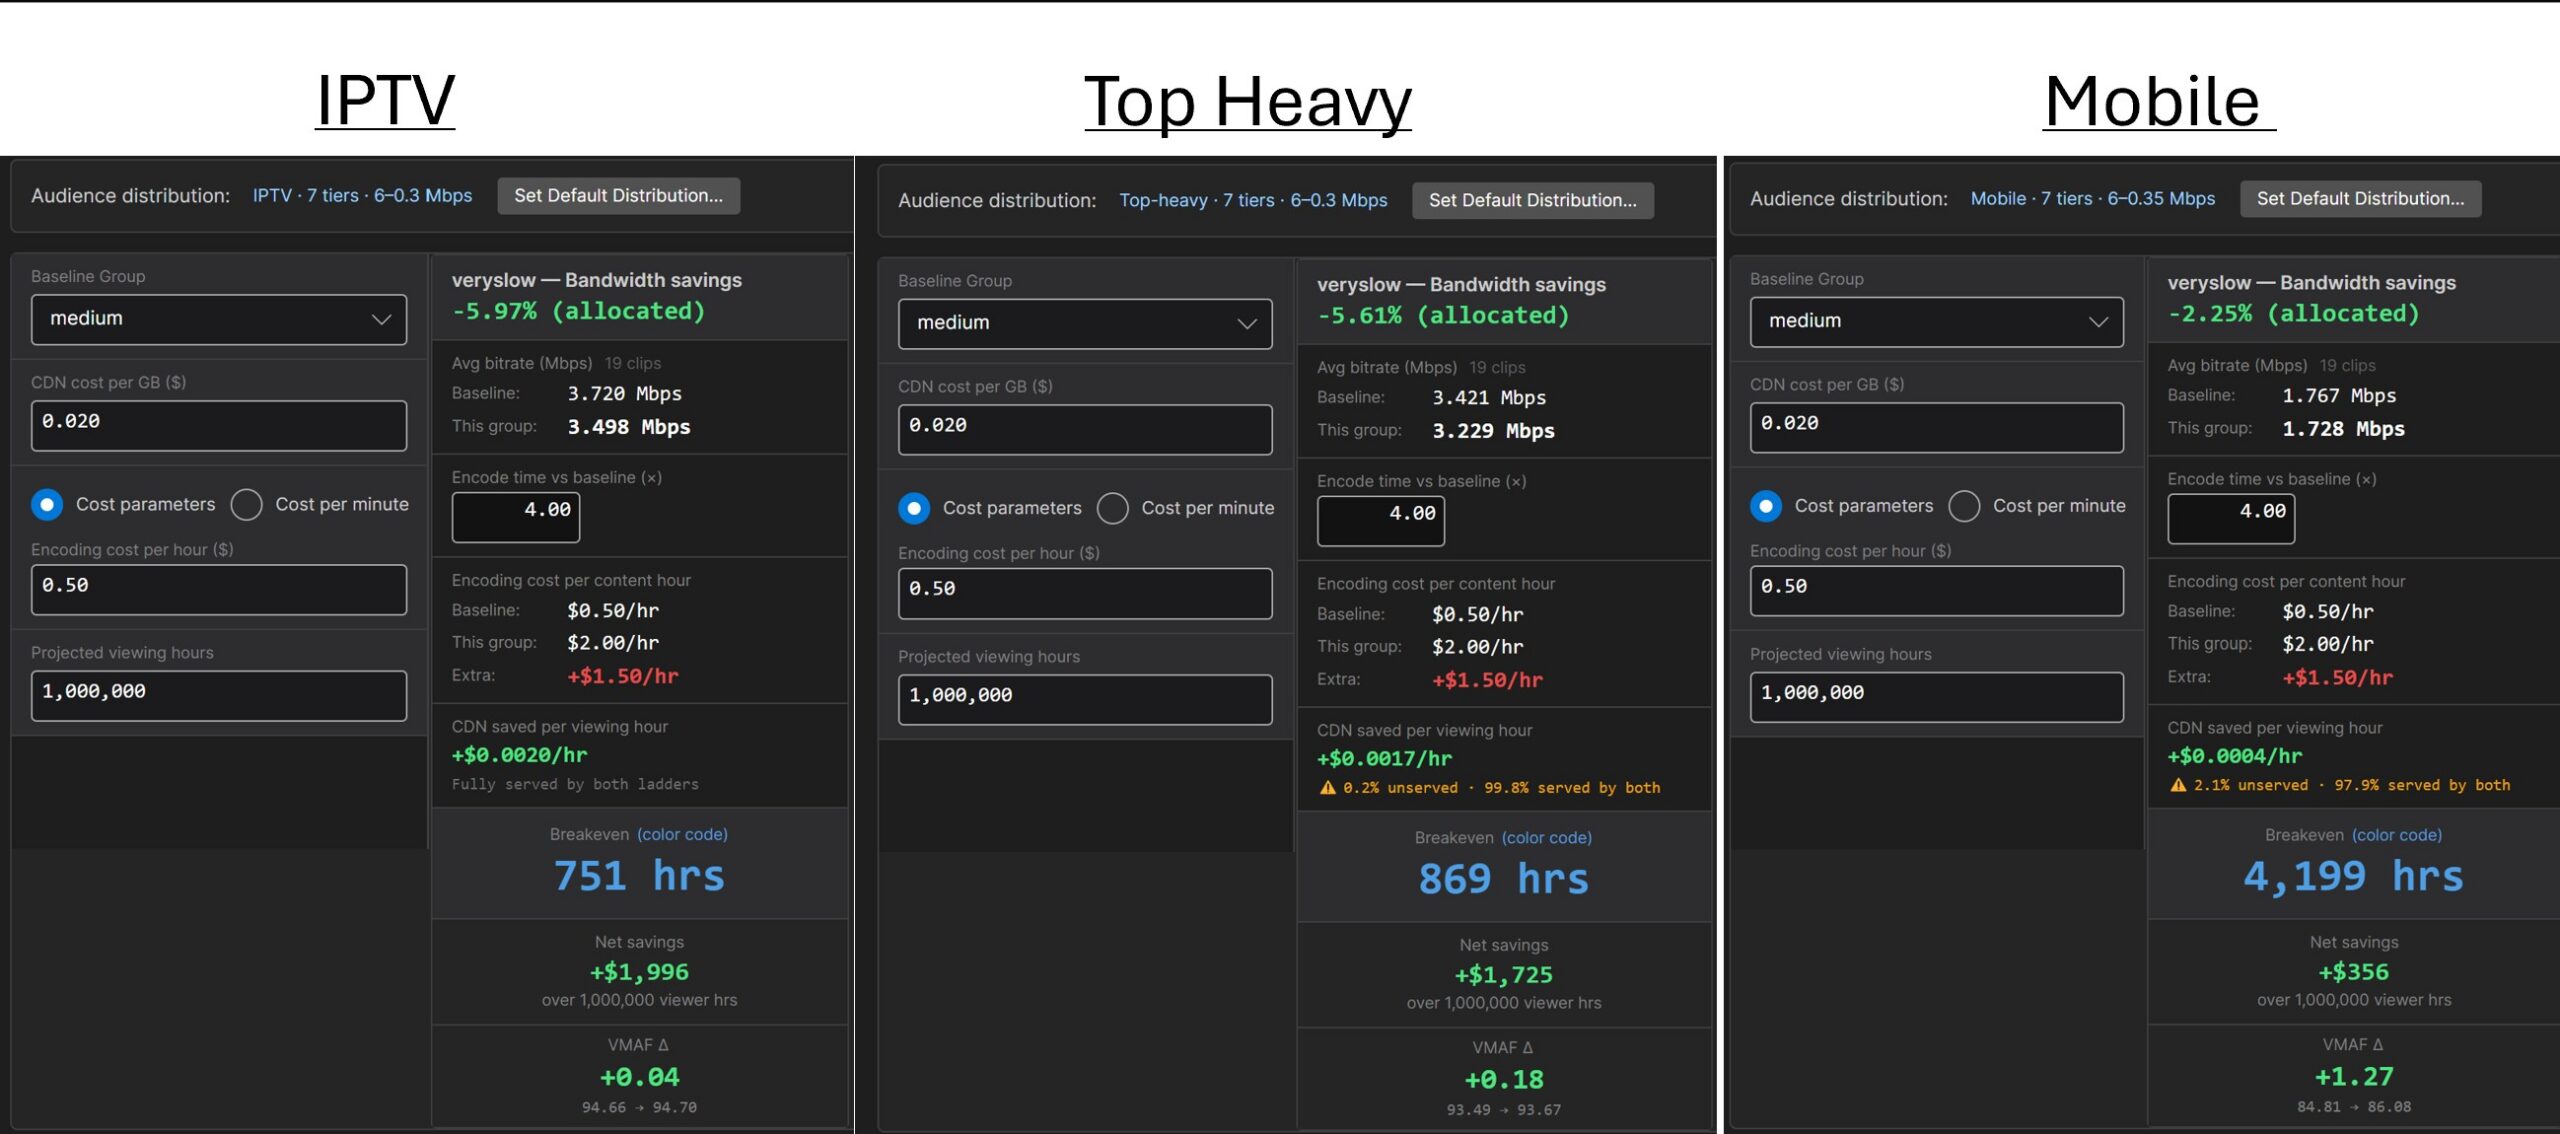
All results compare the veryslow encode to the baseline medium encode. The results include:
- Actual bandwidth savings
- Breakeven in hours (how many hours of viewing is needed before the lower bitrate offsets the increased encoding cost)
- VMAF difference – the difference in quality produced by veryslow (can also show SSIM and PSNR)
How veryslow and medium compare
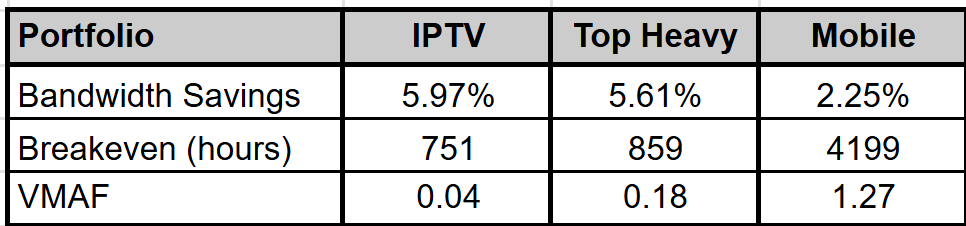
Table 1 summarizes the benefits of veryslow over medium, and as you can see, it varies significantly by distribution profile.
For the IPTV distribution profile, the bandwidth savings are the highest, and the breakeven is the shortest. The VMAF delta is nominal because both presets targeted a VMAF of 93.
The top-heavy distribution, which is likely the most representative, is very similar. Mostly top rungs delivered means the large bandwidth savings and minimal VMAF uplifts.
With mobile, you see the reverse. Bandwidth savings drop by over 60% compared to the IPTV numbers, while VMAF quality improves by 1.27 points.
FYI – SBE exports Excel summaries from most tabs. In portfolio mode, there are two exports.
BD-Rate – includes BD-Rate and RD-Curves for all files, genres, and overall in VMAF, SSIM, and PSNR metrics. You can download a sample BD-Rate Excel file here: Medium_VslowPortfolio_BD-Rate_Export
Breakeven – includes Breakeven data for each file and overall using the selected audience distribution. You can download a sample Breakeven Excel file here: Medium_VslowPortfolio_breakeven
Why BD-Rate Misrepresents
Why don’t these numbers come close to those predicted by BD-Rate? Let’s start by exploring what BD-Rate actually represents. Specifically, it measures the average bitrate difference between two encodes at the same quality level over the common quality range.
That’s great in theory, but look at the rate-quality curves built from the two ladders, and almost no real rung pair actually sits at the same quality. Every rung delivers some mix of a little less bitrate and a little more quality. BD-Rate counts the bitrate part and ignores the quality part. So it’s measuring something real, but only half of what veryslow buys you.
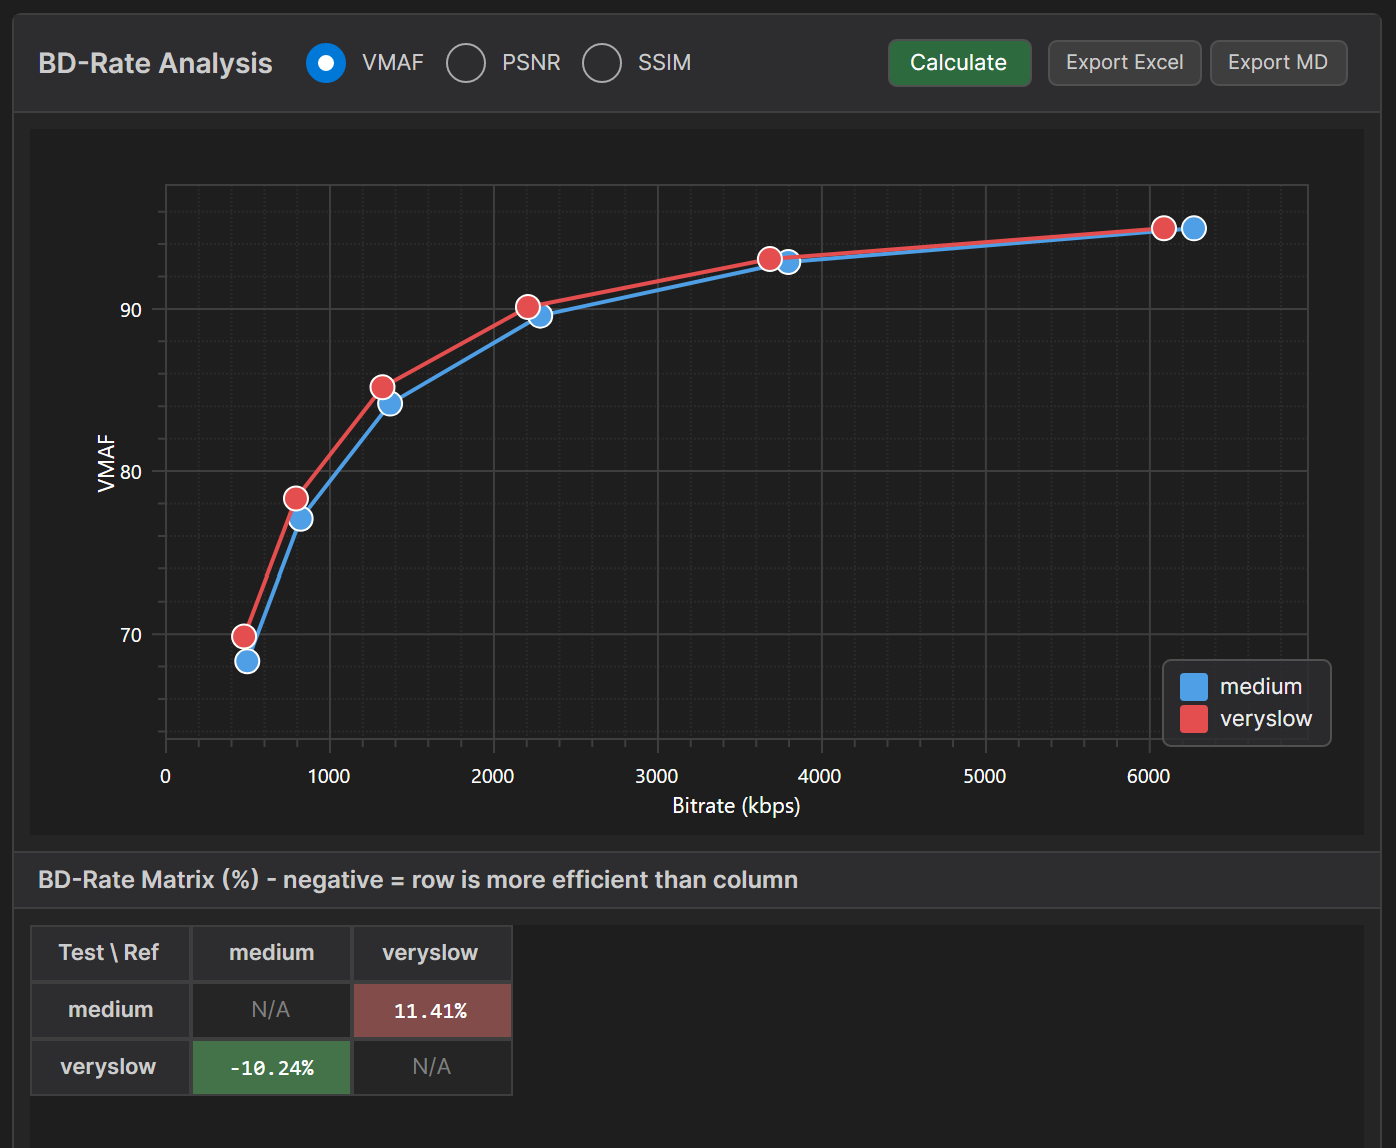
Second, veryslow’s advantage doesn’t deliver the same benefits everywhere on the ladder. Figure 5 shows why. Near the top, both presets reach the same quality, but veryslow gets there at a lower bitrate. That’s the ball sitting just left of the blue one, and that gap is a real bandwidth saving.
Lower down, the curves separate vertically instead. As a result, for the same rung, veryslow delivers zero bitrate savings but improved quality. In general, with mobile-centric patterns dominated by middle- and lower-rung consumption, higher-quality codecs and encoding parameters deliver improved quality but minimal bandwidth savings.
So the advantage of improved efficiency is bandwidth at the top and quality at the bottom. Your audience profile determines which one you get.
BD-Rate doesn’t measure real savings
Finally, bitrate savings and BD-Rate are two completely different numbers. When you summarize BD-Rate findings, you perform a simple average of the BD-Rates of all tested files. Actual bitrates don’t matter.
When computing overall bitrate savings, you compute the actual bytes the baseline ships and the actual bytes the test ships, and add up the difference. That’s the only honest way to project what you’ll save. Using this method, a high-bitrate title carries far more weight than a small one because it consumes more bandwidth.
This is what you see in Table 2. If you average the BD-Rates, you get a healthy 8.77 combined. If you compute using the actual bitrate differences, the benefit drops to 4.78. Sure, it’s only about a 4-point difference, but those four points are a 45% miss.
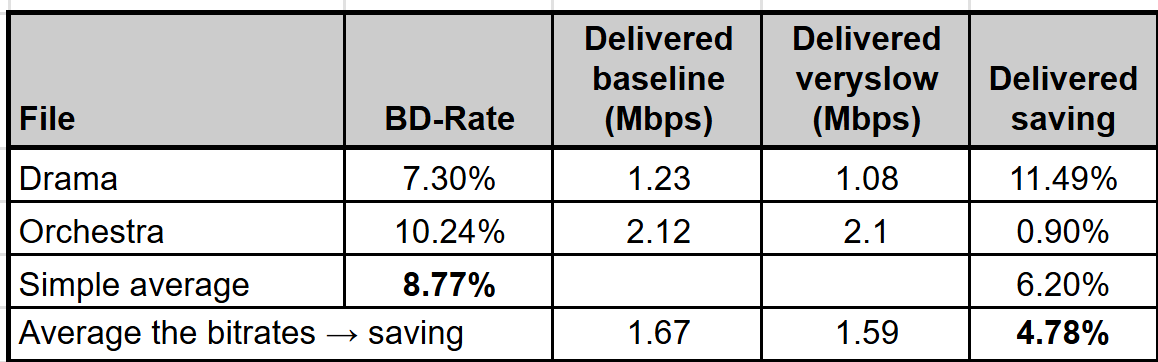
So which number should you share with your boss? Obviously, the one that corresponds most closely to how the change will actually impact your bandwidth bill and average video quality. Actual grounded estimates, not BD-Rate.
What this means
So, back to the original question: which preset is right for you?
Streaming publishers
Run the numbers and consider the breakeven point for the higher-quality level. If most videos are consumed at far higher rates than that number, use the higher-quality preset. If some do and some don’t, consider encoding high-volume and long-tail videos at a higher quality setting, while using lower quality for videos unlikely to hit the breakeven numbers.
Note that this mimics YouTube’s strategy of encoding all videos in H.264 and VP9, while reserving the higher-quality (and more expensive to encode) AV1 for more popular videos. This ensures that its investment in encoding will be recouped through bitrate savings.
Internal and enterprise video
If you’re not paying to distribute your video, there are no bandwidth savings to offset the increased encoding costs. If you’re using a cloud service, I would opt for the cheapest encoding level and adjust the bitrate to achieve quality targets.
If encoding in-house, I would use the highest-quality setting my current system supports. If you have one machine in the corner encoding 5% of the time, use veryslow. If you’re close to needing to buy another computer, I’d switch to medium and adjust the bitrate.
About SLC Bitrate Explorer (SBE)
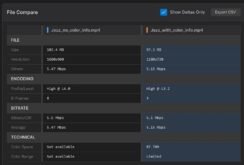
SLC Bitrate Explorer (SBE) is the tool behind every number in this article. Load any H.264, HEVC, VP9, or AV1 file and see its codec parameters, bitrate, frame structure, and quality metrics in one place. The portfolio feature analyzes your whole catalog at once, and the audience-distribution model shows the bandwidth and quality your viewers actually receive, not the BD-Rate average. Windows and Mac.
Trial: Full access free for 14 days, then a free tier (File Intelligence, File Compare, Bitrate Chart, and still-image Frame Viewer). Pro is $109.99.