 Streaming Learning Center Where Streaming Professionals Learn to Excel

Related Articles


I spent 30 years assessing and interpreting codec quality. Here’s the tool I built to do it.
Contents
The Toolchain You’re Stuck With
You know the stack. MediaInfo for file information. Bitrate Viewer for data rate profiles. MSU VQMT for metrics and frame viewing. Excel for BD-Rate and RD curves. Another spreadsheet to estimate the financial implications of your encoding decisions. And nothing built to assess real-time playback quality or to package your findings into something you can put in front of management.
Some of these tools run on Windows but not Mac. Some the reverse. None of them talk to each other, which adds hours of file shuffling, format converting, and re-typing every time you do an analysis. None of them produces the report you actually need to defend your decision to colleagues, leadership, or other departments.
Encoding quality is the cornerstone of streaming Quality of Experience. It’s time you had a tool built around the way you actually do this work.
About SLC Bitrate Explorer
SLC Bitrate Explorer gives encoding engineers and QA teams a complete picture of their video files in one place. Load any file encoded with H.264, HEVC, VP9, or AV1 and instantly see codec parameters, bitrate behavior, frame structure, and quality metrics. Available for Windows and Mac.
Trial: Full access is free for 14 days. After that, a free tier includes File Intelligence, File Compare, Bitrate Chart, and Frame Viewer (still image only, no video playback). Pro is $109.99.
Feature List:
File Intelligence Tab
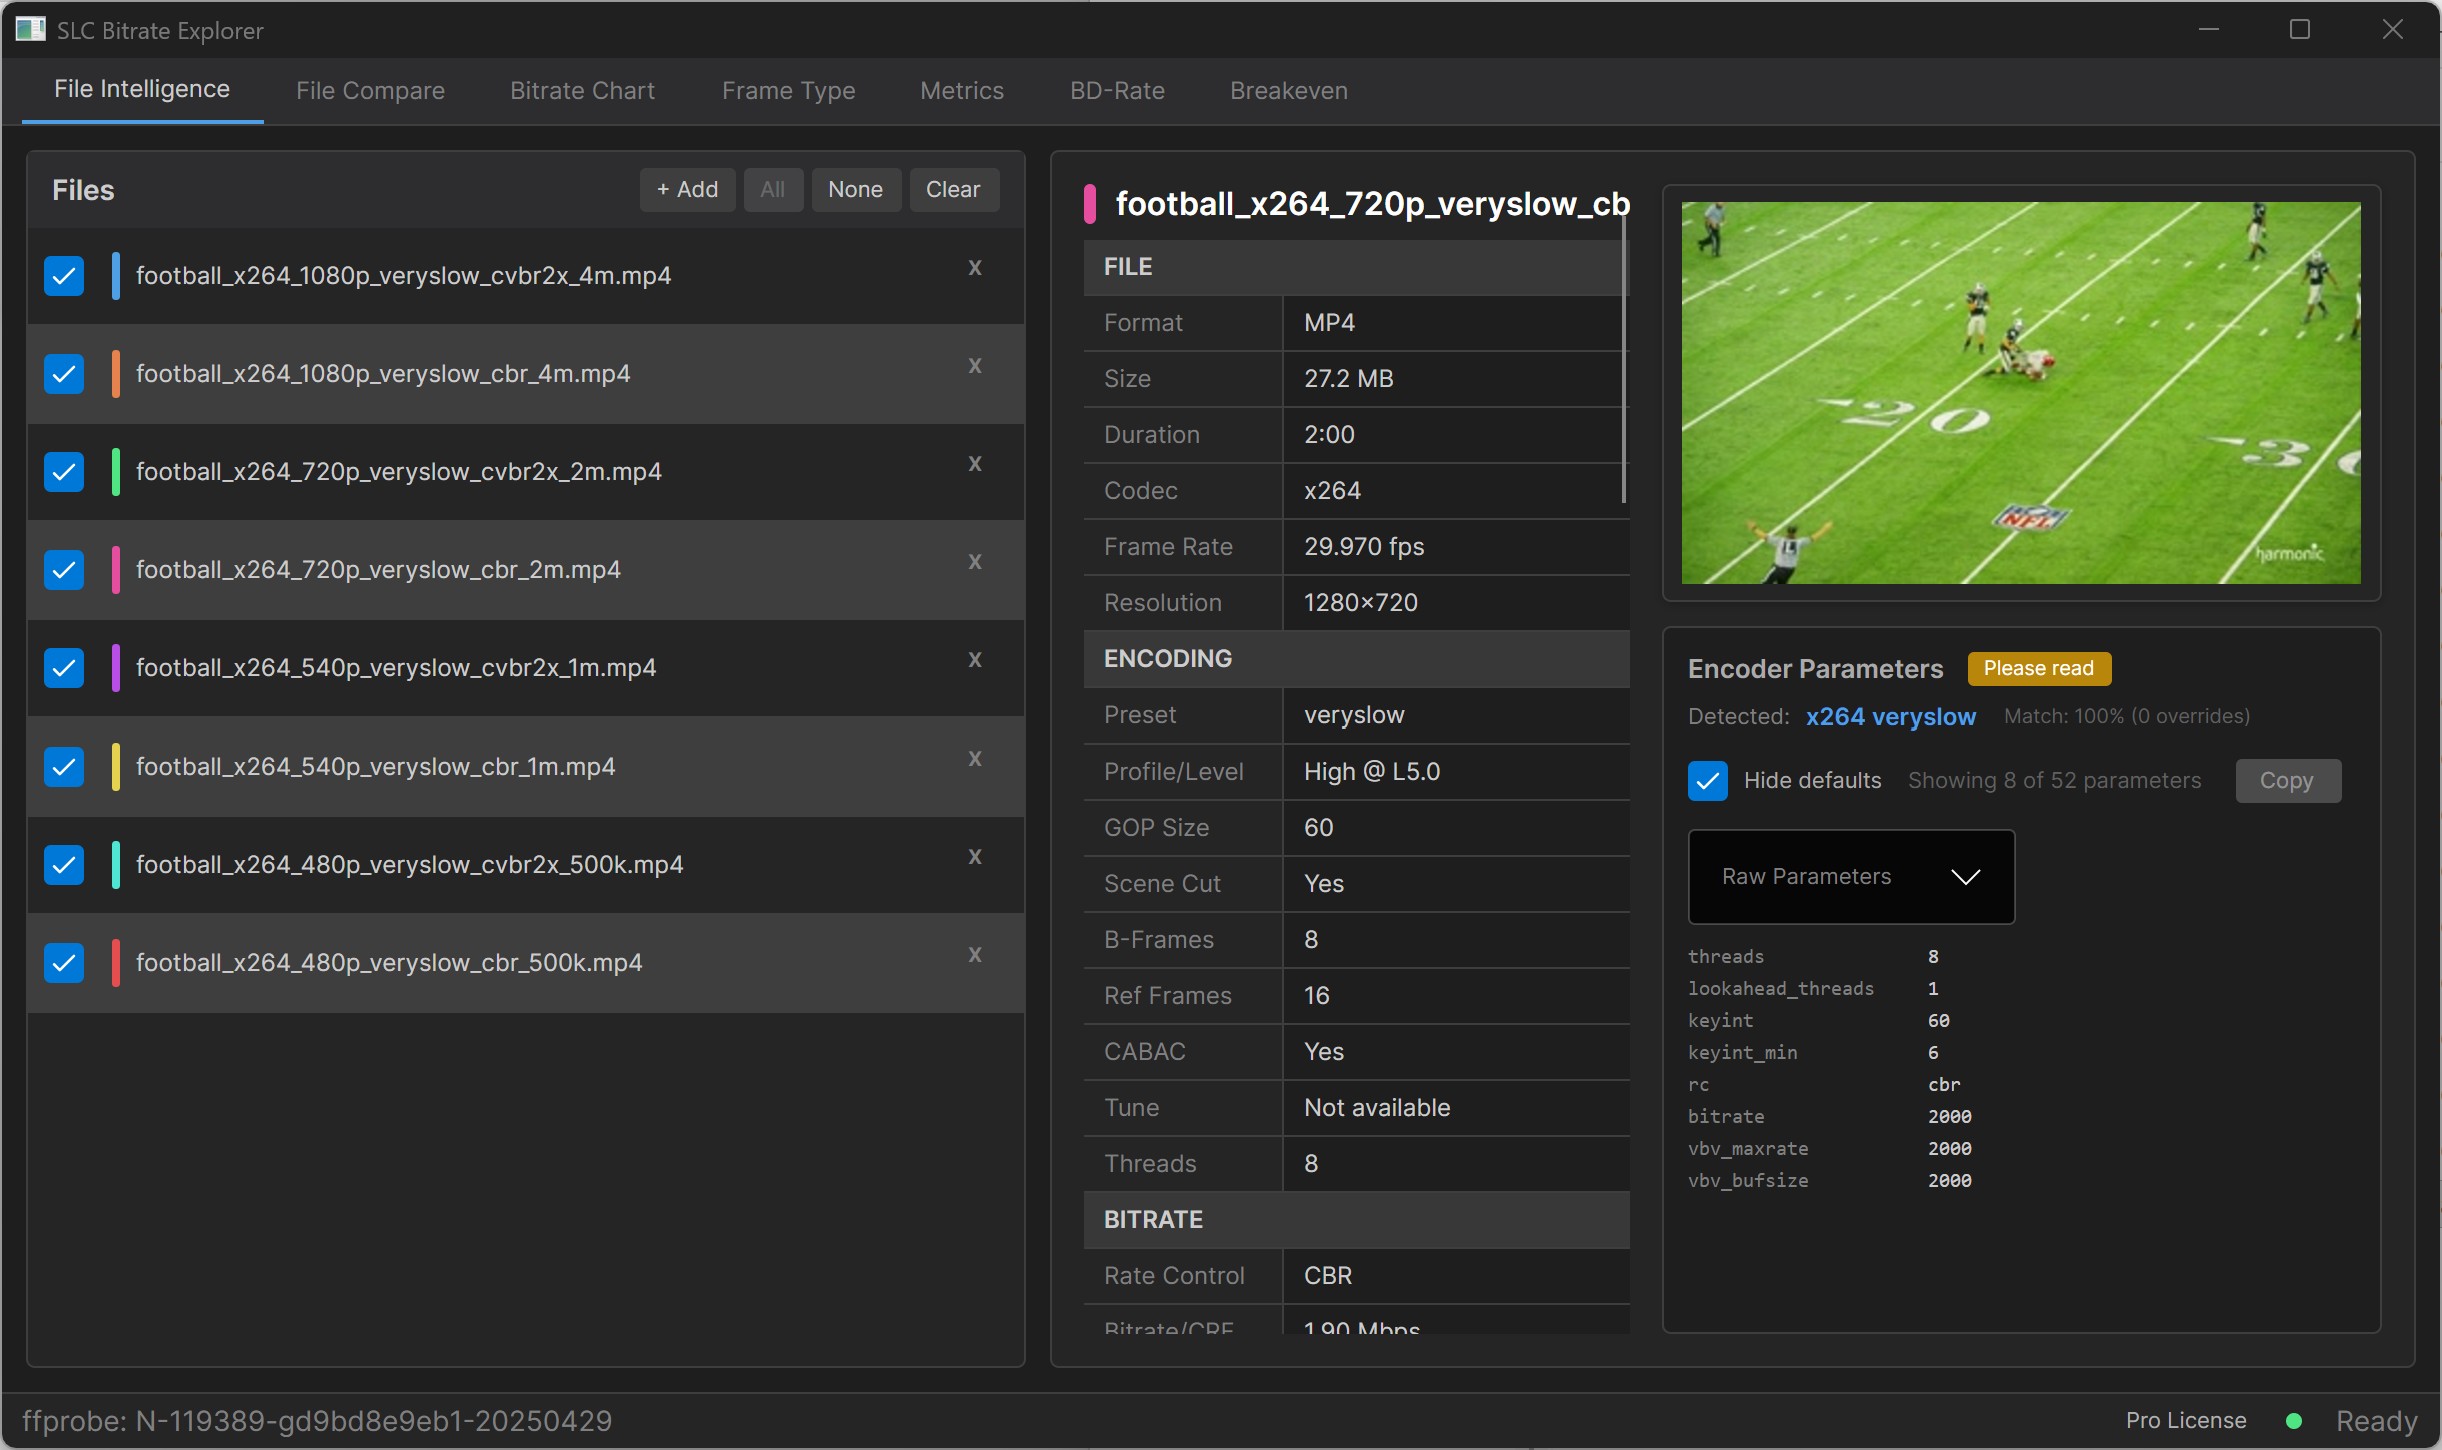
MediaInfo has been the standard for decades. Free, ubiquitous, accurate. But the output is dense text formatted for technicians, you can’t compare files side by side without copy-pasting into a spreadsheet, and there’s no path from inspection to a shareable report.
SLC Bitrate Explorer’s File Intelligence tab pulls every parameter ffprobe can read: codec, profile, level, resolution, frame rate, color space, bit depth, GOP structure, and audio tracks. For x264 and x265 files encoded with FFmpeg, it goes further, identifying exactly what the encoder did and showing only the parameters that differ from defaults.
Checking deliverables before they ship, onboarding files from a new vendor, or auditing an old archive becomes a five-minute job instead of an hour. And the output goes into a report you can hand off without having to rewrite.
File Compare Tab
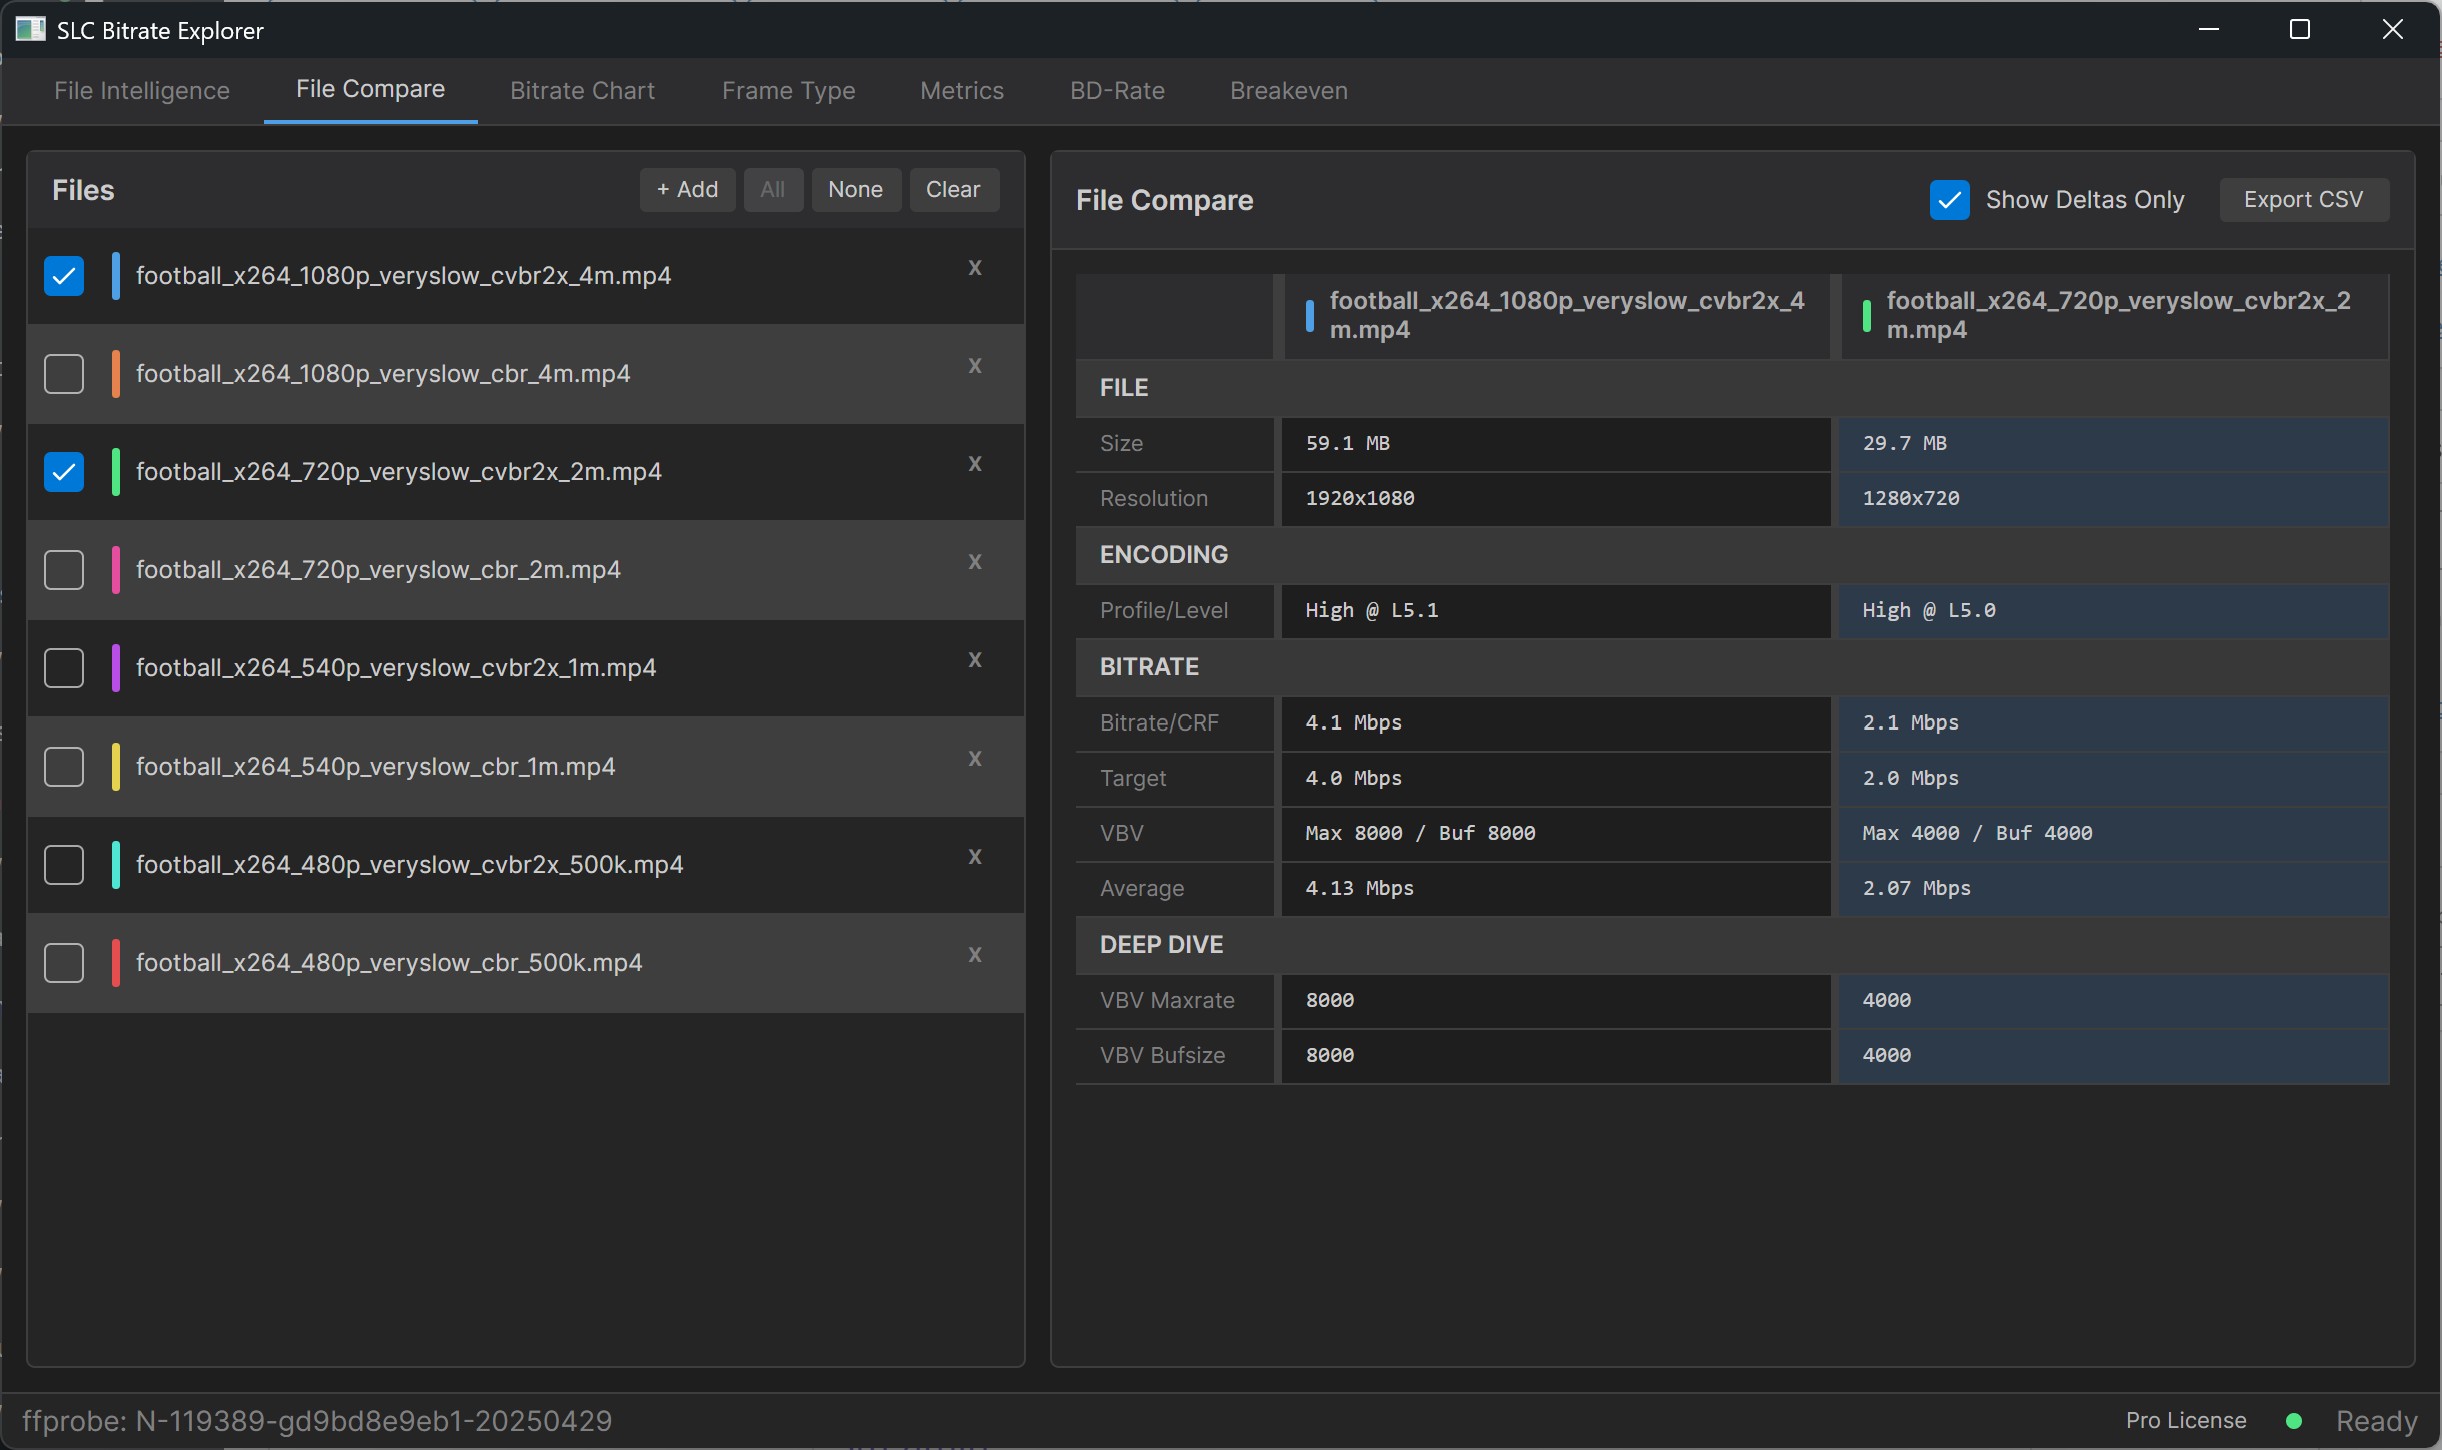
Comparing two encodes of the same source today means opening MediaInfo twice, eyeballing differences, and dropping into ffprobe when something doesn’t add up. There’s no purpose-built tool that says “here’s what changed between these two files.”
File Compare puts files side by side in a single view. Check Show Deltas Only and every parameter that matches disappears, leaving only what actually changed. Drag in up to eight files. Export the comparison to CSV.
This is the QA tool that catches the wrong profile from a vendor, the dropped HDR metadata, the ladder rung that diverged from the rest. The diff is the answer, and the diff is automatic.
Here’s a video that explores this feature.
Bitrate Chart
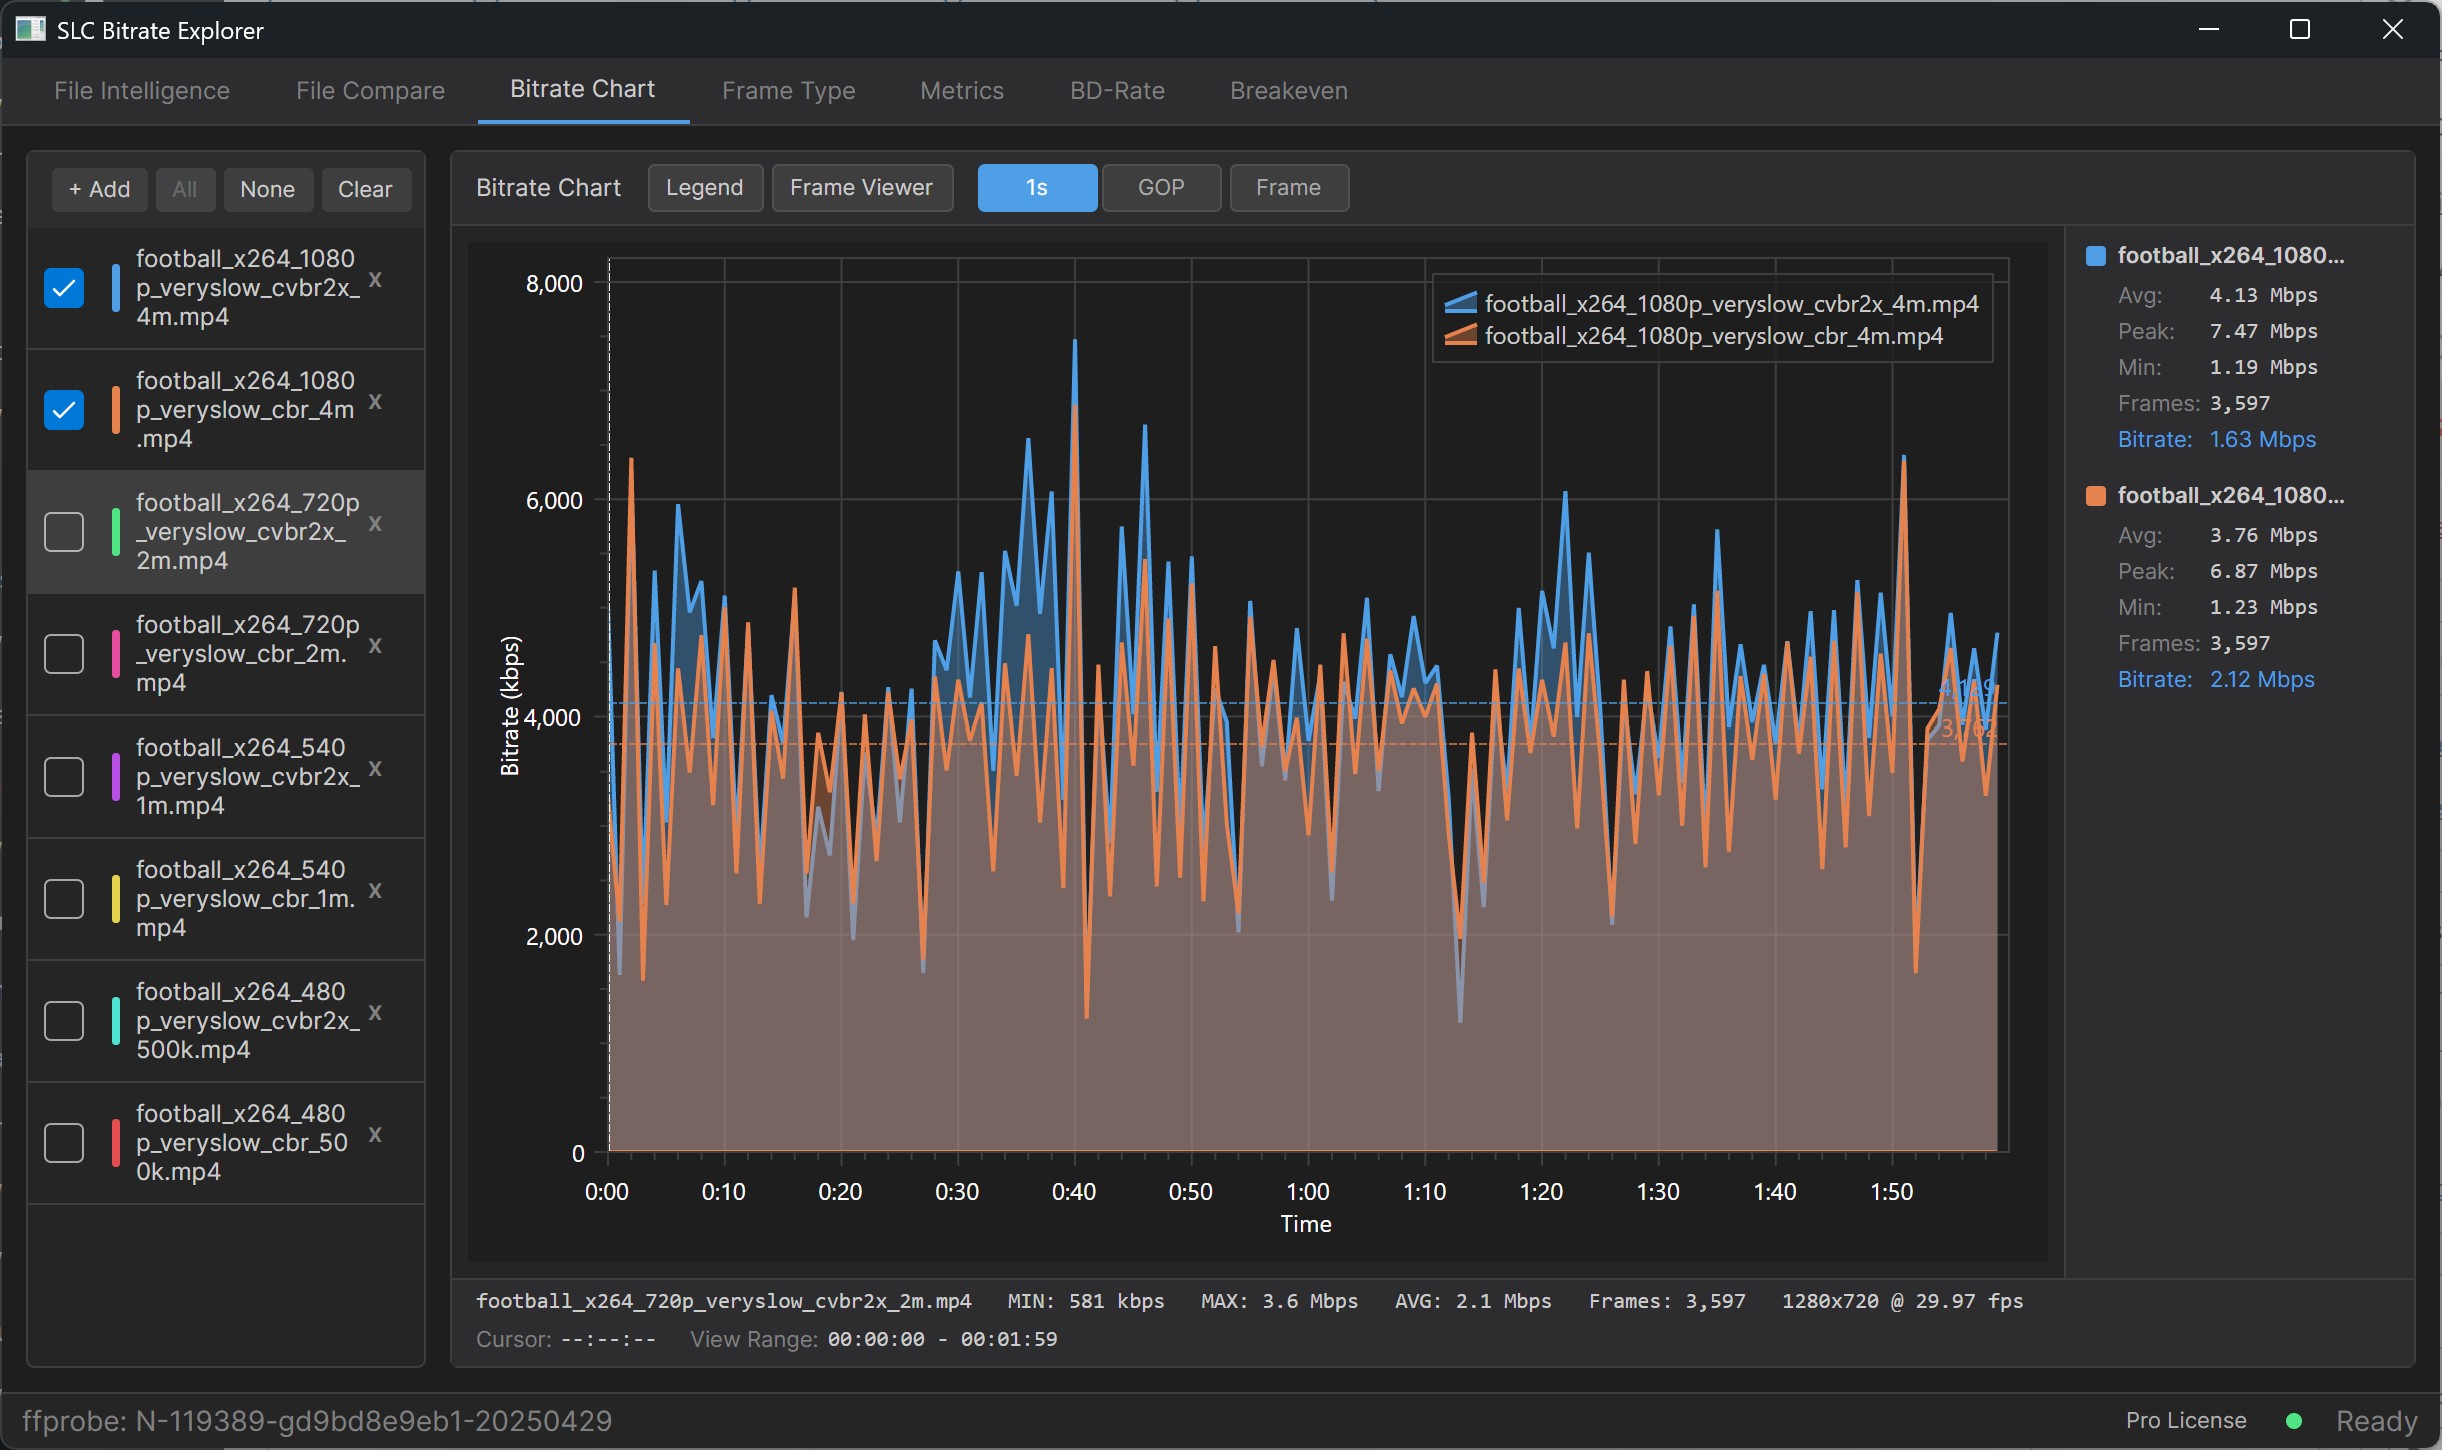
Bitrate Viewer is the classic. Loved by a generation of encoding engineers. Abandoned, H.264-only, Windows-only. No HEVC, no AV1, no VP9. Useful for legacy work and useless for anything you encode today.
The Bitrate Chart tab does what Bitrate Viewer did, for any codec ffprobe can parse. Per-frame, per-second, and per-GOP views. Multi-file overlay with distinct colors. Average bitrate reference lines. Cursor crosshair showing timecode and instantaneous bitrate. Filled area chart, not outline. Load as many files as you need and check or uncheck to control what’s displayed.
For anyone who learned encoding analysis with Bitrate Viewer, this is the modern replacement that keeps the workflow you know and adds the codecs you actually deploy.
Frame Type Tab
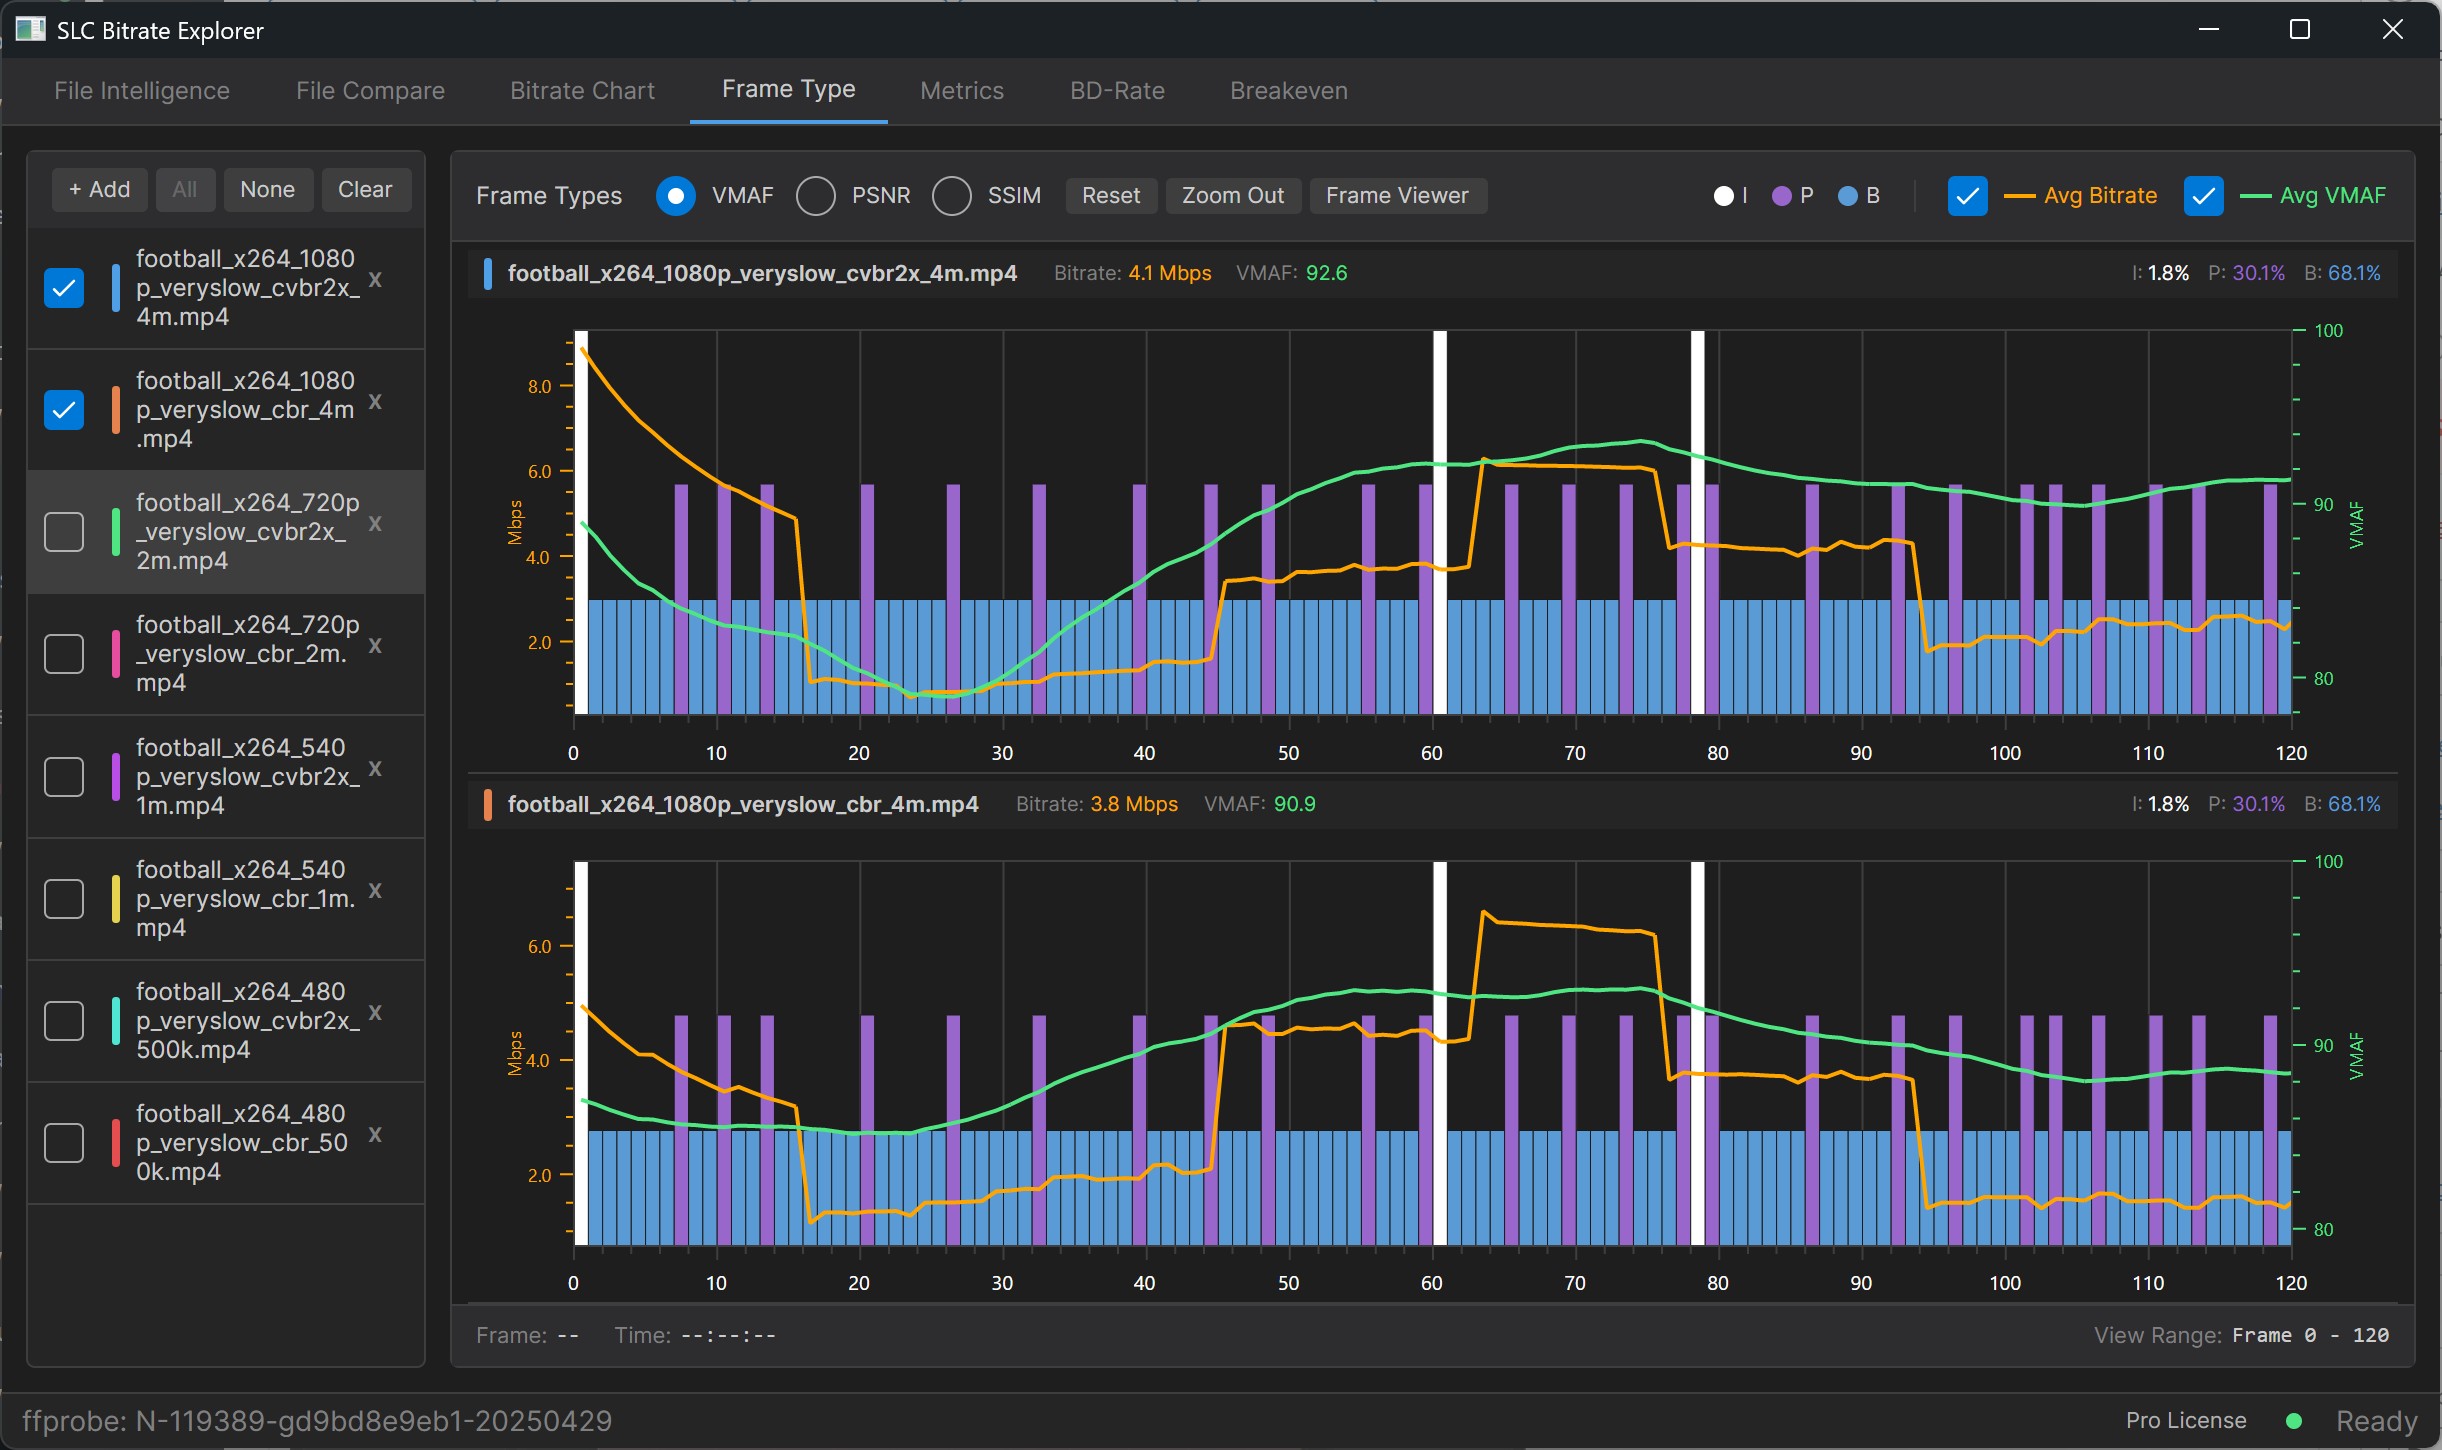
Inspecting GOP structure today means parsing ffprobe JSON or scrolling through MSU VQMT’s frame view. Both work. Neither was built for at-a-glance pattern recognition across an entire timeline.
The Frame Type tab visualizes I, P, and B frames with distinct colors per frame mapped against time, with average bitrate and VMAF overlaid on the same chart. Verify your GOP structure is correct, confirm scene cut I-frames land where expected, and see how bitrate and quality track together frame by frame. Load multiple files for synchronized scrolling across charts.
This is where you catch the encoder doing something unexpected. Open GOPs where you specified closed. Fixed GOP where you wanted scene-adaptive. B-frame patterns that explain the size profile. The diagnosis you used to dig for is on screen.
Metrics Tab
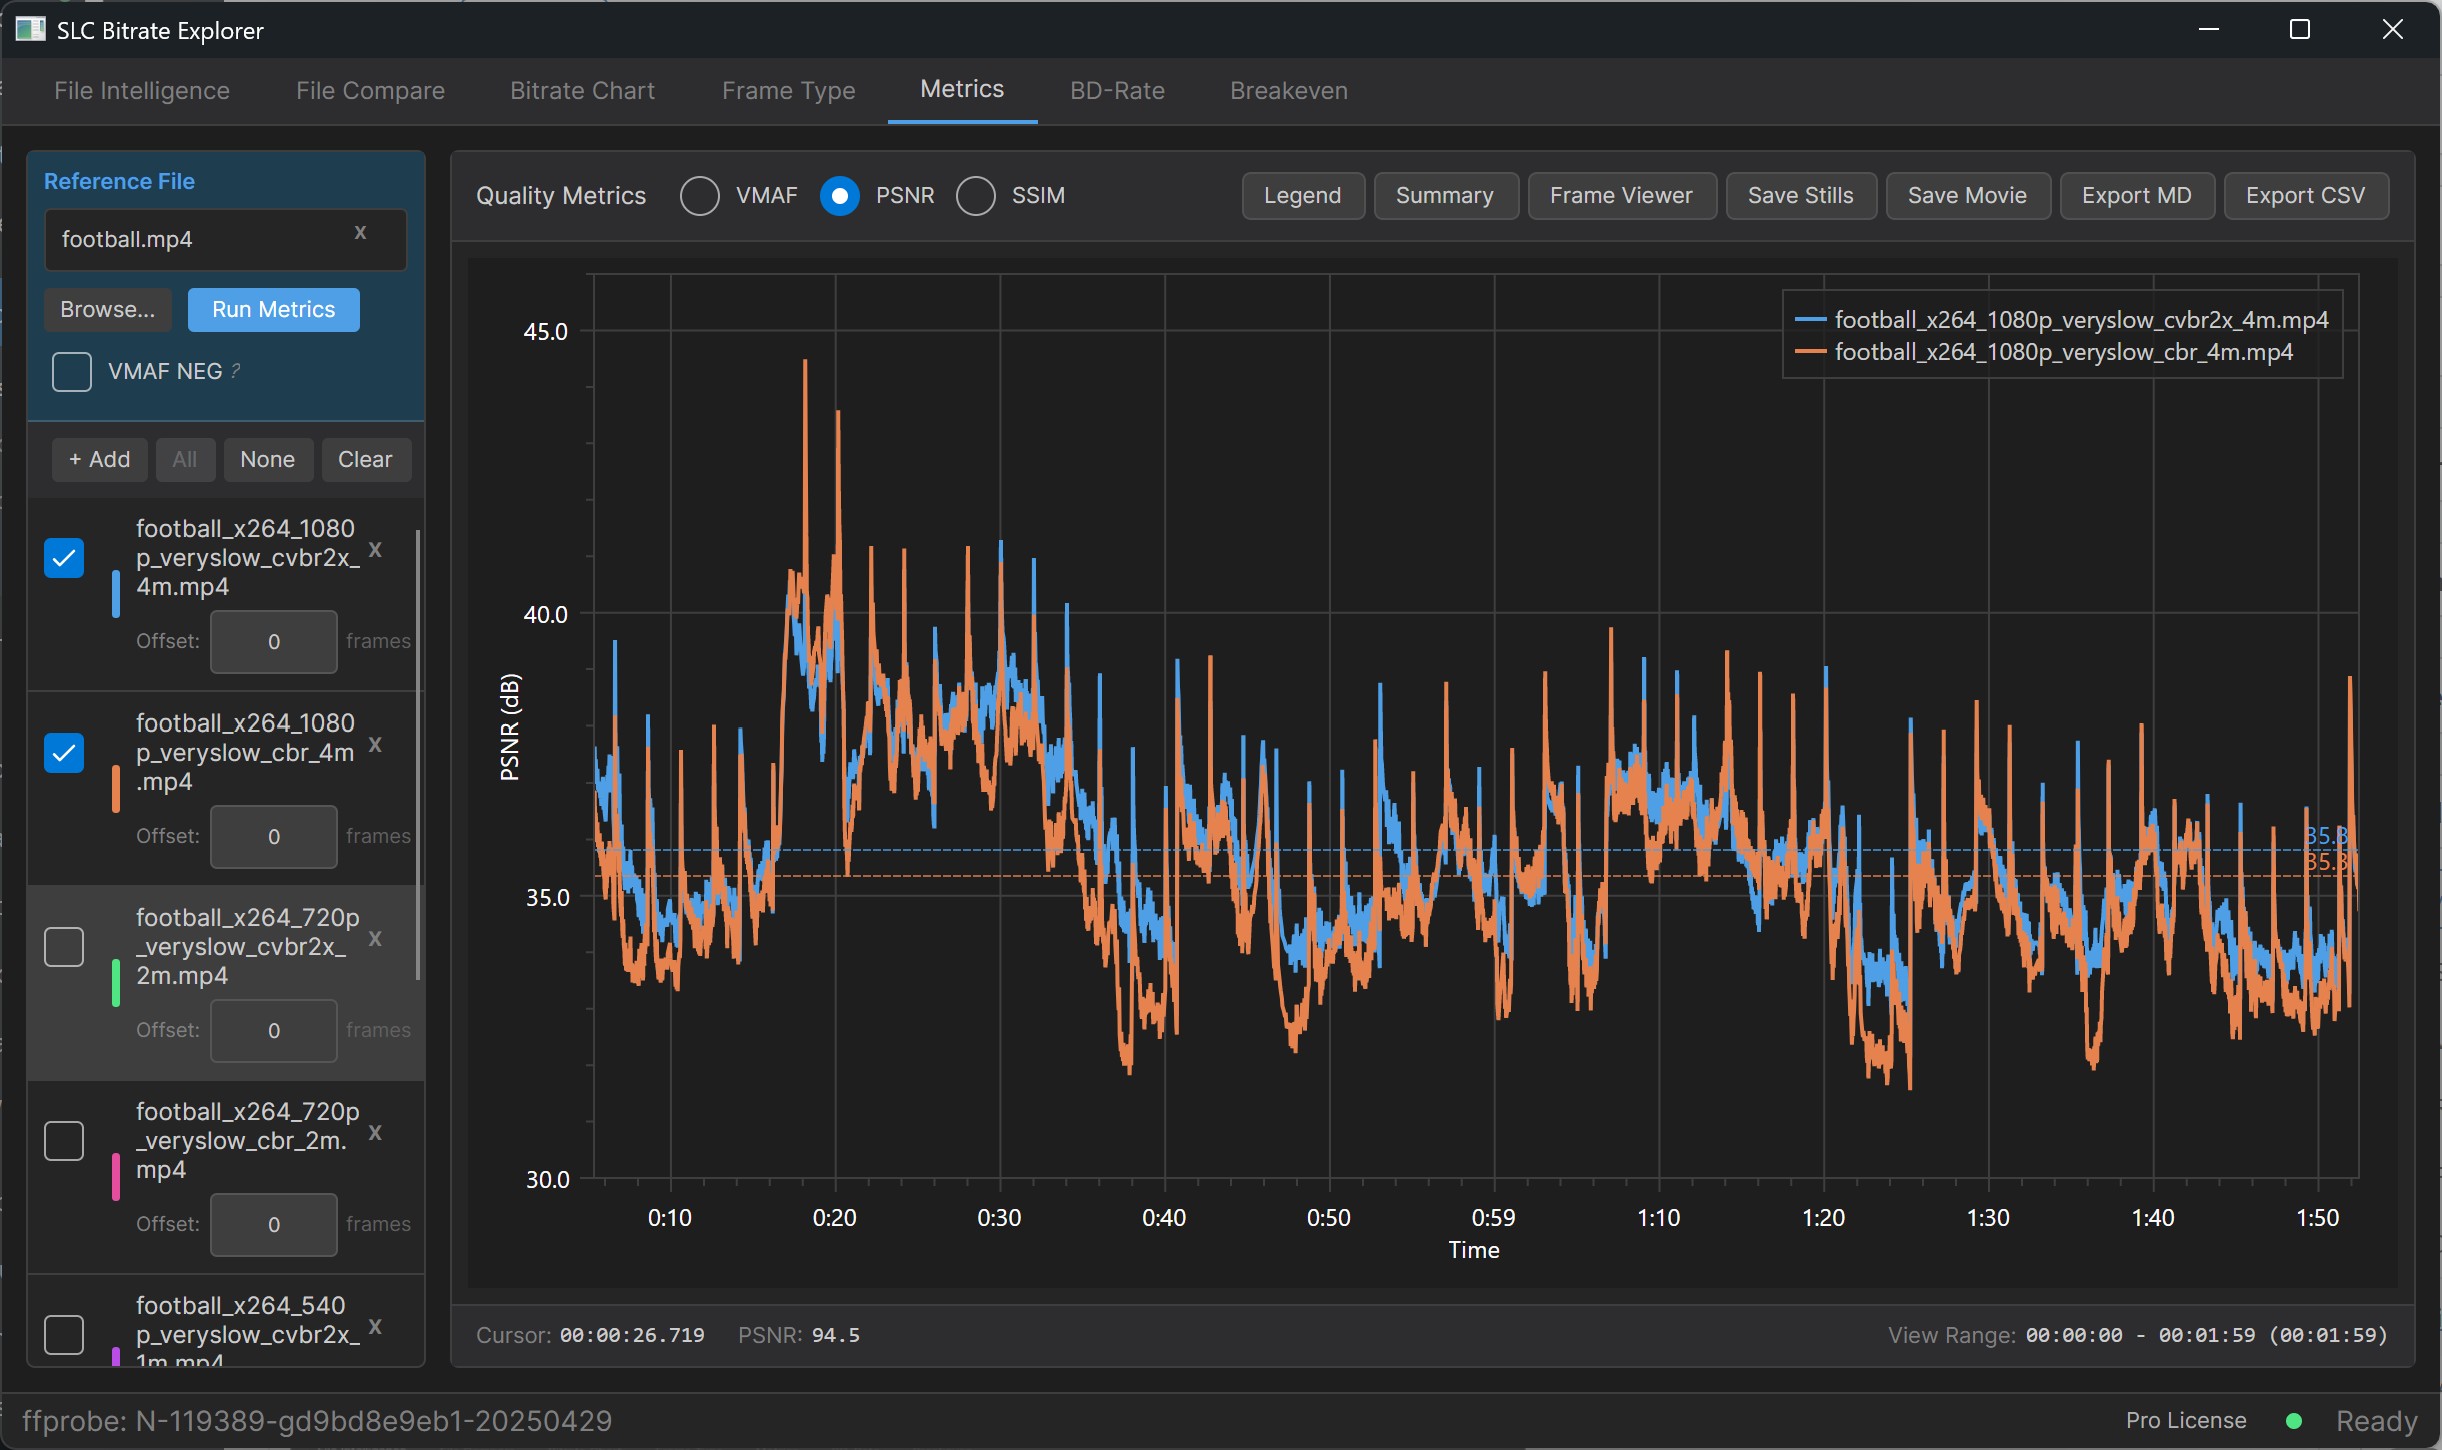
VMAF means ffmpeg with libvmaf, the right model, the right scaling, the right log format, and another script to parse JSON output. PSNR and SSIM are easier but still command-line. None of it produces a chart without additional work.
The Metrics tab loads a reference file, accepts your encodes, and runs VMAF, PSNR, and SSIM simultaneously across all files in a single pass. Results display as per-frame curves with average reference lines. Switch between metrics instantly without re-running. Export to human-readable Markdown for reporting or CSV for further analysis. Save stills or a comparison movie at any frame. Results verified to within 0.01% of MSU VQMT.
Quality measurement should be a five-minute task, not a half-day project. Now it is.
BD-Rate Tab
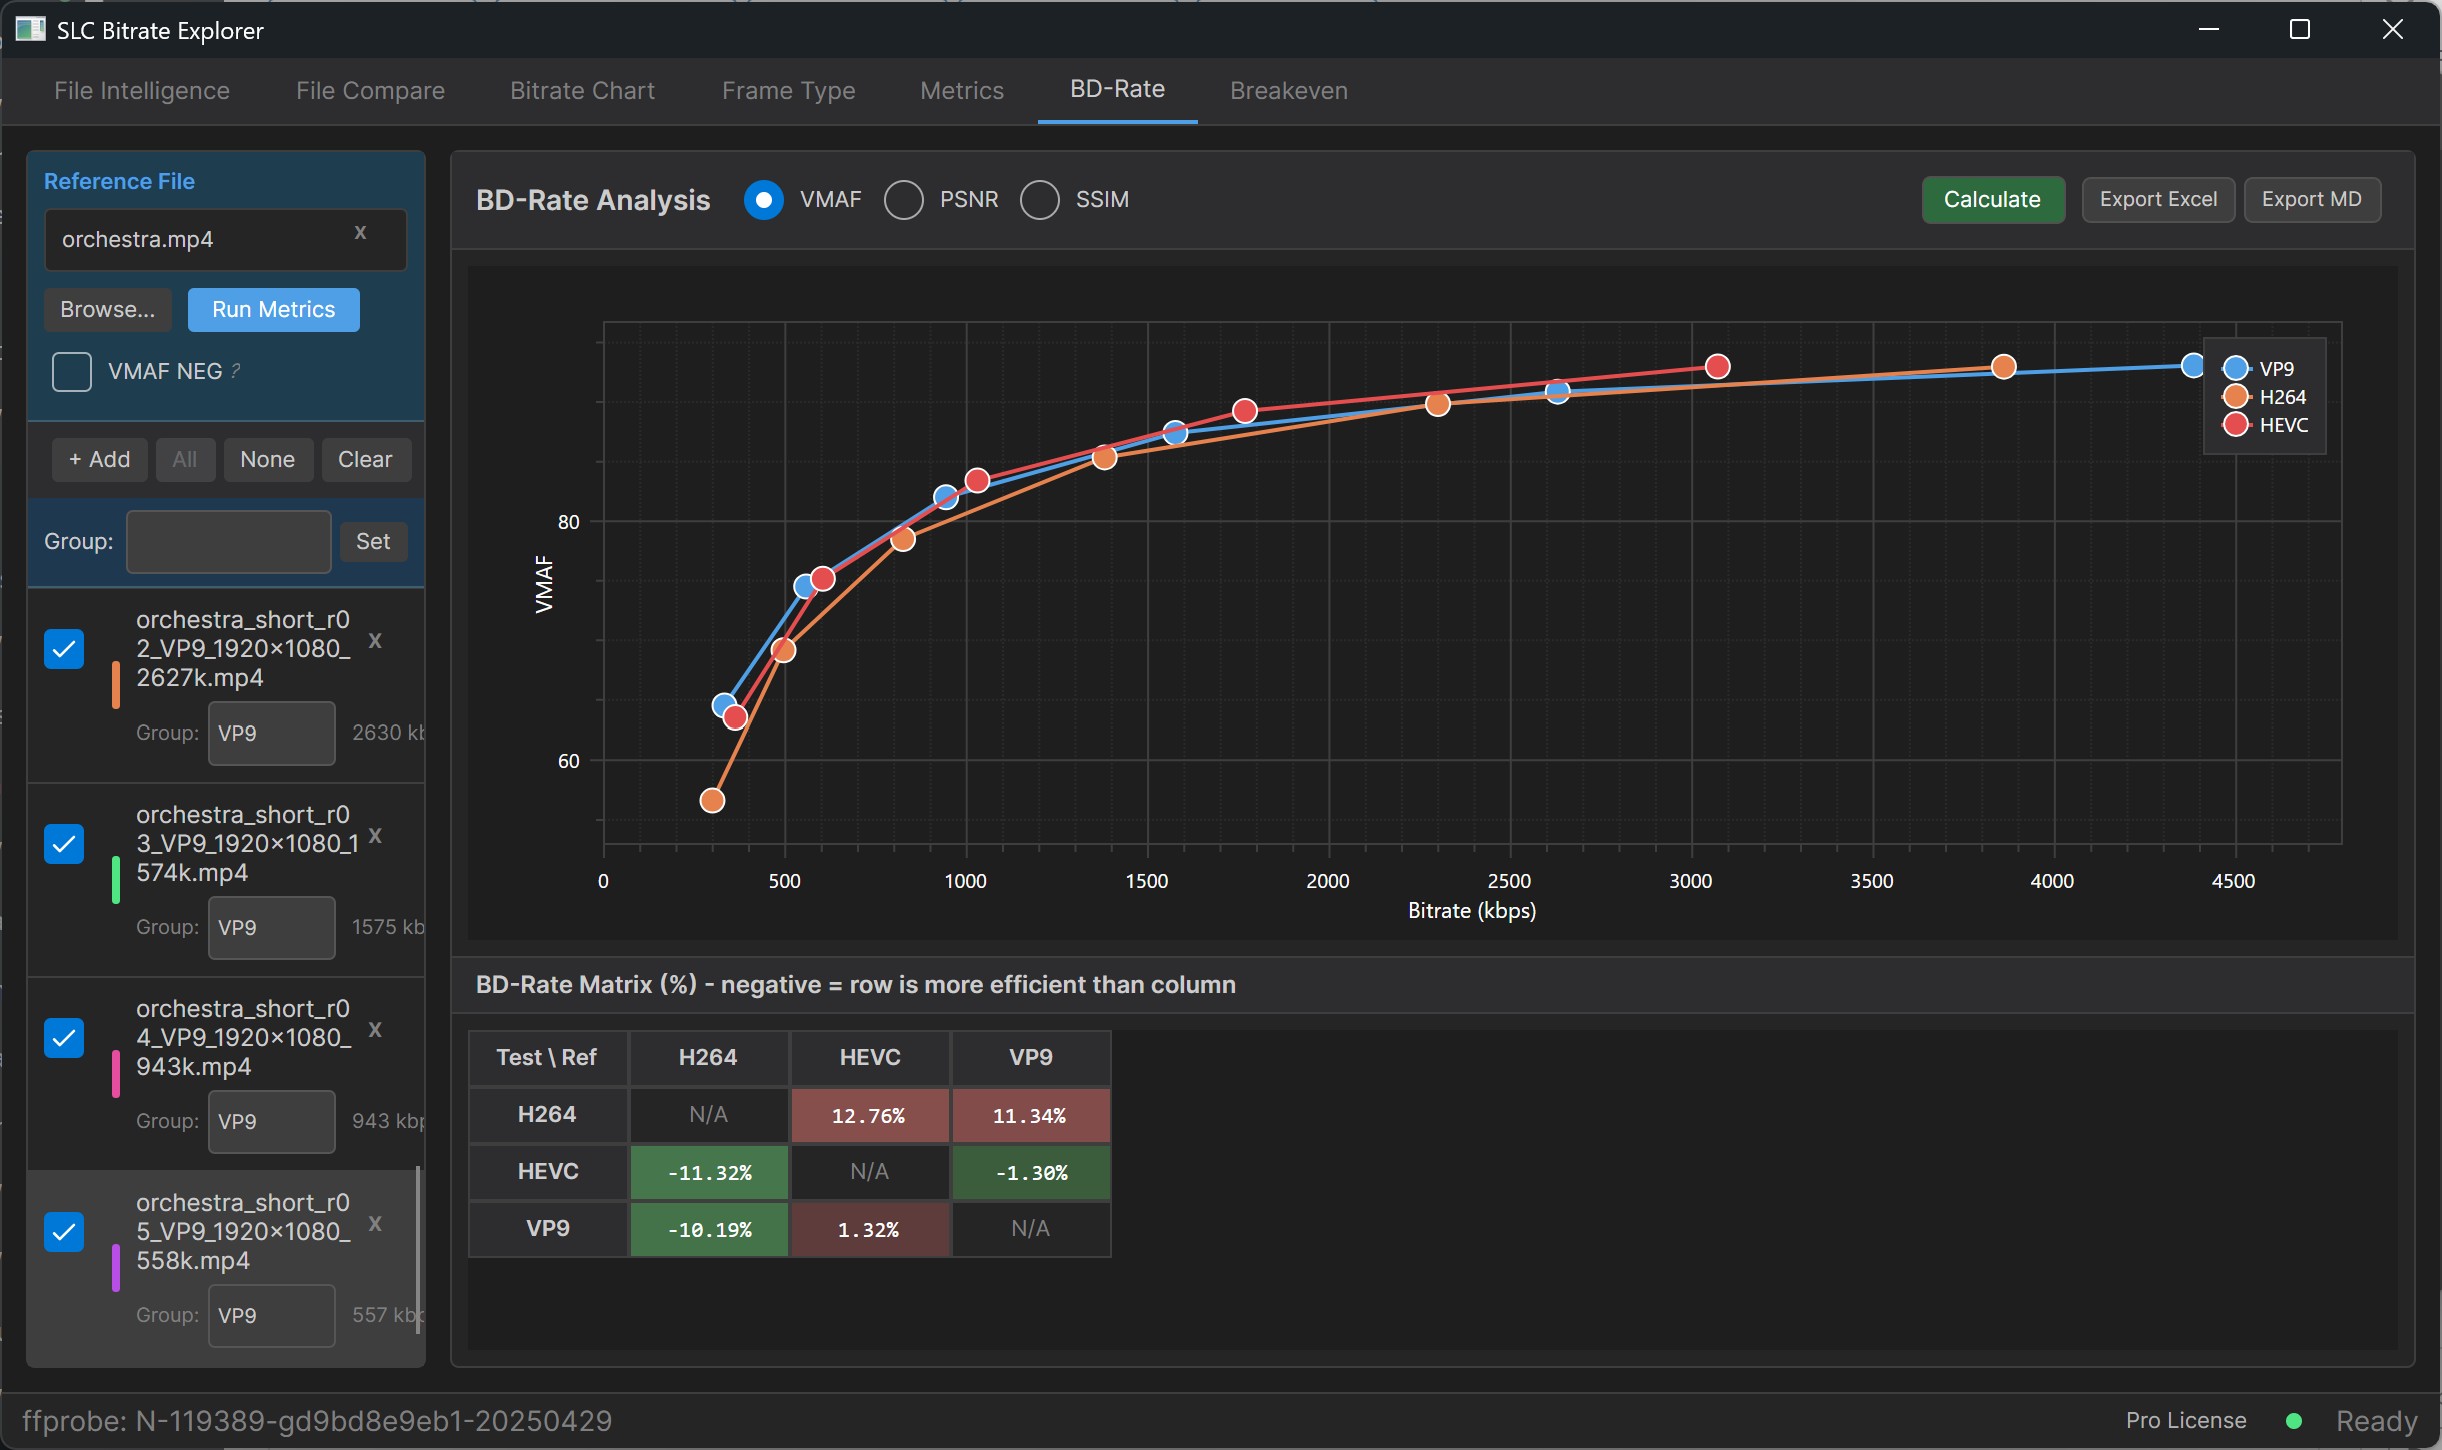
Bjøntegaard Delta Rate is the definitive measure of codec efficiency: how much bitrate one codec needs to deliver the same quality as another across a full encode ladder. Building it manually in Excel is tedious enough that most practitioners skip it.
The BD-Rate tab automates the entire workflow. Load your reference, drag in your encode ladder, and the tool groups files by codec automatically. For non-codec comparisons like single-pass vs multi-pass or preset variations, tagging support handles labeling without manual entry. Press Calculate and get Rate Distortion curves and a BD-Rate matrix in minutes. Save the project so you don’t re-run metrics next time. Export to Excel or Markdown for reporting. Results verified against the standard Excel plugin implementation.
BD-Rate stops being a half-day project and becomes the default way you compare any encoding decision. The bar drops to where it should have been from the start.
Here’s a video exploring the BD-Rate function.
The question after a codec evaluation isn’t “which is more efficient?” It’s “what does this save us?” Most teams answer with a custom spreadsheet, a back-of-the-envelope estimate, or silence.
The Breakeven Calculator models the financial implications of codec adoption against your audience distribution and content volume. Enter your CDN cost per GB, your encoding cost per minute, and your projected viewing hours. Breakeven calculates how many viewing hours it takes for the bandwidth savings to pay back the extra encoding cost, and what the net savings look like at your scale. CDF-based bandwidth allocation reflects real ABR player behavior, not a flat-distribution fantasy.
When you walk into the meeting, you’re not the engineer asking for budget to evaluate AV1. You’re the engineer who has already calculated what AV1 saves on this content portfolio at this audience distribution, and what it costs to get there. That changes the conversation.
Frame Viewer
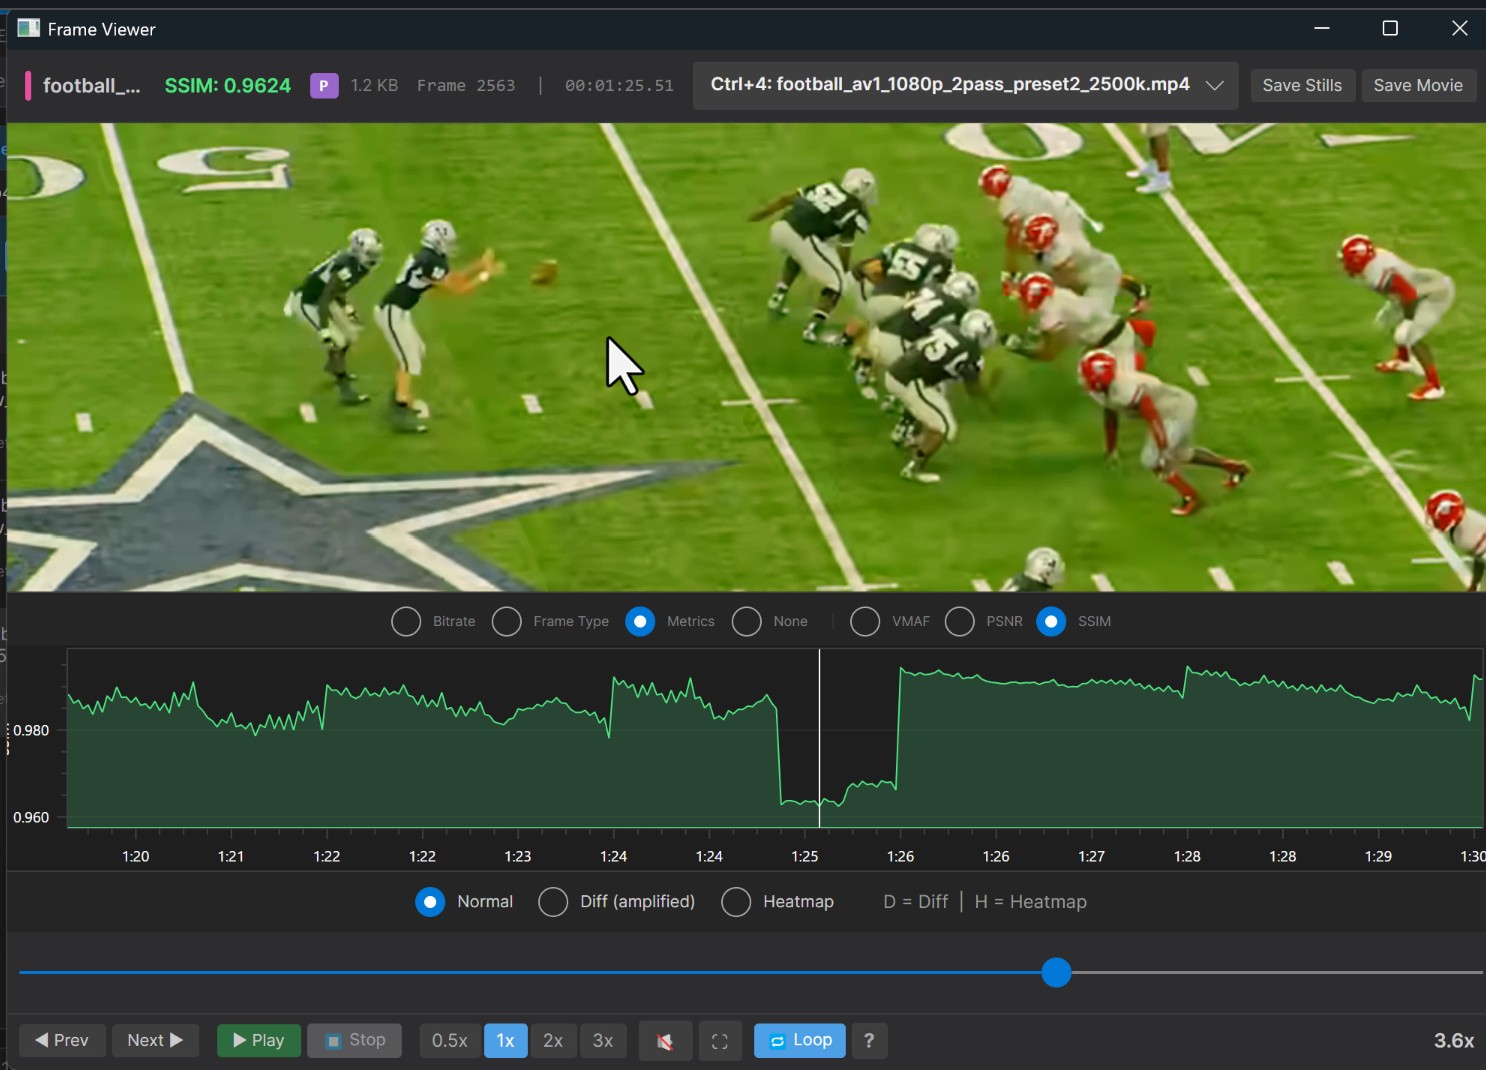
No metric tells the complete story. Frame-level visual comparison means MSU VQMT, which is Windows only. Real-time A/B video playback against a reference is a tool that doesn’t exist anywhere.
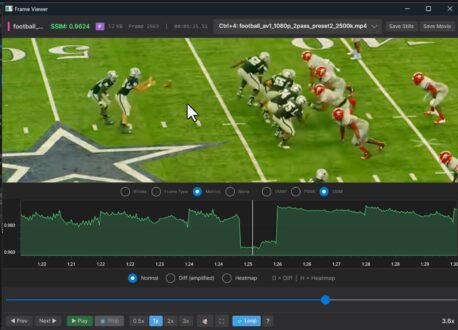
Frame Viewer lets you see your encodes directly. Navigate to any frame, zoom in on detail areas, and switch between files instantly using keyboard shortcuts or the dropdown. Hit play and switch between encodes during live playback. The mini chart below shows bitrate, frame type, or quality metrics in sync with the current position, so you always know what you’re looking at and why it looks that way. Set in- and out-points to loop a specific section while switching between files. Same workflow on Mac and Windows.
Viewing frame and video playback quality is the daily-driver feature for codec evaluation work. Metrics are useful, but observed video quality is the gold standard.
Here’s a YouTube video that showcases metric calculation, still-frame analysis, and video quality analysis.
Versions Available – Download/Installation Instructions

Windows x64 – Download
MacOS Intel – Download
MacOS Apple Silicon – Download
System Requirements
All platforms:
– ffprobe + ffmpeg must be on PATH (not bundled)
– ~130 MB disk space for the app itself
Windows x64 (win-x64)
– Windows 10 or later, 64-bit
– .NET runtime bundled (self-contained)
macOS Intel (osx-x64)
– macOS 10.15 (Catalina) or later, Intel
– .NET runtime bundled (self-contained)
– VLC 3.x must be installed
macOS Apple Silicon (osx-arm64)
– macOS 11 (Big Sur) or later, Apple Silicon (M1/M2/M3/M4)
– .NET runtime bundled (self-contained)
– VLC 3.x must be installed