Streaming Learning Center Where Streaming Professionals Learn to Excel

Related Articles

Most video engineers use a similar tool stack. MediaInfo for file data, Bitrate Viewer to view the bitrate of H.264-encoded files on Windows, Moscow State University VQMT on Windows for metrics, with a custom combination of data input scripts and Excel for RD curves and BD-Rate data.
Most tools have critical gaps. Few let you compare videos during real-time playback, which is essential to verify whether quality scores actually reflect subjective quality. Few tools below four figures show frame and GOP-related data. None helps you analyze whether a new codec or higher-quality encoding configuration actually makes economic sense.
Most quality-seeking encoding decisions involve increasing encoding cost and increasing storage requirements. AV1 might drop bitrates by 35%, but AV1 is expensive to encode, and the storage costs are additive. Moving from the medium to the very slow preset will allow you to deliver the same quality at a lower bitrate but might quadruple your encoding costs. This might make sense if each file is viewed 20,000 times, but probably not 500 views.
Understanding these dynamics is critical to effective decision-making. All encoding decisions are, at their core, economic decisions, but there’s no easy way to get from VMAF data to ROI. If you’re using different tools for different functions, you’re often copying and pasting data from one tool to another, including tools working on different operating systems.
The Streaming Learning Center’s Bitrate Explorer (SBE) was designed to simplify and accelerate the analyses that help you make better encoding-related decisions. File data, metrics, still-image and frame comparisons, BD-Rate and RD-curves, and an ROI analysis you can refine to incorporate your actual delivery patterns. SBE is available on Windows and Mac (Intel and ARM).
To illustrate how SBE enables better decision making, I encoded a short 1080p60 football clip to codec-specific encoding ladders with H.264, HEVC, VP9, and AV1 at matched quality (~VMAF 93 at the top rung). In this article, I review SBE’s capabilities and workflow, taking you through the various tools tab by tab. You’ll learn what each tab shows, what it means, and where the cross-codec comparison isn’t as direct as it looks.
Contents
File Intelligence
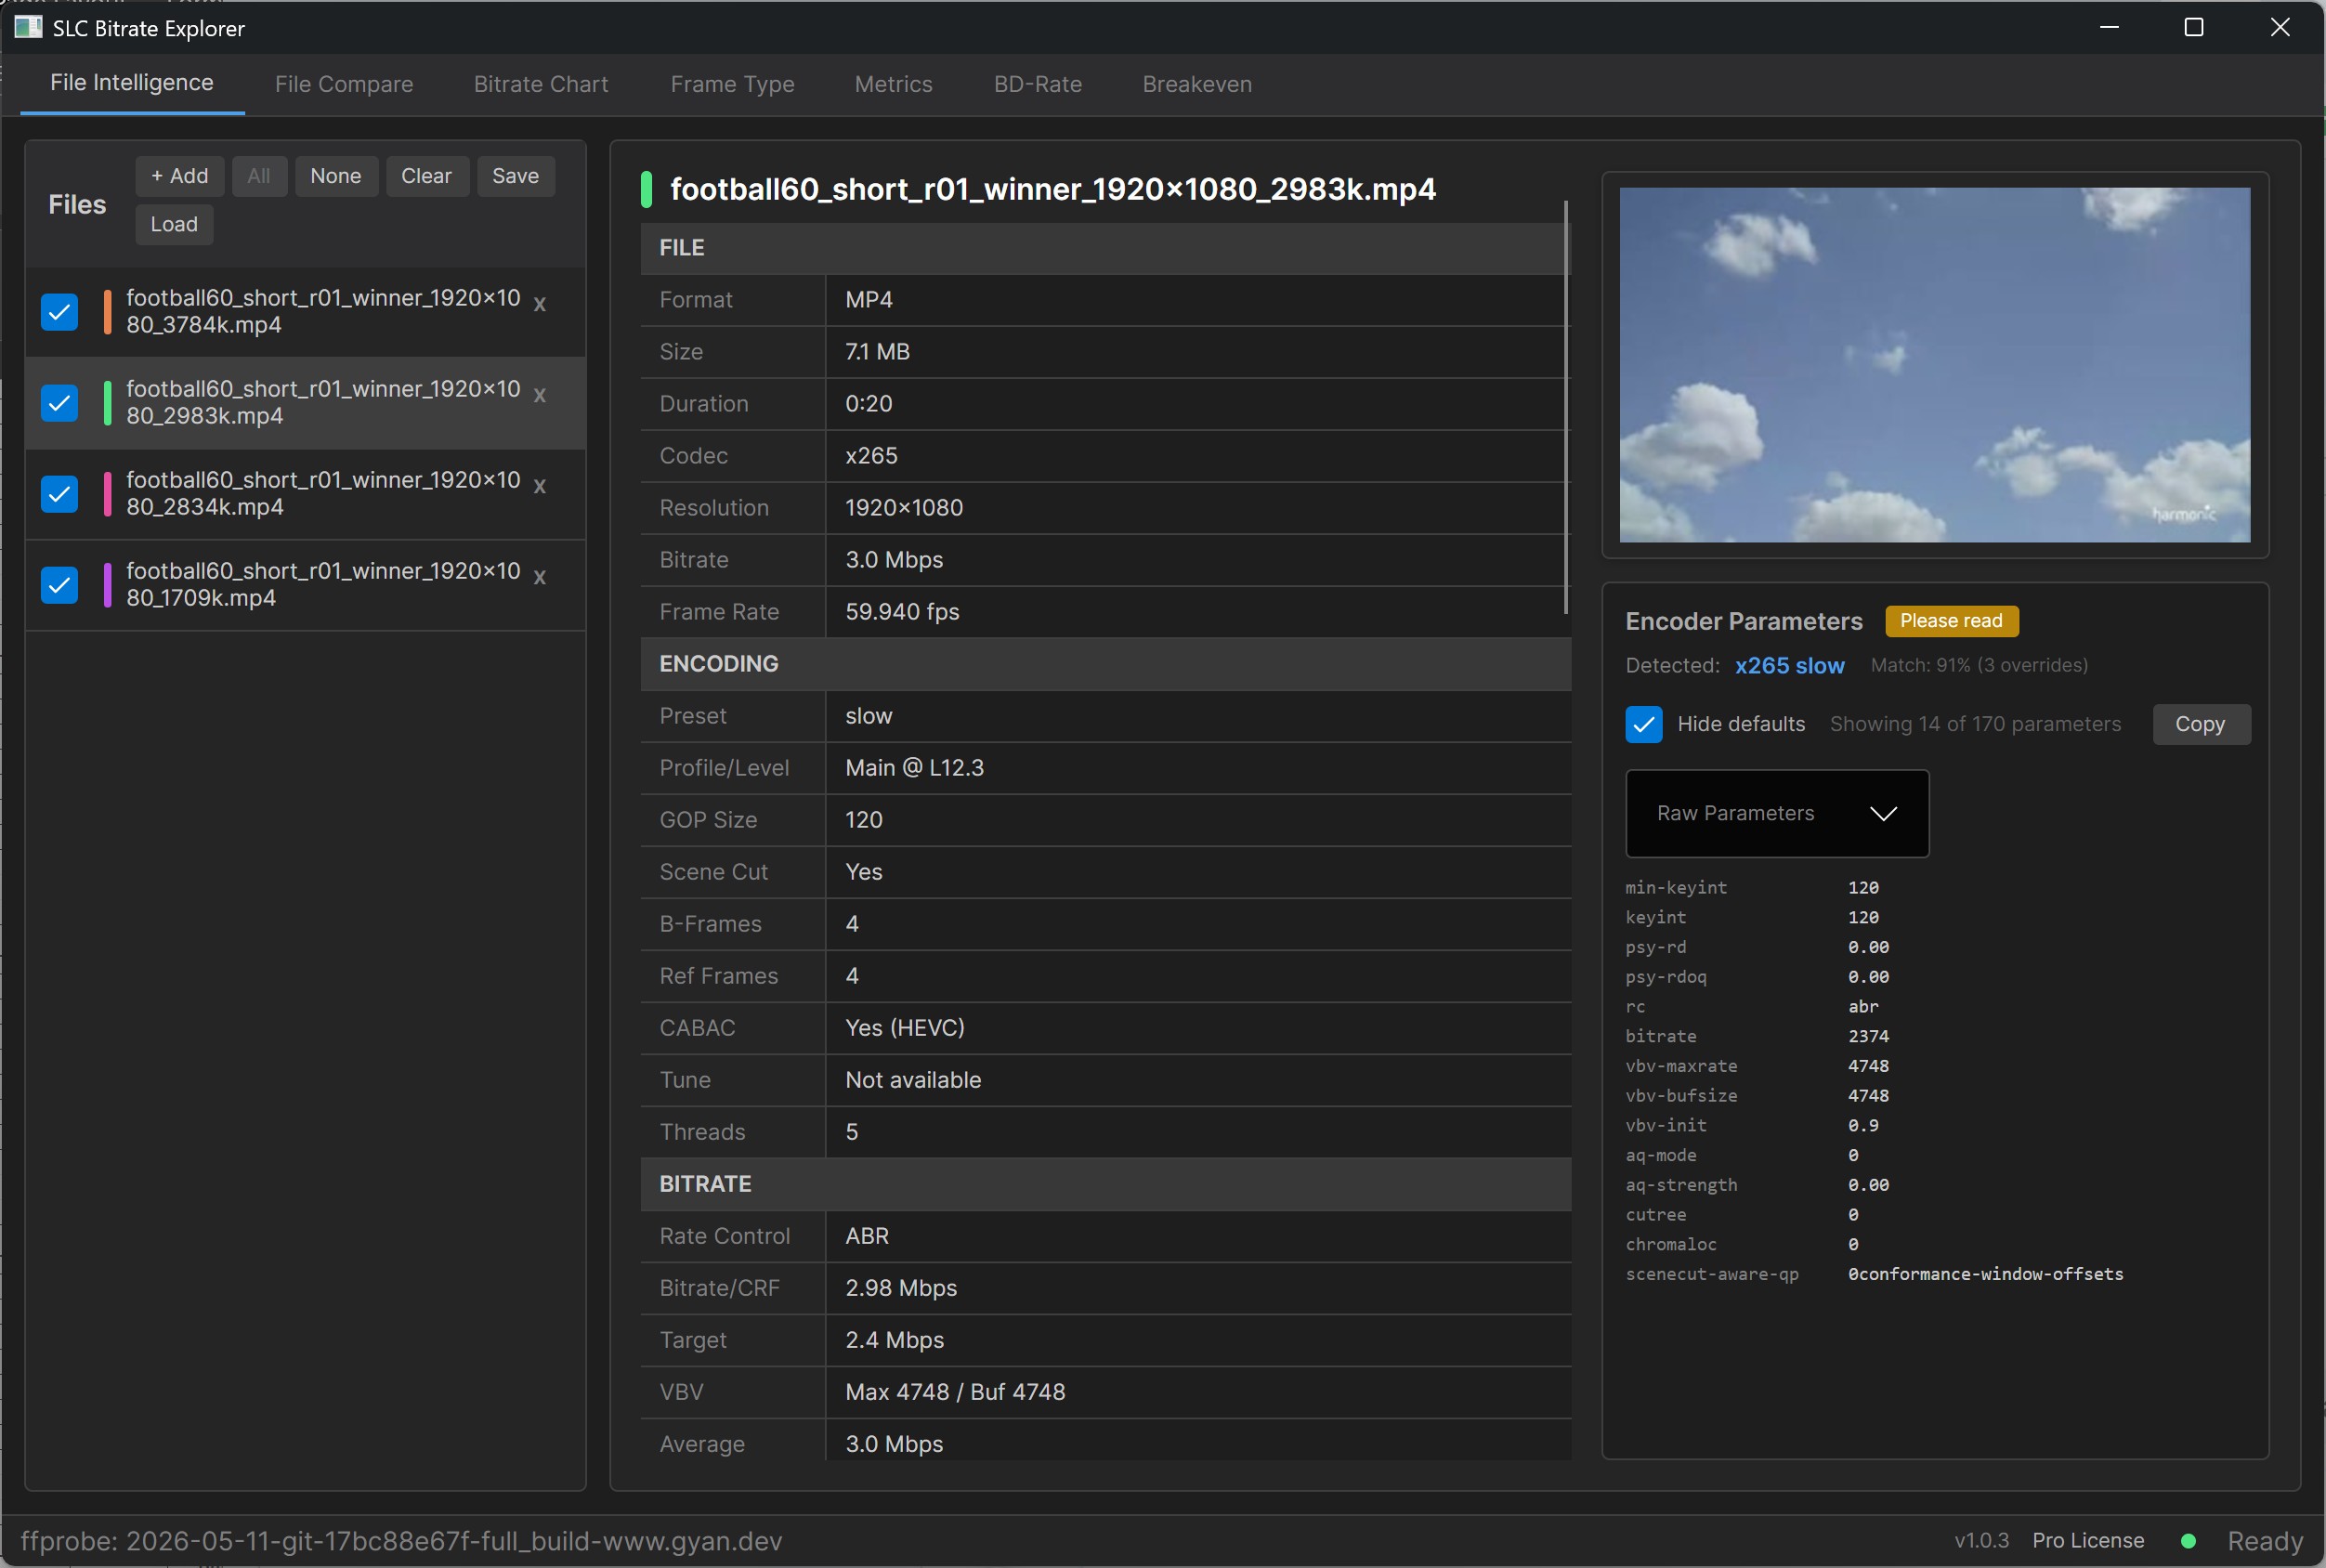
MediaInfo is pervasive because basic file details underpin the analysis of any file. At its core, MediaInfo runs FFprobe on the file and reports data like resolution, codec, and bitrate. SBE does the same, but adds several features:
-
- A video thumbnail so you don’t have to play the file to figure out what it is
- With x264 and x265 encodes, it analyzes the data FFprobe delivers to identify the preset used to encode the file
- If you click the Hide Defaults check box on the right, SBE hides all default settings so you can see the ones that were actually customized. If you’ve hunted through the MediaInfo HTML view to identify how a particular encode differs, you’ll find this instantly useful.
File Compare
The File Compare function is next. Load multiple files into SBE, then click the Compare button; SBE displays the file data in columns. Click Show Deltas only, and the tool hides all common configurations, allowing you to instantly see how the files differ.
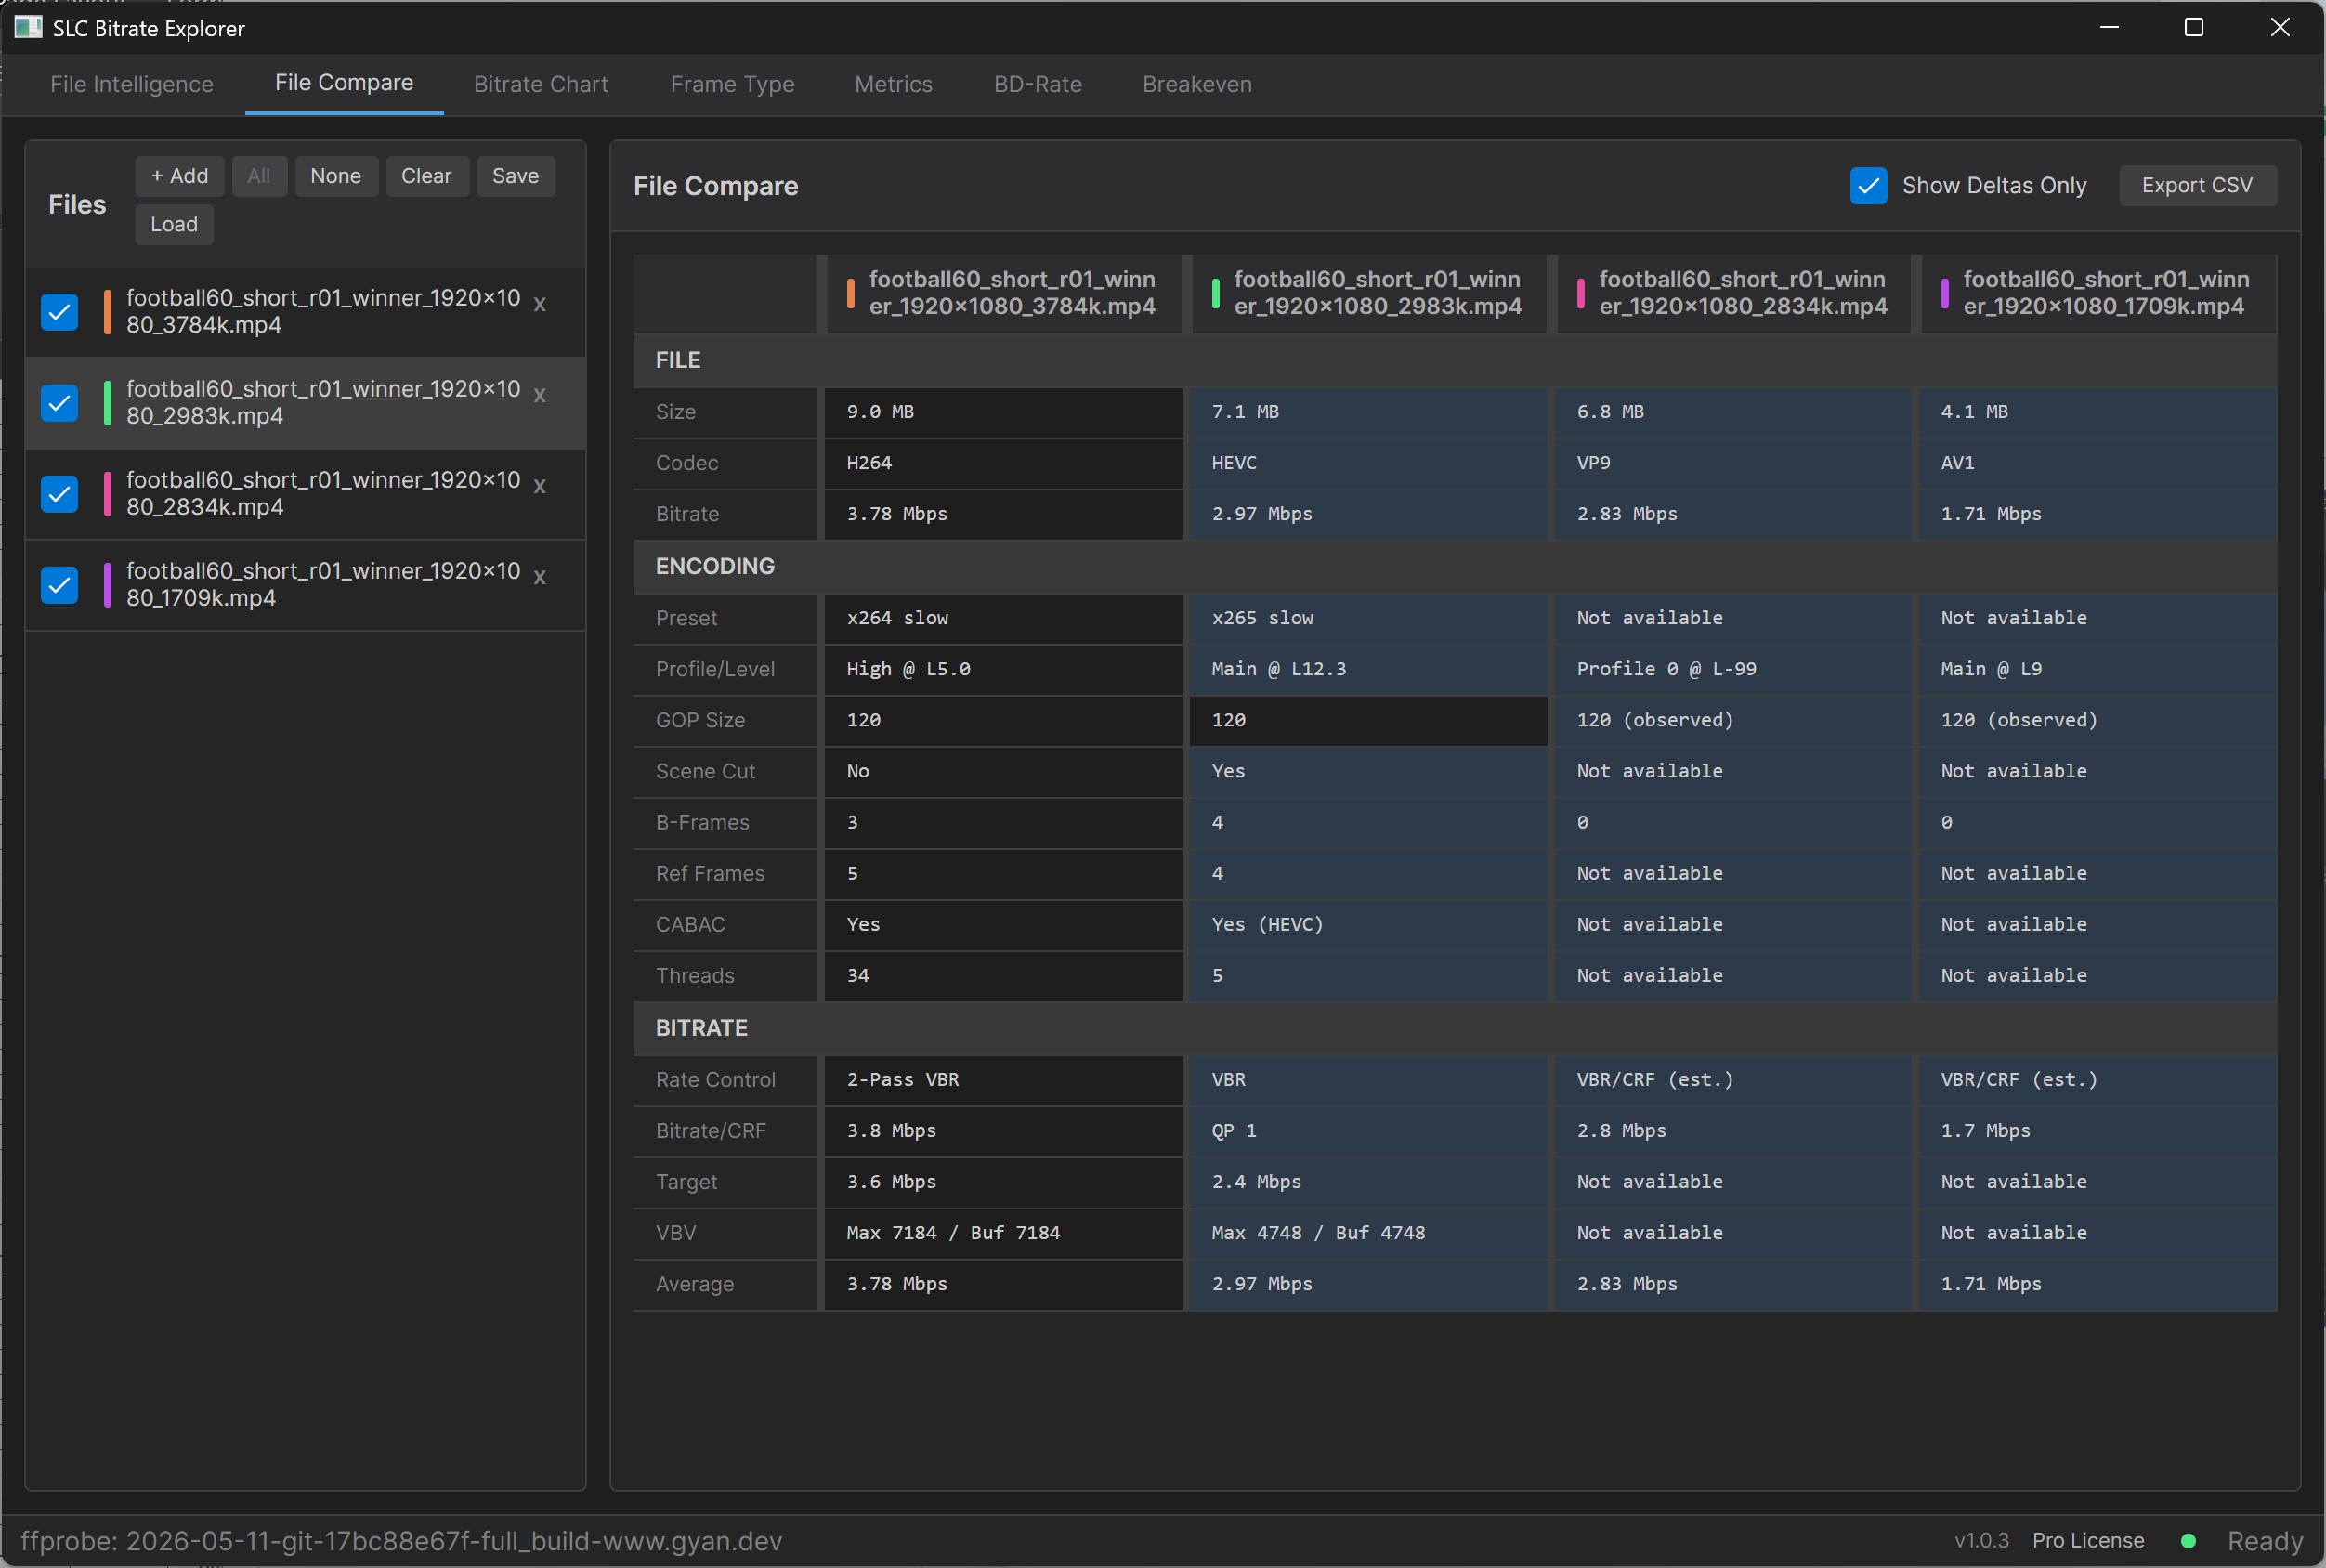
Figure 2 shows the top rung for all four codecs. File sizes at the top: H.264 9.0 MB, HEVC 7.1 MB, VP9 6.8 MB, AV1 4.1 MB. Same source, same target VMAF, AV1 is less than half the size of H.264.
Below that data are the parameter deltas: preset, profile, GOP, B-frames (3/4/0/0), reference frames, and rate control. The B-frame counts look like the headline structural difference. The Frame Type section below explains why that comparison isn’t as direct as it looks.
In the interest of full and fair disclosure, as with MediaInfo, SBE can only report the metadata the encoder included in the file. With x264 and x265, the information is comprehensive. With VP9 and AV1, much less so. With third-party encoders like AWS MediaConvert, there’s usually even less data.
Here’s a video that shows the File Intelligence and Compare Tabs.
How are the bits being spent? Bitrate Chart
The next tab is the Bitrate Chart, a bit like Bitrate Viewer, but it can handle any codec FFprobe can analyze, including AV1, VP9, and VVC, as well as H.264 and HEVC.
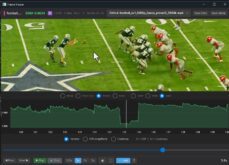
Scanning Figure 3, you see that the average bitrate is a summary statistic. The shape of the bitrate curve over time tells you how each codec’s rate control actually behaves on this content, including where it spikes, where it conserves, how it tracks the scene complexity, and where it fights it. As with Bitrate Viewer, you can also view the bitrate in GOP or frame view.
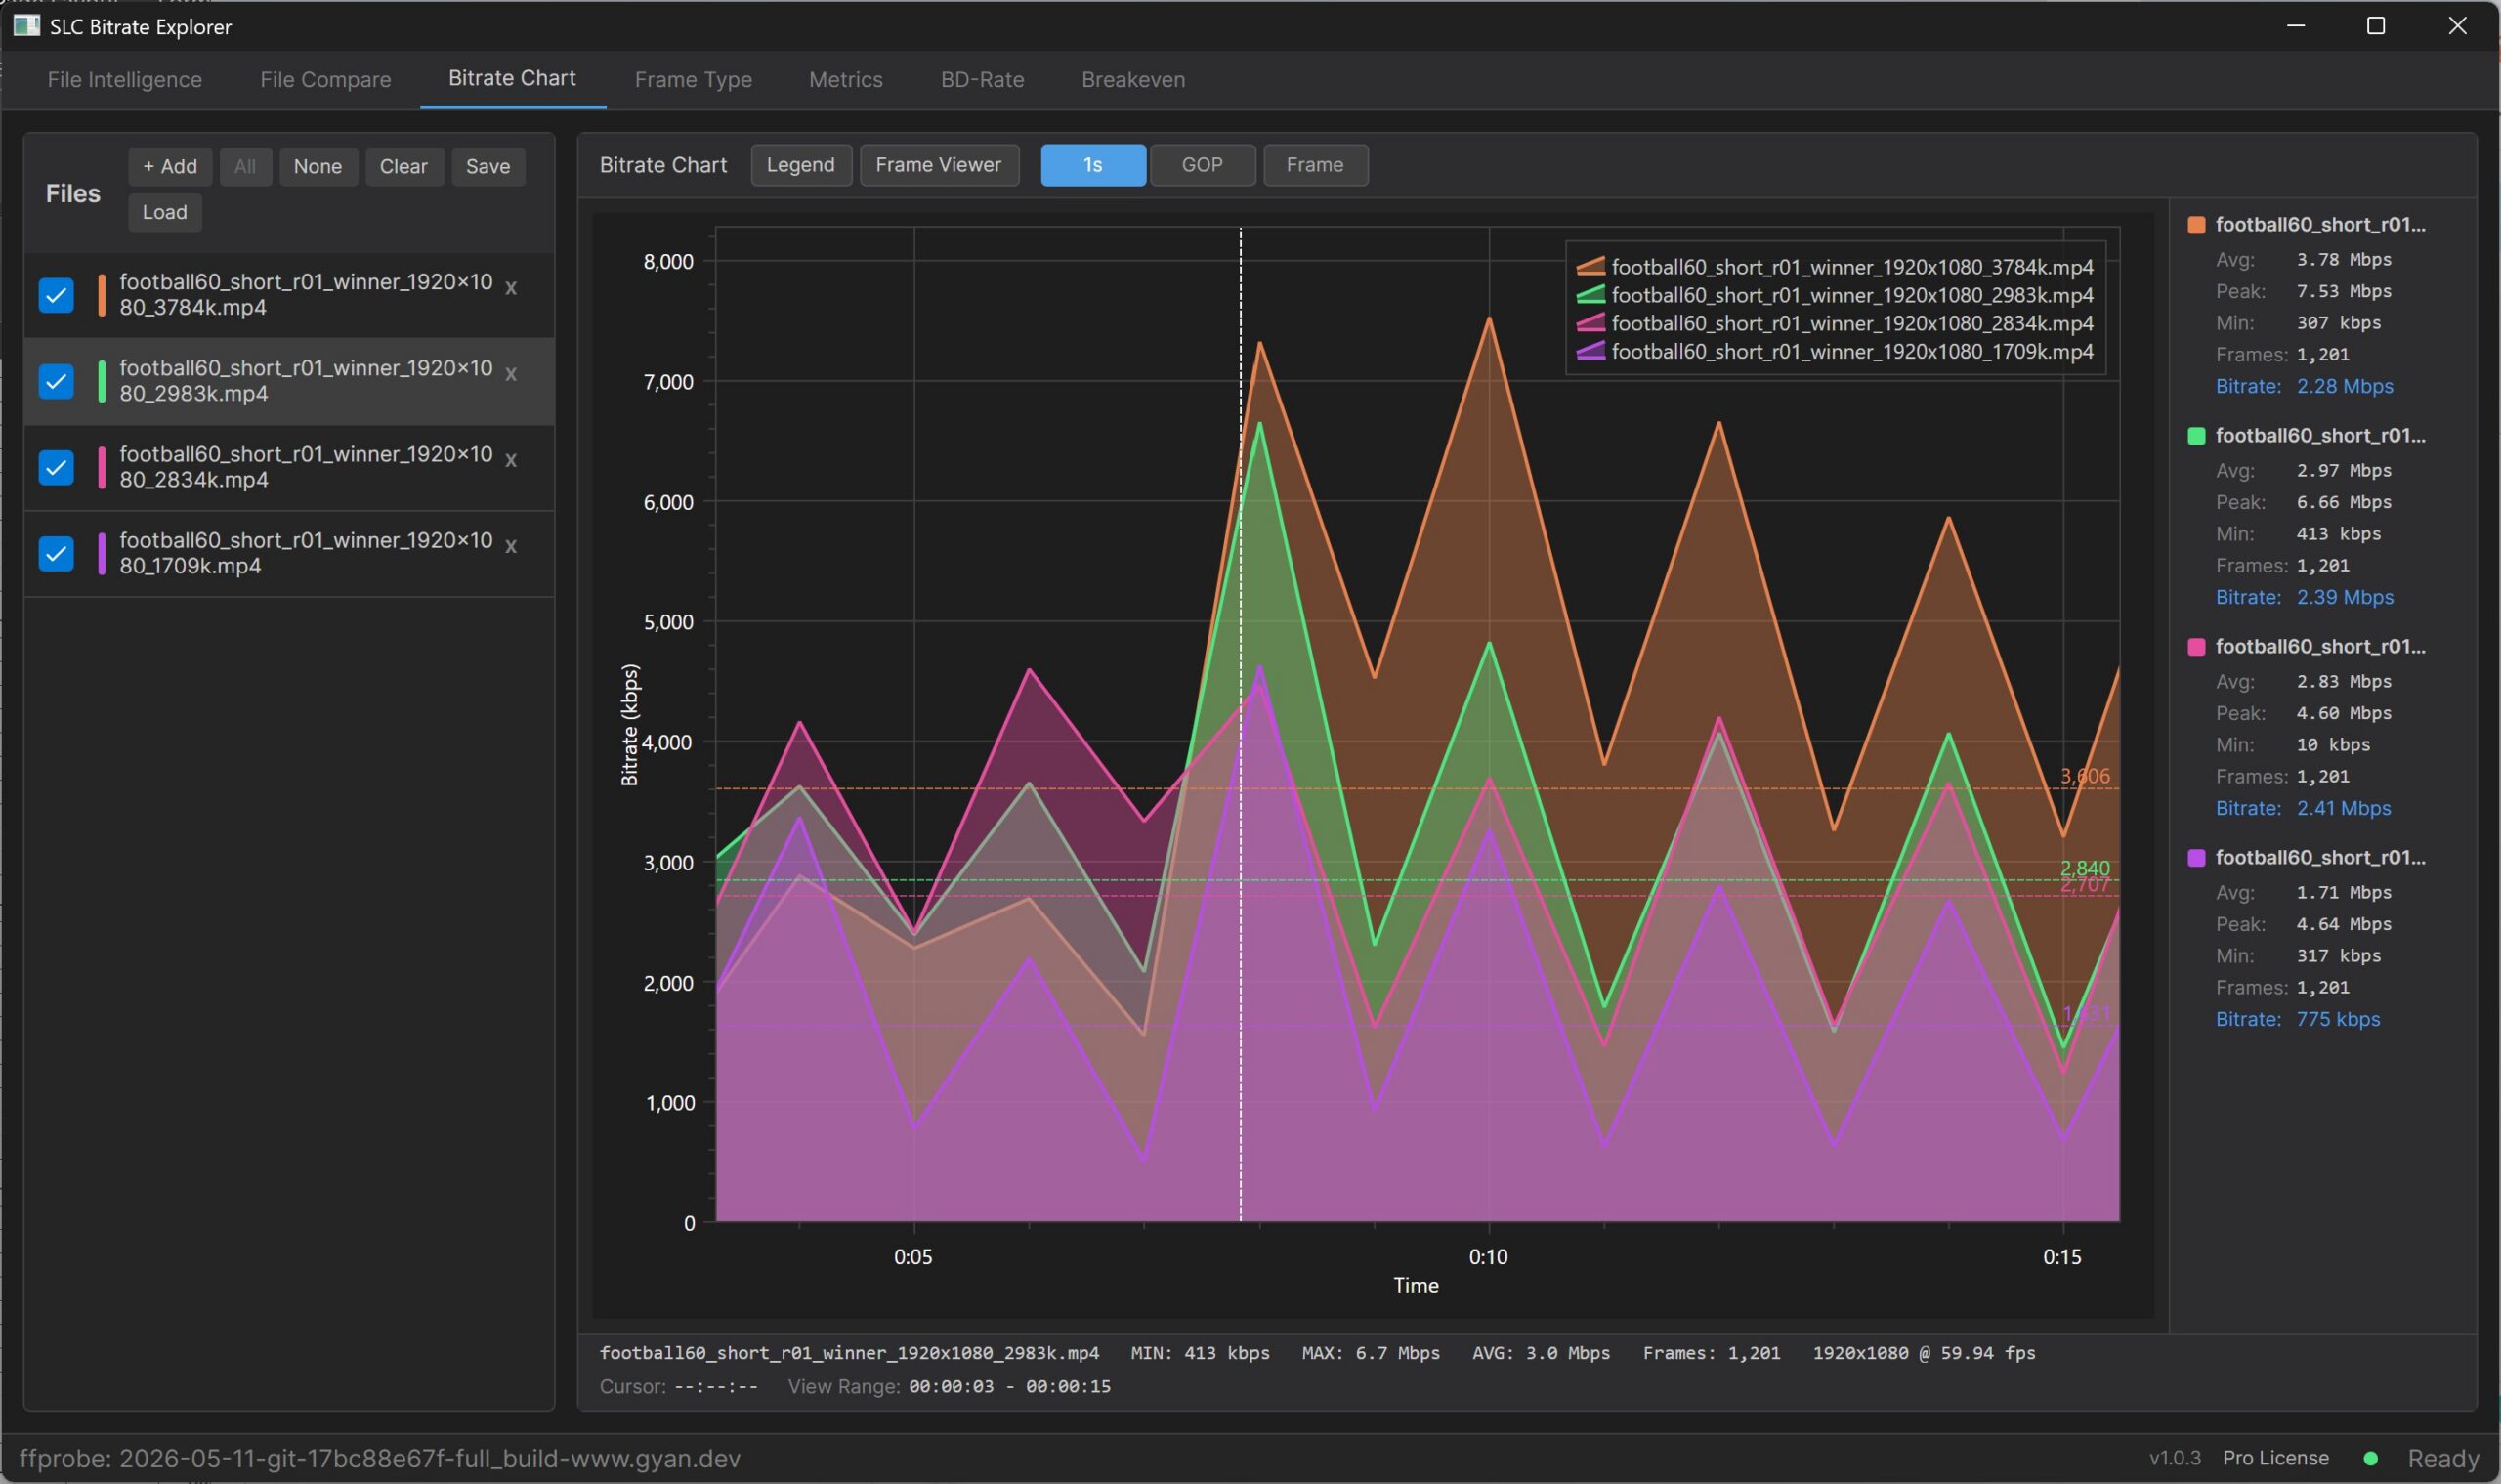
If you study the top toolbar above the bitrate chart, you’ll see the Frame Viewer button. This opens a player you can use to click to view still frames or video, which is useful when you want to gauge video quality at the bitrates shown in this tab. We’ll explore this below when studying the Metrics Tab.
Are Your GOPs Aligned – Frame Type
The Frame Type tab shows the I/P/B distribution from each codec’s bitstream over time, with average bitrate and VMAF overlaid on the same chart. This is useful for verifying GOP structure, confirming that scene-cut I-frames land where you expected, and checking that B-frame patterns match what you configured at the encoder. This feature is available in the free version of SBE; you’ll have to spend over $1,000 to get this feature in Telestream Switch or other similar tools.
Figure 4 shows the four top rungs stacked in this frame view. You can see that all the videos have matching GOP intervals, which is always good to validate. You can also see that the top two videos, x264 and x265, include I, B, and P frames, while the bottom two, VP9 and AV1, don’t include B frames. That isn’t quite right, and it’s worth being precise about why.
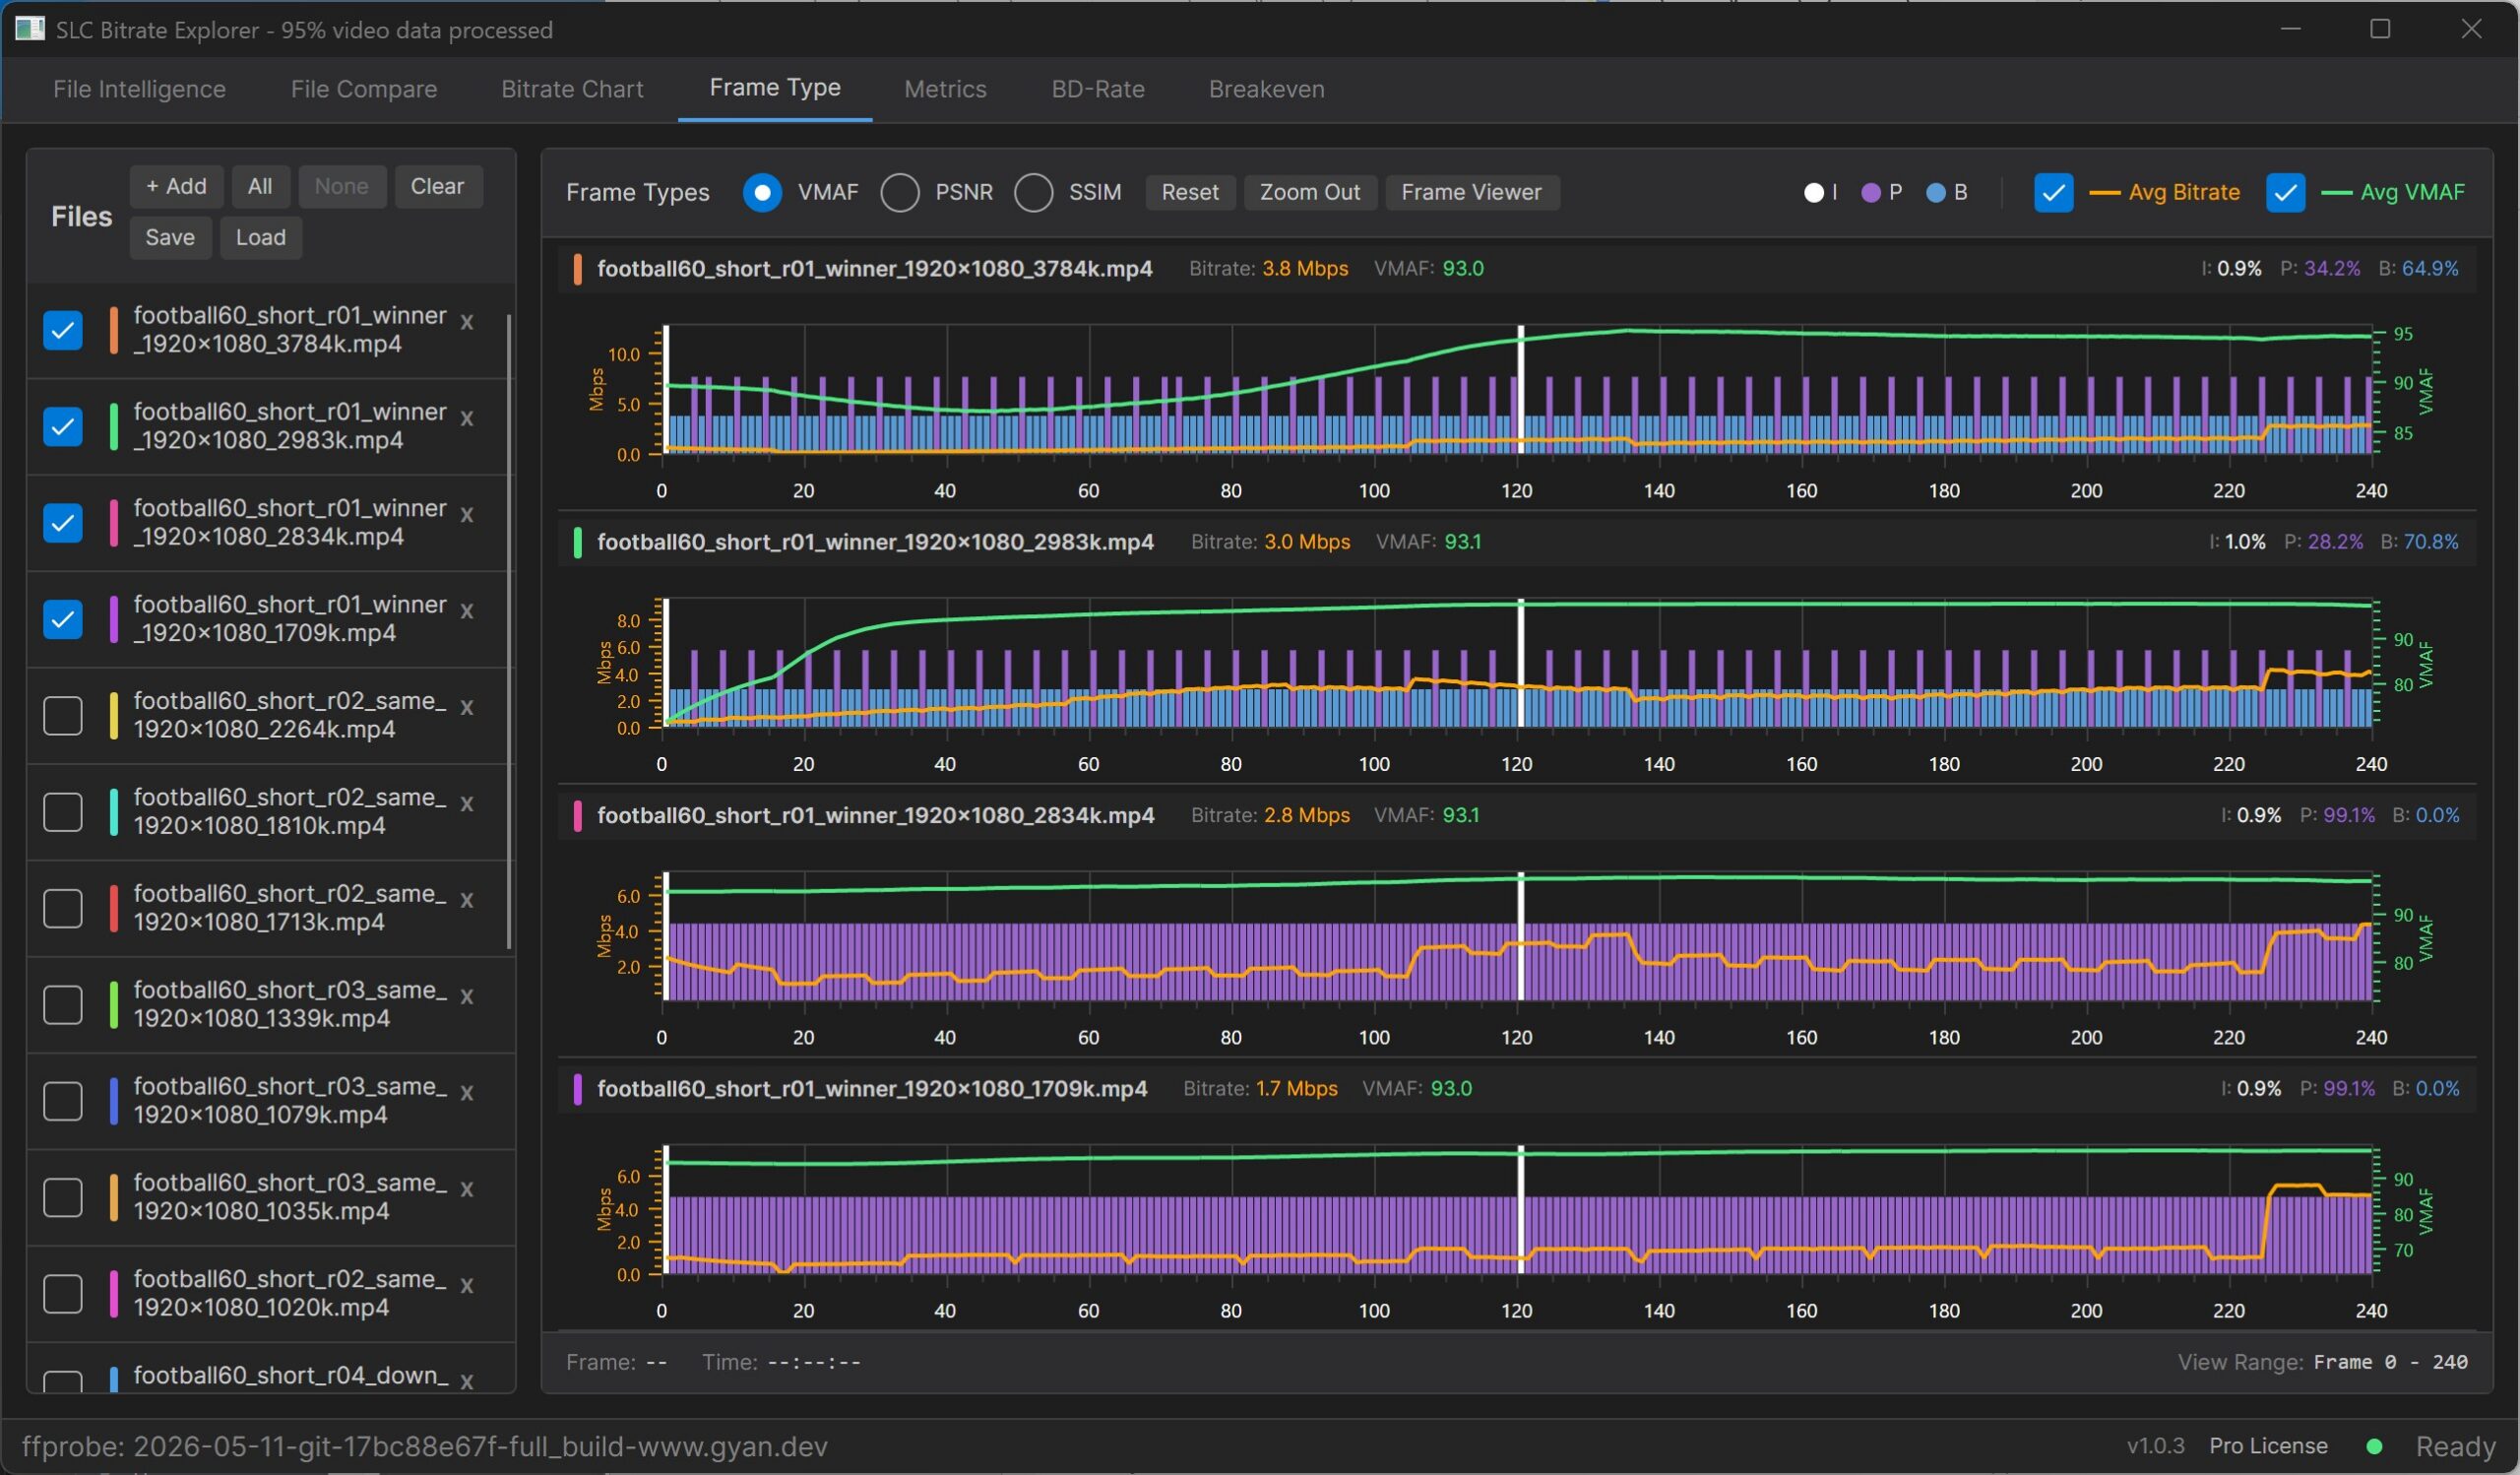
H.264 and HEVC have an explicit B-frame frame type in their bitstream syntax. When the encoder uses bidirectional prediction, the bitstream marks the frame as B and FFprobe reports it. SBE shows it.
VP9 doesn’t have a B-frame type in its bitstream. It uses alternate reference frames, which are hidden frames future frames can reference, and compound prediction modes inside frames the bitstream classifies as P. A VP9 encode using bidirectional prediction extensively still shows zero B-frames in any tool reading the bitstream classification.
AV1 is the same shape. AV1 defines KEY_FRAME and INTER_FRAME, with no distinct B-frame type. SVT-AV1 defaults to multi-level hierarchical reference structures functionally similar to H.264 pyramid B-frame patterns, but the frames are labeled INTER_FRAME (P) at the bitstream level.
So all four codecs use bidirectional temporal prediction on this content. Two of them surface it via the frame-type field; the other two do so via prediction-mode mechanisms that FFprobe doesn’t currently expose.
The next SBE release adds hidden-frame detection (VP9 altrefs, AV1 frames with show_frame=0) and hierarchical reference level per frame, which will make the VP9 and AV1 columns directly comparable to H.264 and HEVC.
For now, read I/P/B percentages directly across H.264 and HEVC, and treat them as single-codec only for VP9 and AV1.
Measure VMAF, PSNR, and SSIM – Metrics
The Metrics tab computes VMAF, PSNR, and SSIM against the source reference in a single pass, with per-frame curves for each metric. Results are verified to within 0.01% of MSU VQMT. You can switch between metrics with the radio buttons without re-running, export to Markdown for reports or CSV for further analysis, and jump directly into Frame Viewer to investigate any frame of interest.
Figure 5 shows the per-frame VMAF curves for the four top rungs. Averages: H.264 93.0, HEVC 93.1, VP9 93.1, AV1 93.0, confirming the matched top-rung quality. Note the poor quality at the start of the x265 encode, which is very common with x265. If you’re testing 5-10 second clips, the ultra-low quality at the start significantly impacts your average score, though you wouldn’t be aware of it without a view like this.
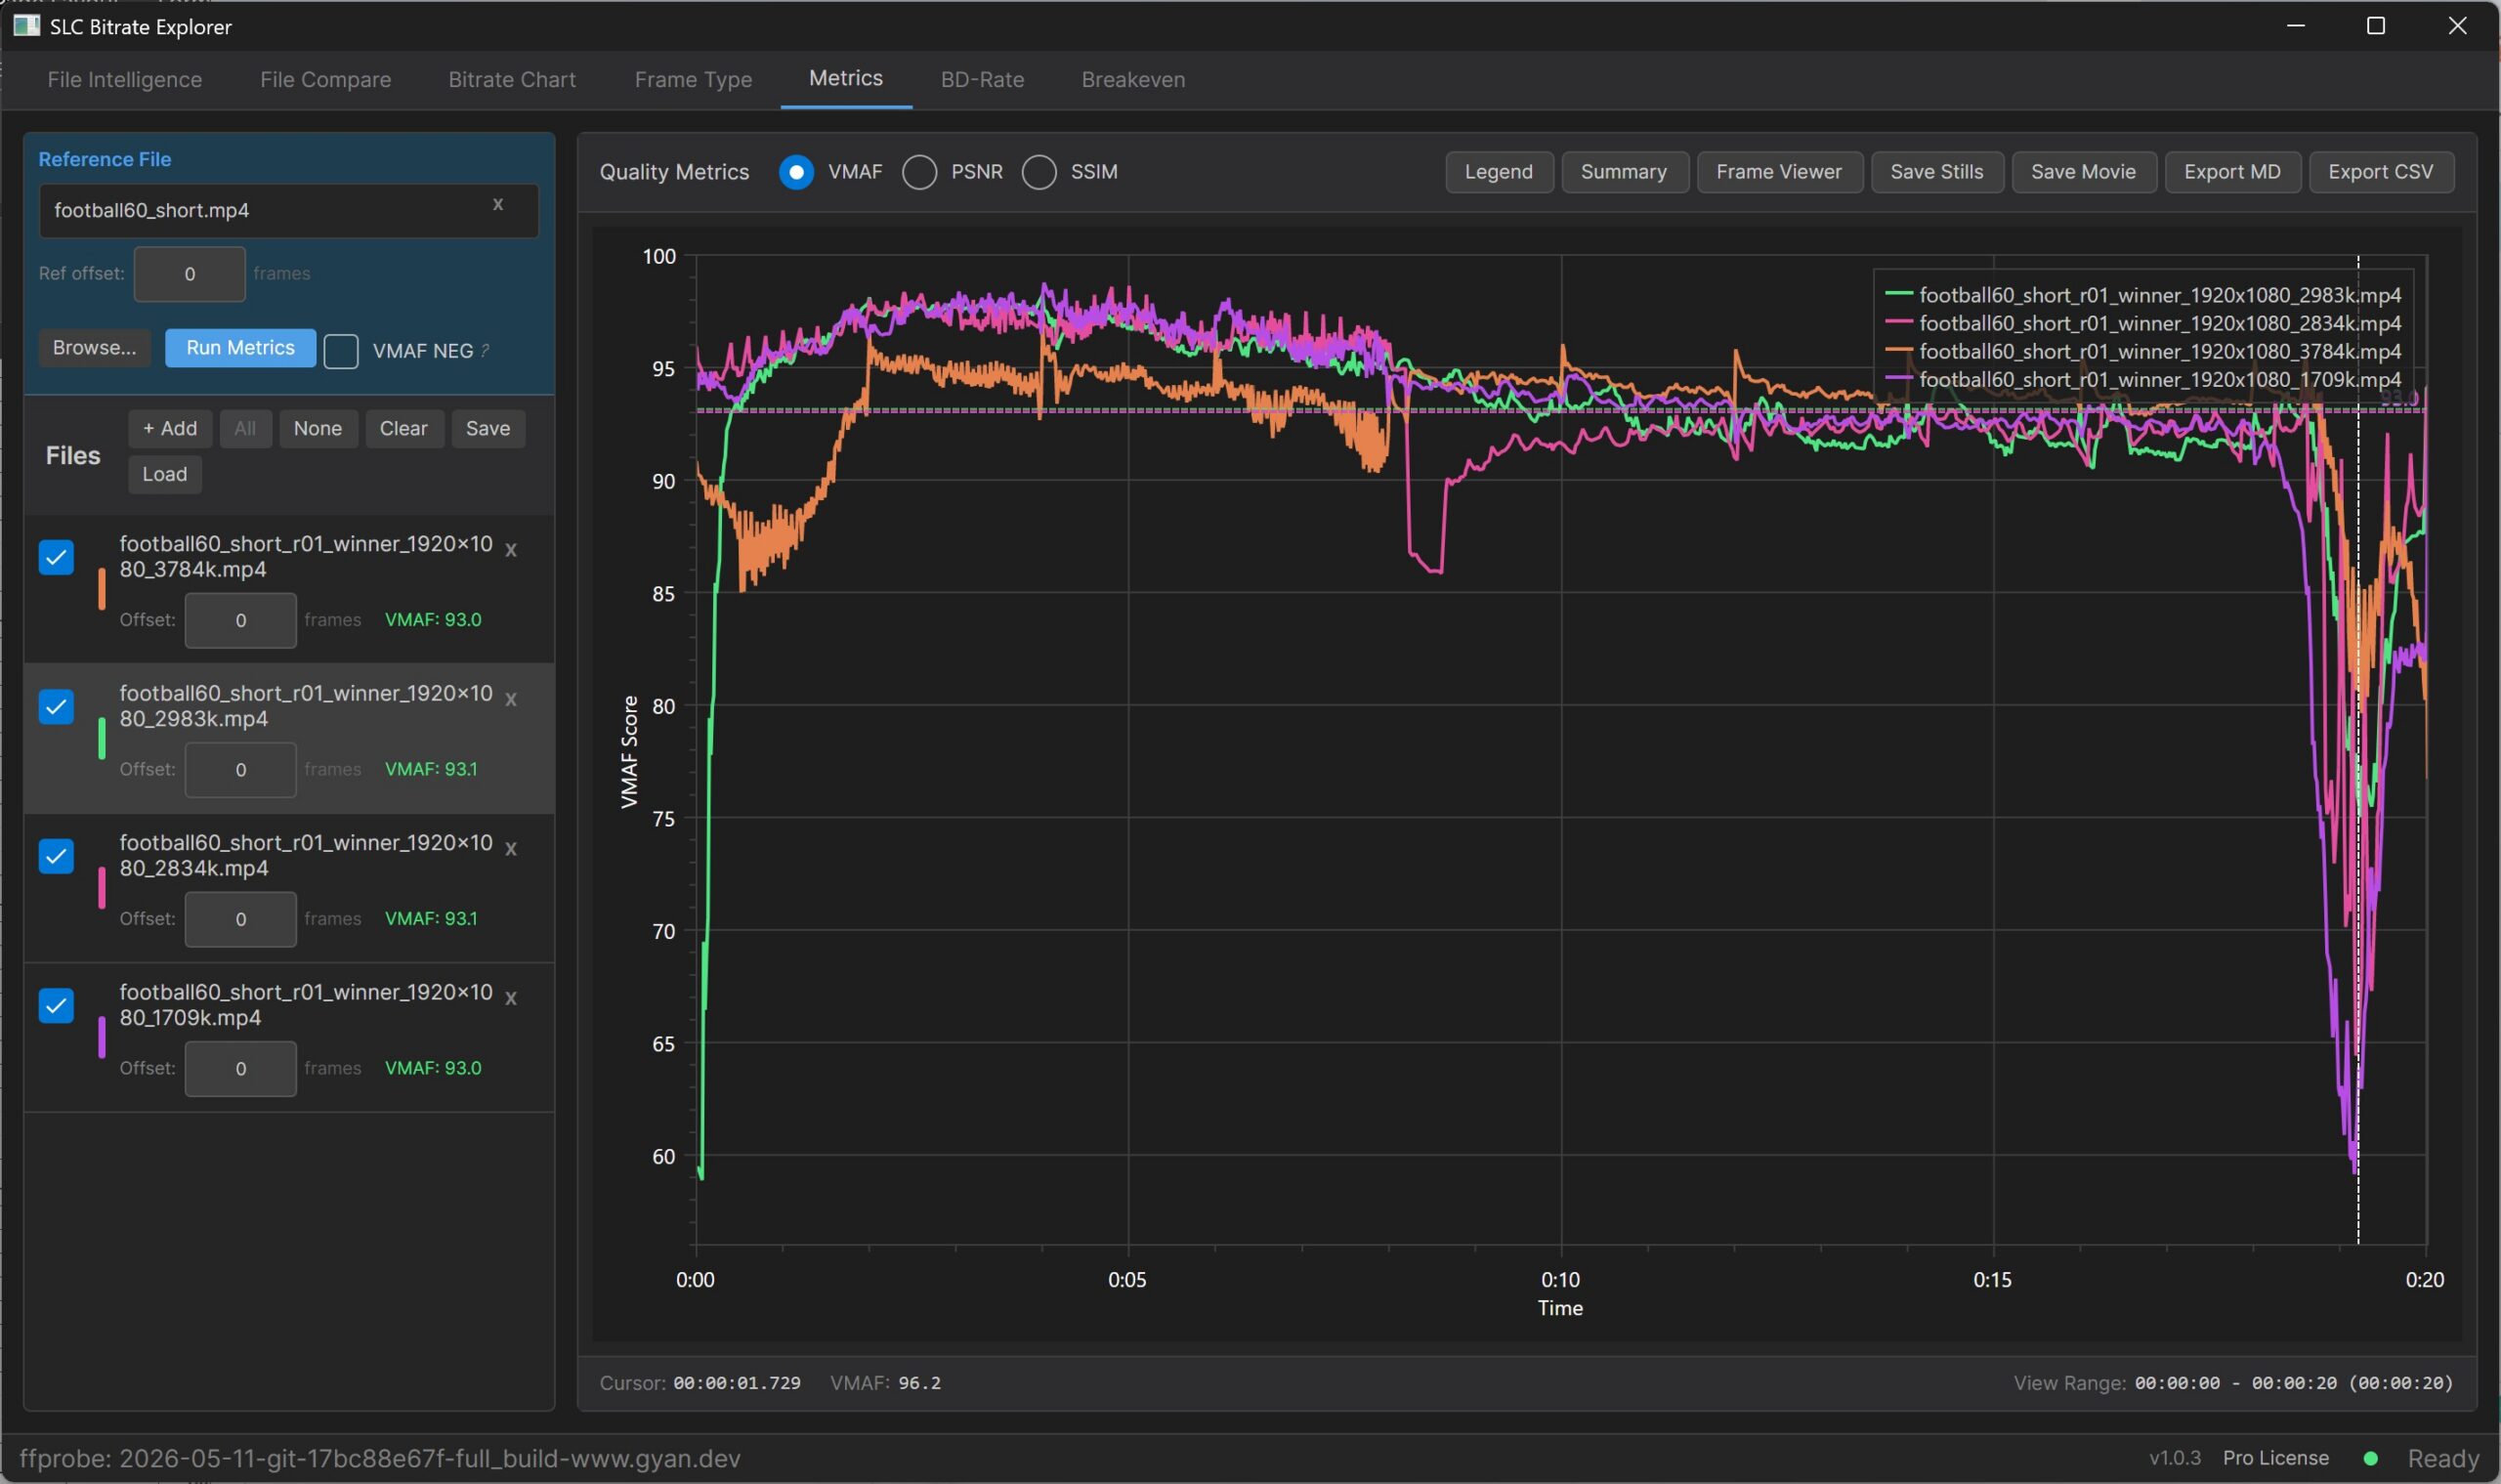
Note the shared dip near 0:19. All four codecs lose quality at the same moment, in roughly the same magnitude. That’s a sanity check that the dip is a hard moment in the source content, not a codec-specific failure. But a metric drop into the high 60s is exactly where averages stop helping. Is it perceptually significant, or noise, that the metric is over-reporting?
This is where Frame Viewer excels. Click into the dip on any of the four files, and SBE opens the still frame in the Frame Viewer window (Figure 6), with the mini chart below tracking your position. From there, you can navigate frame by frame, switch between any of the loaded files with the dropdown in the upper right or a keyboard shortcut, hit play to view at normal speed (or 0.5×, 2×, 3×), and switch between encodes mid-playback. The mini chart can show bitrate, frame type, or any of the three metrics, synced to the current frame.
Figure 6 shows Frame 1154 at 19.25s on the HEVC top rung at the bottom of the dip.
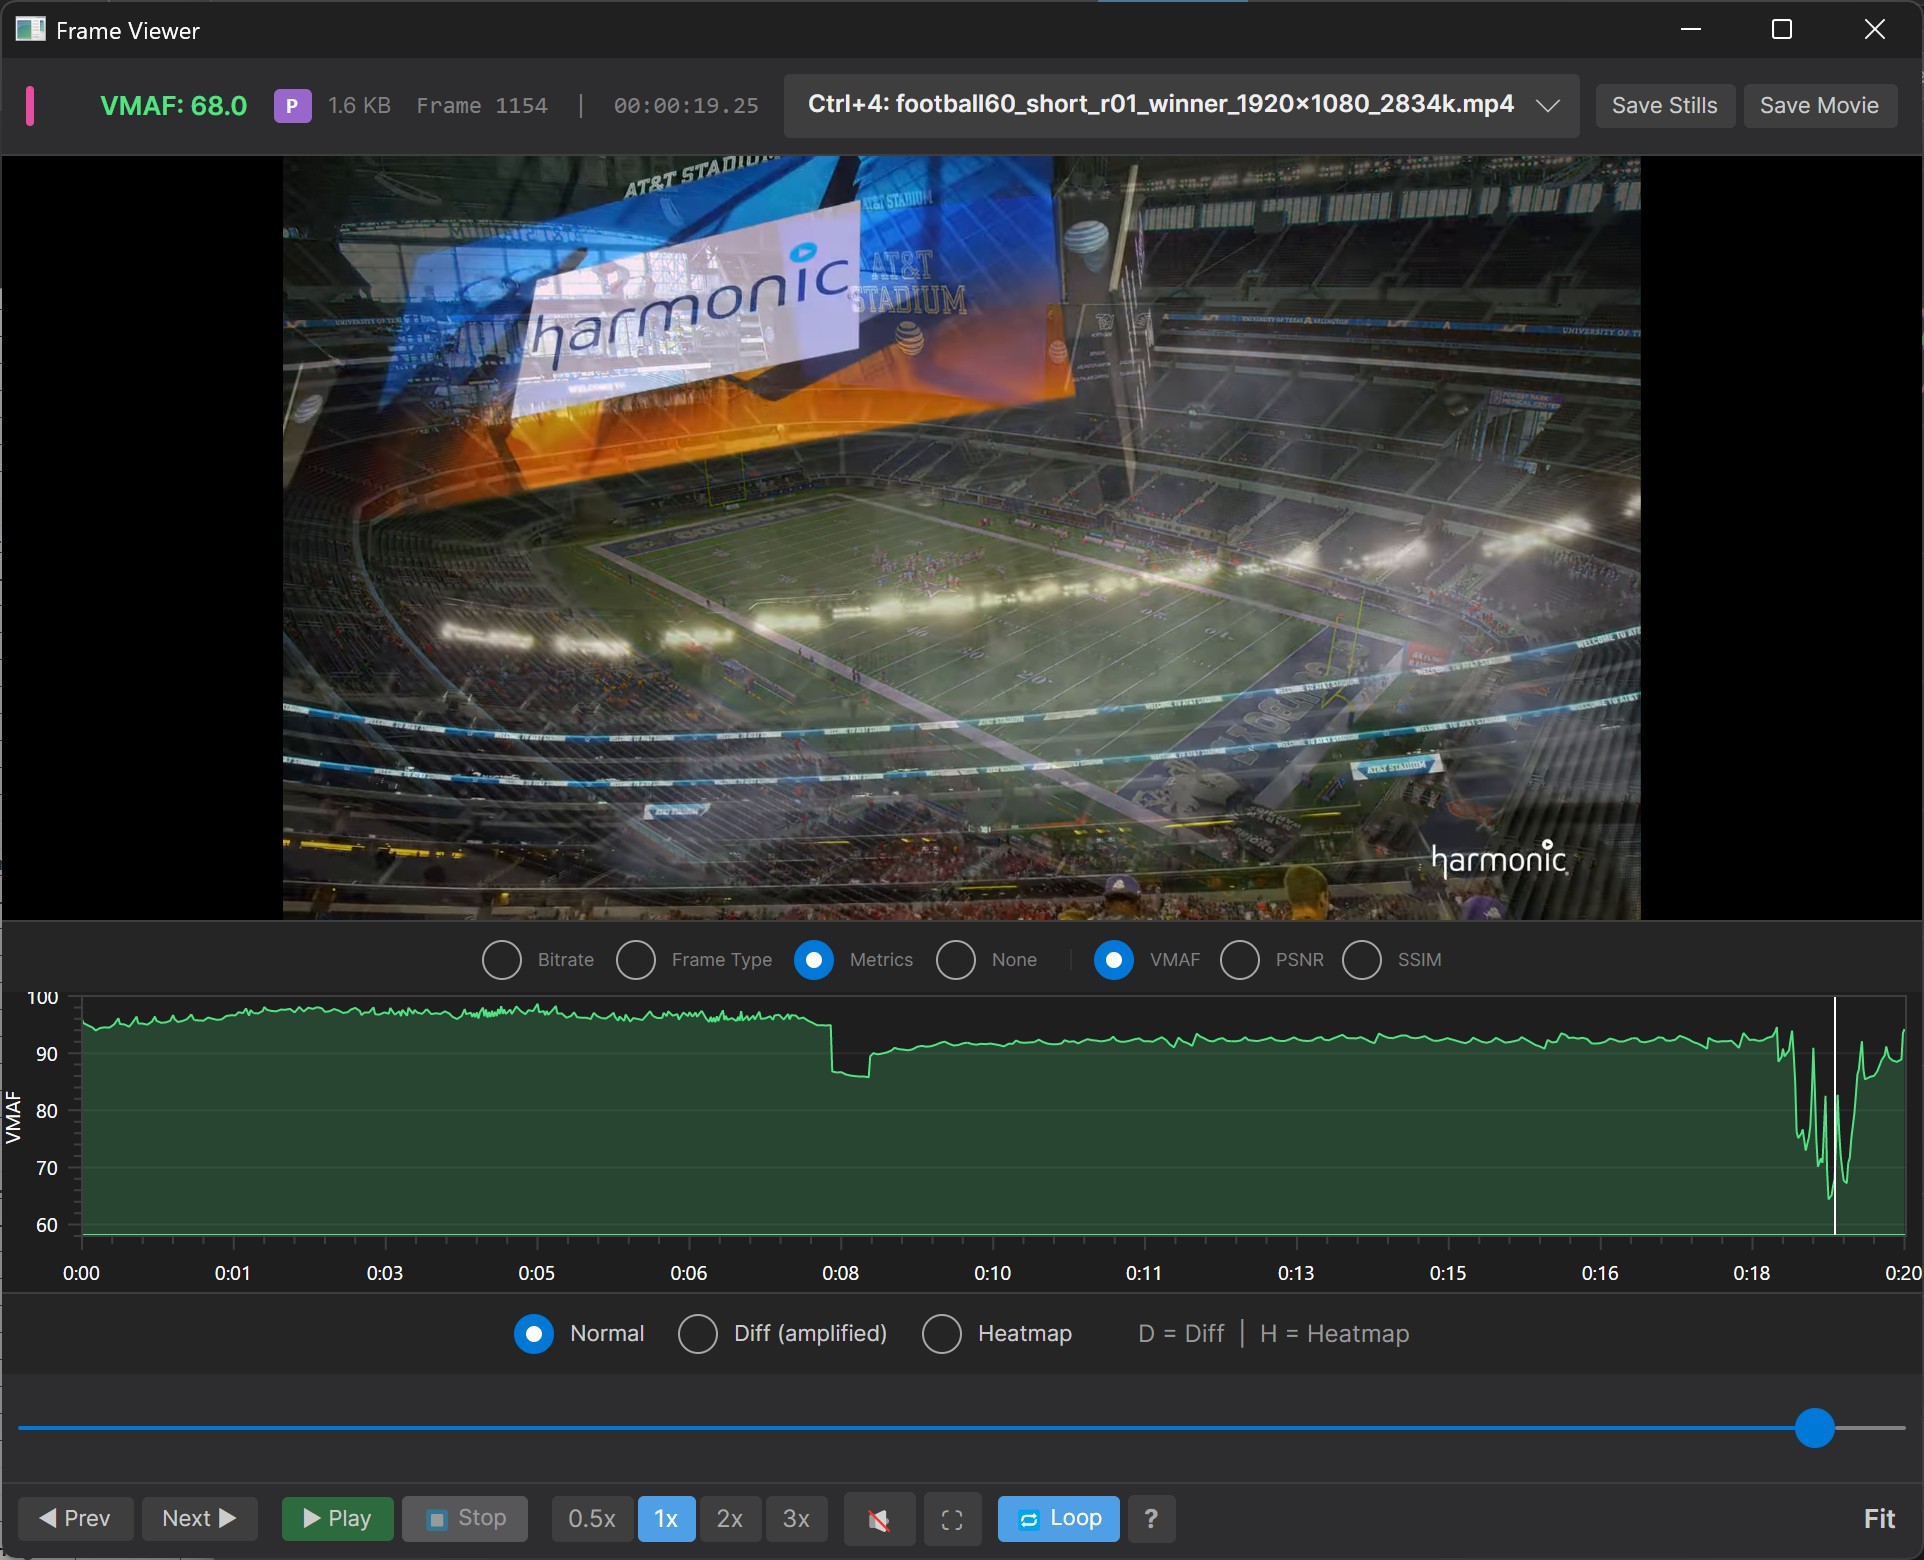
The frame is in the middle of a video transition with motion blur on the dissolving graphic. VMAF doesn’t score graphics transitions well, so it reports low scores on frames that viewers wouldn’t notice. A/B playback against the source confirms it; you can swap between the reference, the HEVC encode, and the AV1 encode during playback, and the dip is invisible to the eye.
This is the part of the workflow that hasn’t really existed before. MSU VQMT enables frame-level still comparison on Windows, but not on Mac, and no video playback on either. In fact, I’m not aware of any tool that enables real-time A/B video playback against a reference, with keyboard-shortcut switching between encodes mid-playback and a metric chart synced to the current frame. If you’ve ever tried to verify whether a VMAF score corresponded to a real perceptual issue and ended up screen-grabbing frames into Photoshop, you know why this matters.
BD-Rate
The BD-Rate tab is next. Bjøntegaard Delta Rate is the definitive measure of codec efficiency, computing how much bitrate one codec needs to deliver the same quality as another, averaged across the full rate-distortion curve. Building it in Excel with the standard plugin is a multi-hour project the first time, and an hour or two each subsequent time, which is why most practitioners skip it. SBE processing times depend on the number of files included, their duration, and the type of machine you’re running on. SBE processed the 19 20-second files shown in this analysis in under 5 minutes on a $2,000 HP Workstation, with results verified using the Excel plugin.
To run BD-Rate comparisons, load your reference, drag in the encode ladders, and SBE groups files by codec from the metadata. For non-codec comparisons, like preset variants, single- vs multi-pass, CRF ladders, you can tag manually. Press Calculate to get the RD curves and the BD-Rate matrix.
Figure 7 shows the result.
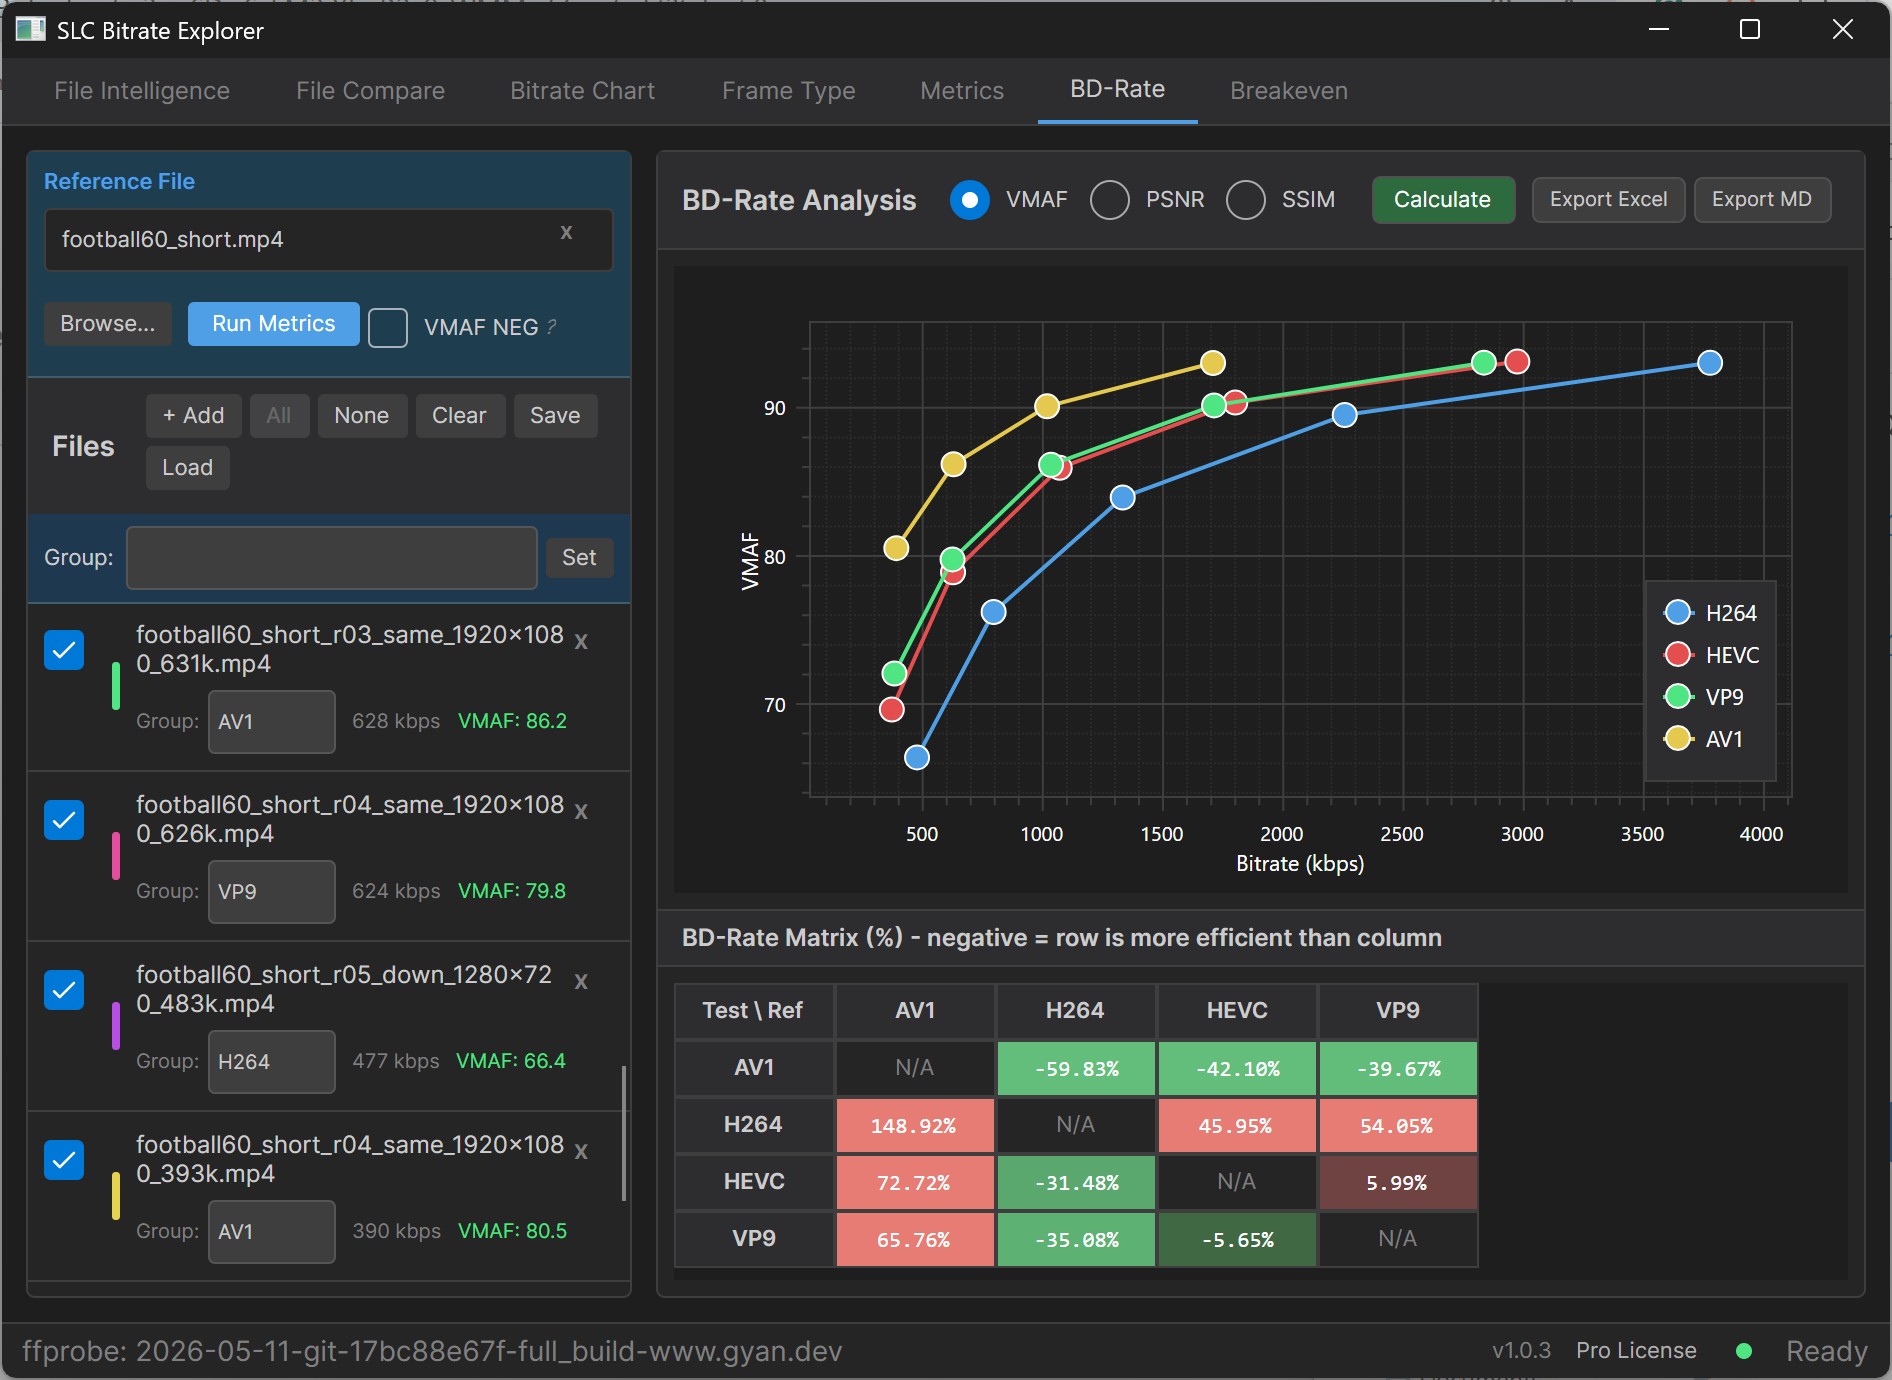
The matrix reads row codec vs column codec. Negative values mean the row codec is more efficient, so it needs less bitrate to deliver the same quality across the ladder. Like the Excel plug-in, green is good, red is bad. Against H.264 as the baseline:
- AV1: -59.83% (AV1 can produce the same quality at roughly 60% less bitrate than H.264)
- VP9: -35.08%
- HEVC: -31.48%
- VP9 vs HEVC: -5.65%
VP9 is marginally more efficient than HEVC on this content. That ordering can flip on other content, which is a feature of BD-Rate rather than a bug; worth running on multiple sources before drawing a general conclusion about either codec.
OK, so you know the relative efficiency of the codecs. Does that mean AV1 is the best codec in all instances? What if it costs 8x more to encode? What if the file will only be viewed 1,000 times? What if your distribution pattern slants more towards mobile viewers than SmartTVs? What if your distribution cost is $0.08/GB or $0.005/GB?
Knowing which codec is more efficient is miles away from understanding if and when it makes economic sense to deploy that codec. Ditto for encoding-related decisions like multiple-pass vs single-pass, the very slow preset vs. the medium preset, or eight reference frames vs one reference frame. All of these decisions trade off quality against encoding and distribution costs, and if you don’t incorporate these costs into the decision, it lacks critical context.
This is what the Breakeven tab provides.
Here’s a video showing how BD-Rate operates.
Breakeven
The Breakeven tab takes the BD-Rate result and adds the cost side: encoding cost premium, time to break-even, net dollars over the period, and (under an audience distribution) the increase or decrease in quality each codec actually delivers to the viewer.
The relationship between BD-Rate and audience-weighted break-even is important for interpreting the numbers. BD-Rate measures the average bitrate savings across the entire shared ladder. It’s a number that doesn’t exist in the real world. You don’t distribute at all shared points; you distribute a fixed number of rungs that are played by viewers connecting at multiple different connection speeds.
You’d get close to the BD-Rate savings if you distributed all rungs equally, but most services aren’t close to this. Some are top-heavy with higher concentrations of the top higher-quality rungs. Others are mobile-centric with distributions focused in the mid and lower rungs. If you attempt to use BD-Rate averages to predict real-world savings, you’ll find significant variance that increases the more your actual distribution patterns differ from the average.
You’ll see this in the three examples below that measure savings: 1) using the BD-Rate data, 2) using a top-heavy distribution pattern, and 3) using a mobile distribution pattern.
All three computations share the following inputs: CDN cost: $0.02/GB; baseline encoding cost: $5/hour; encoding cost multipliers (AV1: 4x, HEVC: 2x, VP9: 1.5x); projected viewing hours: 250,000.
Figure 8 shows the default view, which are the BD-Rate average numbers with no audience distribution applied. You can tell this because the Apply audience distribution checkbox in the upper-left corner of the Breakeven tab is unchecked.
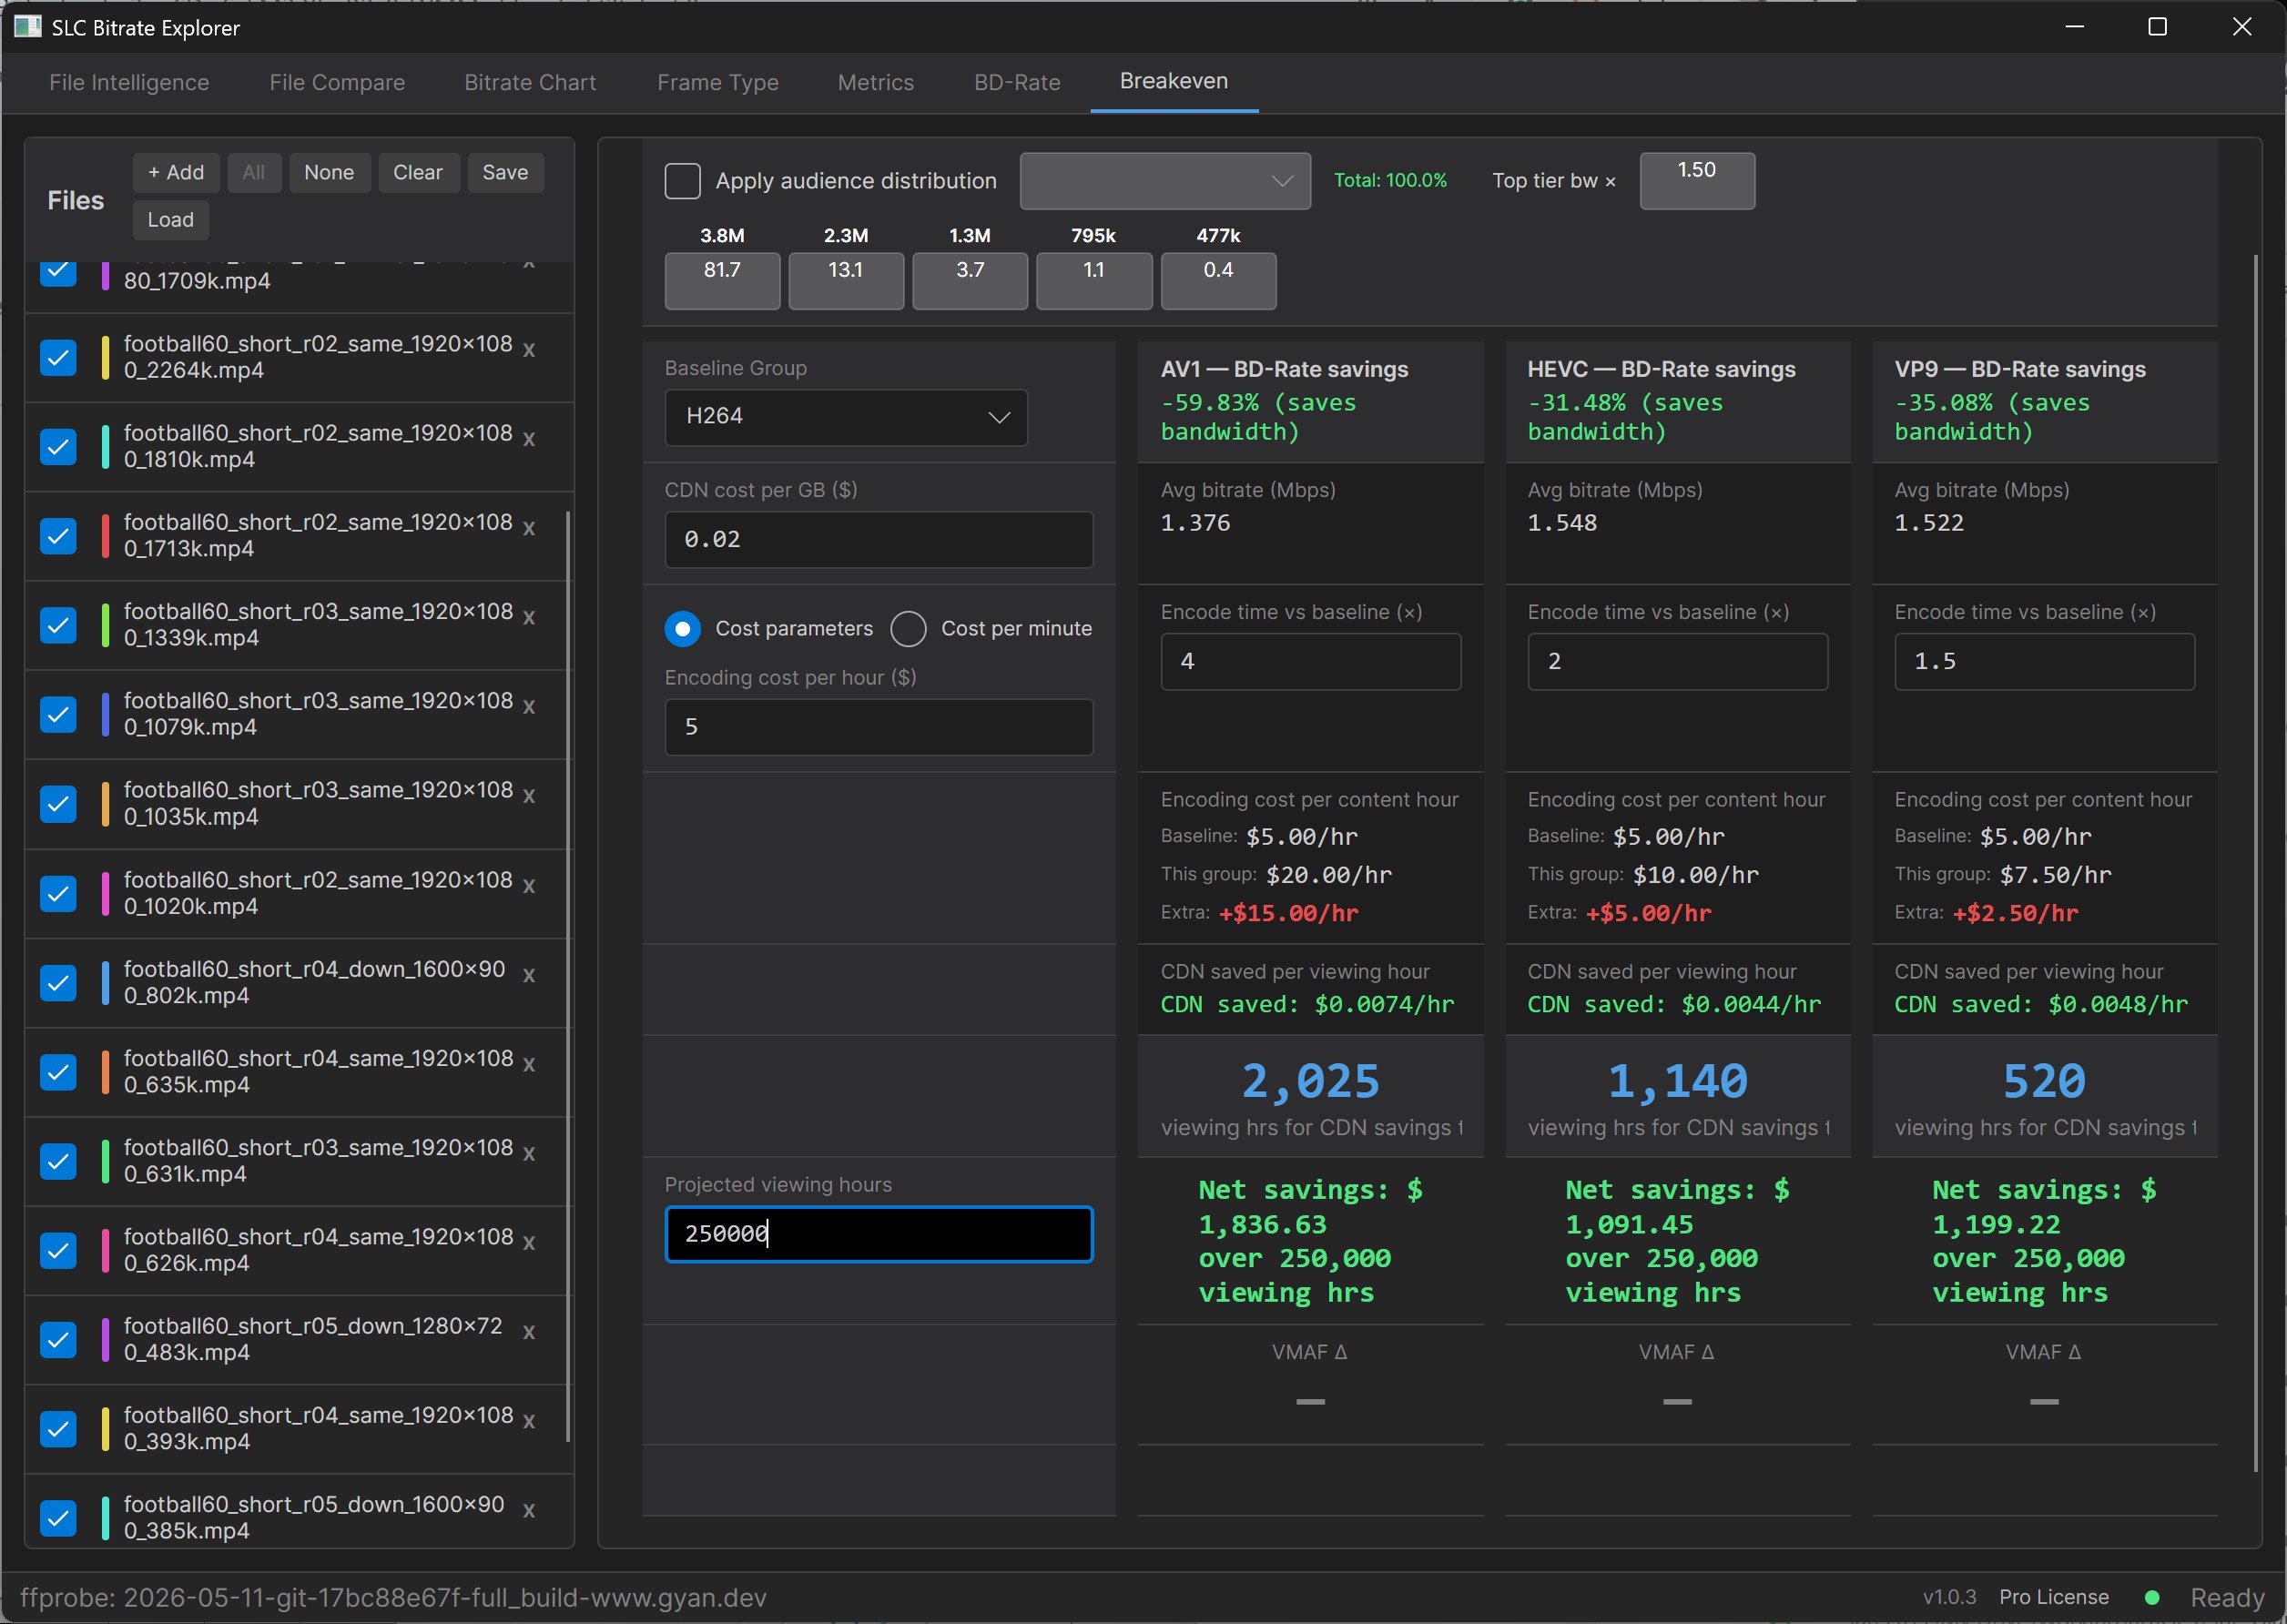
Here are the results using the default BD-Rate values:
- Efficiency over H.264 (the BD-Rate result): AV1 -59.83%, VP9 -35.08%, HEVC -31.48%.
- Break-even hours: VP9 520, HEVC 1,140, AV1 2,025.
- Net savings over 250k viewing hours: AV1 $1,836, VP9 $1,199, HEVC $1,091.
- VMAF change: blank. BD-Rate computes the savings at the same quality by definition, so there’s no quality delta to report.
This view shows the relationship between bandwidth savings and encoding cost premium. AV1 saves the most bandwidth per hour but requires the most viewing hours to recoup its 4x encoding cost. VP9’s 1.5x multiplier means it reaches profitability four times faster than AV1, even though it saves much less bandwidth per hour. Below a few thousand viewing hours, AV1’s encoding premium hasn’t been amortized, and the only codec actually making money is VP9.
Figure 9 applies a top-heavy distribution, with 81.7% of viewing on the 3.8 Mbps top rung. That’s a premium-tier viewing profile. You see the Apply audience distribution checkbox is checked, and the average bitrate has changed to reflect the distribution pattern.
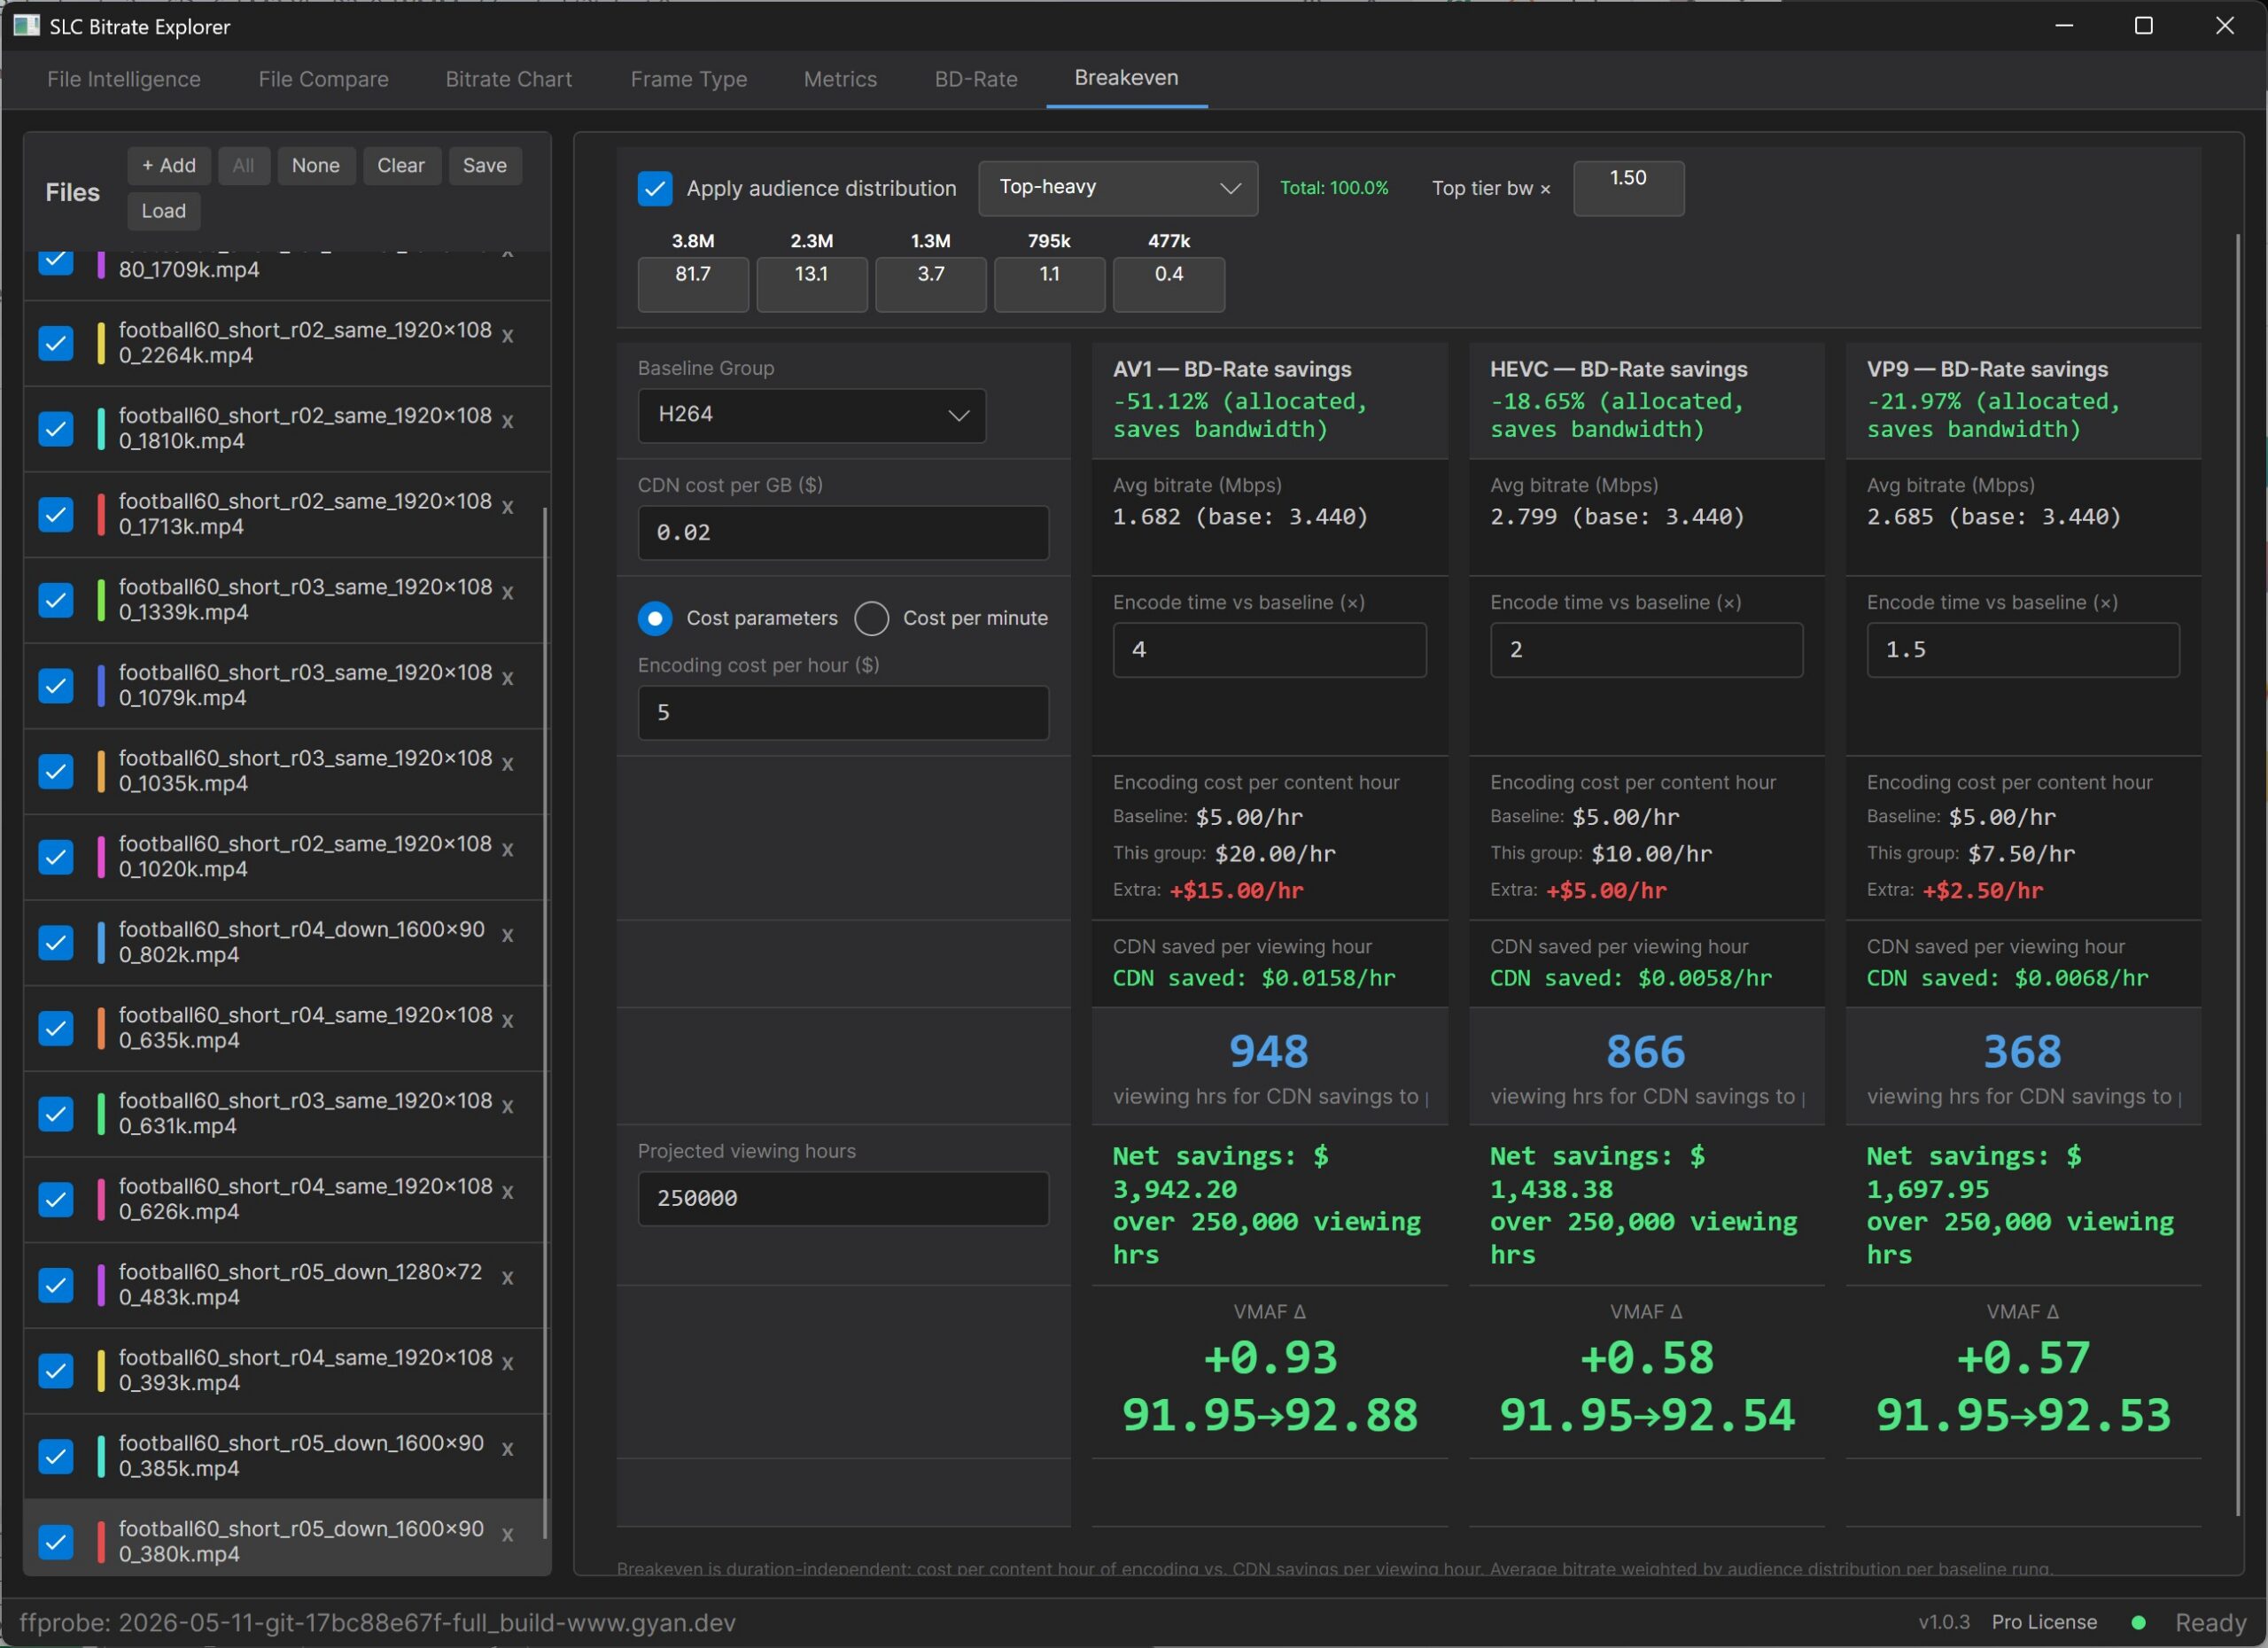
Here are the results using the top-heavy distribution pattern:
- Efficiency over H.264: AV1 -51.12%, VP9 -21.97%, HEVC -18.65%. Each codec is less efficient at this audience-weighted bitrate than its BD-Rate average across the full ladder.
- Break-even hours: VP9 368, HEVC 866, AV1 948.
- Net savings over 250k viewing hours: AV1 $3,942, VP9 $1,697, HEVC $1,438. Dollar numbers go up despite lower percentages because more absolute bandwidth is in motion at premium-tier viewing volume.
- VMAF change: AV1 +0.93, VP9 +0.57, HEVC +0.58. Small deltas. Premium content sits near the top of the quality curve where all four codecs converge, so the codec choice mostly buys bandwidth efficiency rather than quality lift.
The view tells us that audience volume amplifies absolute dollar savings even when percentage savings shrink. AV1’s net dollars more than double the no-distribution case, and VP9’s break-even drops to 368 hours. At a premium service with significant viewing volume, AV1 produces the largest absolute return. At smaller premium audiences, VP9 may pay back faster and net more total dollars.
Figure 10 shifts to a mobile-centric distribution, with viewing weighted toward the lower rungs of the ladder.
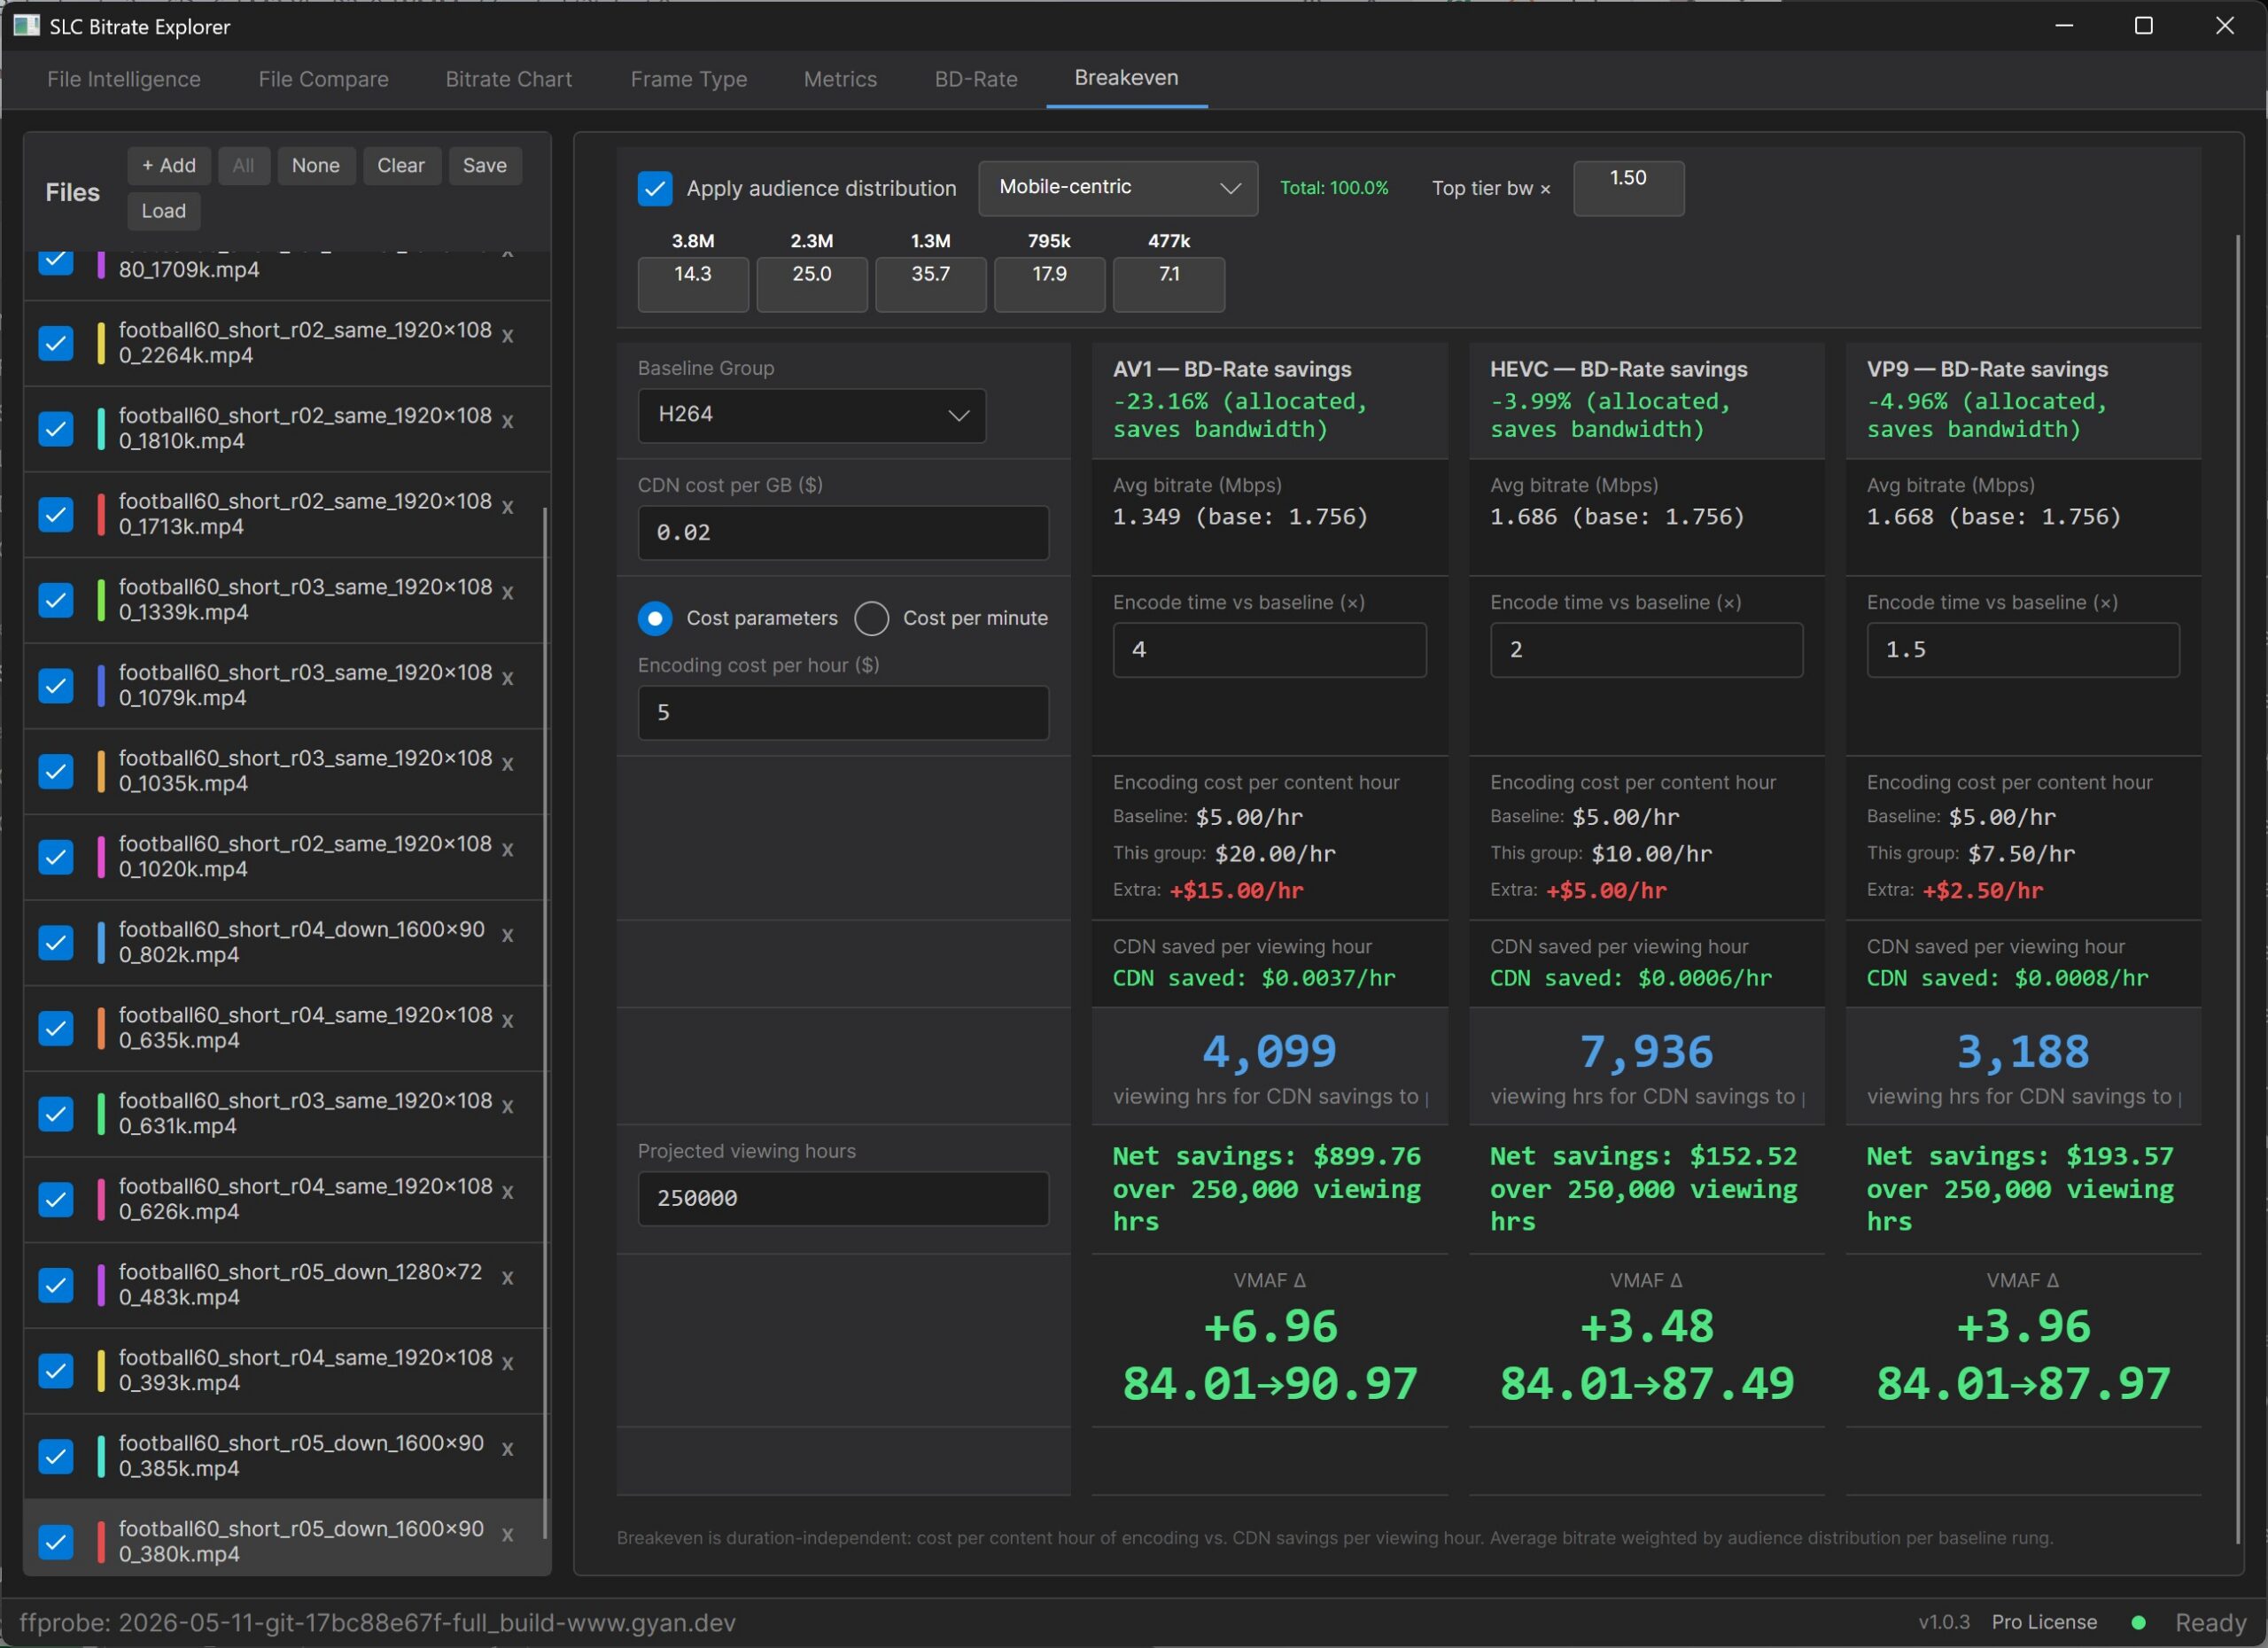
Here are the results using the mobile distribution pattern:
- Efficiency over H.264: AV1 -23.16%, VP9 -4.96%, HEVC -3.99%. Each codec is much less efficient at this audience-weighted bitrate than its BD-Rate average.
- Break-even hours: VP9 3,188, AV1 4,099, HEVC 7,936.
- Net savings over 250k viewing hours: AV1 $899, VP9 $194, HEVC $152.
- VMAF change: AV1 +6.96, VP9 +3.96, HEVC +3.48. H.264’s audience-weighted VMAF is 84.01 at this distribution. AV1 brings it to 90.97, VP9 to 87.97, HEVC to 87.49.
This view shows that, at constrained bitrates for mobile-centric content, codec efficiency appears more as a quality lift than as a bandwidth reduction. AV1’s bandwidth savings shrink to 23%, but it delivers nearly +7 VMAF over the H.264 baseline. The deployment question on this audience profile isn’t mostly about saving bandwidth. It’s about whether your viewers see 84 VMAF or 91 VMAF.
The three codecs offer different deployment recommendations across three axes.
- Audience volume. Below VP9’s break-even point, no codec is making money. VP9 is the only one paying back fast enough to matter at a small scale, because its encoding cost premium is low enough that even thin bandwidth savings cover it.
- Audience distribution. Premium-tier viewing makes the choice mostly a matter of bandwidth efficiency, because the codecs converge near the top of the quality curve. In contrast, mobile-centric viewing makes it about quality delivered at constrained bitrates, because that’s where the codecs diverge.
- Optimization target. If you’re optimizing for absolute dollars at scale, AV1 produces the highest return across all three distributions. If you’re optimizing for fastest payback, VP9 reaches it first in every distribution. If you’re optimizing for QoE on mobile-centric content, AV1 again, because the +7 VMAF lift is large enough to justify the encoding premium at any reasonable audience size.
HEVC gets squeezed on every distribution at this content profile: less bandwidth savings than VP9, less quality lift than VP9, longer break-even than VP9, and less net dollars than VP9. There’s an audience and a content type where HEVC is still the right answer, but it isn’t this one.
This is the analysis the field has been doing by hand in custom spreadsheets, or skipping entirely. Having it in the same window as the BD-Rate that feeds it is what turns “which codec is more efficient” into “which codec is right for our deployment, our audience, and our quality target.”
Here’s a video showing the Breakeven tab in operation.
Wrapping up
The findings from this comparison:
- AV1 produced a file less than half the size of H.264 at matched VMAF (4.1 MB vs 9.0 MB)
- The shared metric dip at 0:19 turned out to be a sponsor overlay transition — perceptually clean once you A/B against the source in Frame Viewer
- BD-Rate ranking: AV1 ~60% more efficient than H.264, HEVC ~31%, VP9 ~35%, with VP9 marginally outperforming HEVC on this content
- Codec ranking depends on audience distribution. HEVC nearly stops being worth the encoding cost on a mobile-centric audience
BD-Rate provides only general guidance and little meaningful insight into the economic impact of your encoding decisions. To recommend a new codec, or even a simple change in encoding configuration, you need to understand the return on investment it provides, given your encoding ladder, your distribution pattern, and your encoding and distribution cost structure. Before that, you need to verify that the metrics underpinning the BD-Rate calculations are accurate, which means comparing still-image and real-time playback.
SBE delivers a comprehensive, integrated toolset that lets you elevate your analysis and recommendations from generic BD-Rate to contextual ROI. It’s the only available tool that enables real-time playback comparisons and the only one that allows you to comprehend and present the economic impact of your encoding-related decisions.
SLC Bitrate Explorer is free for a full 14-day trial. After the trial, File Intelligence, File Compare, Bitrate Chart, and still-frame Frame Viewer stay in the free tier. Metrics, BD-Rate, Frame Viewer video playback, and the Break-even Calculator are Pro at $109.99 once. SBE is available on Windows, Intel Mac, and Apple Silicon.