Streaming Learning Center Where Streaming Professionals Learn to Excel

Related Articles


Developing a metrics tool is the easy part. Wire up FFmpeg, shell out to libvmaf, parse the JSON, draw a pretty line chart. It’s a weekend project, and the part they show you at vibe-coding camp.
The part they don’t show you are the edge cases: the files that are a frame short, the variable frame rates that quietly drift, the mismatched timebases. And the one we want to talk about today: the file that looks completely normal, plays perfectly, and silently throws your quality score off by forty points.
That’s the vibe coding reality that no one realizes on the way in. Edge cases are the ones that take hours, days, or even weeks to resolve and make up the difference between a pretty science project and a useful tool.
Contents
Job Number 1: get the numbers right
My tool is Streaming Learning Center Bitrate Explorer, or SBE, and its core function is computing metrics, specifically VMAF, PSNR, and SSIM. Our ground truth is Moscow State University’s Video Quality Measurement Tool (VQMT), so when our scores diverge by more than a tenth of a point or two on scaled files, we stop and figure out why.
Fortunately, there have been fewer and fewer issues until this weekend.
The symptom
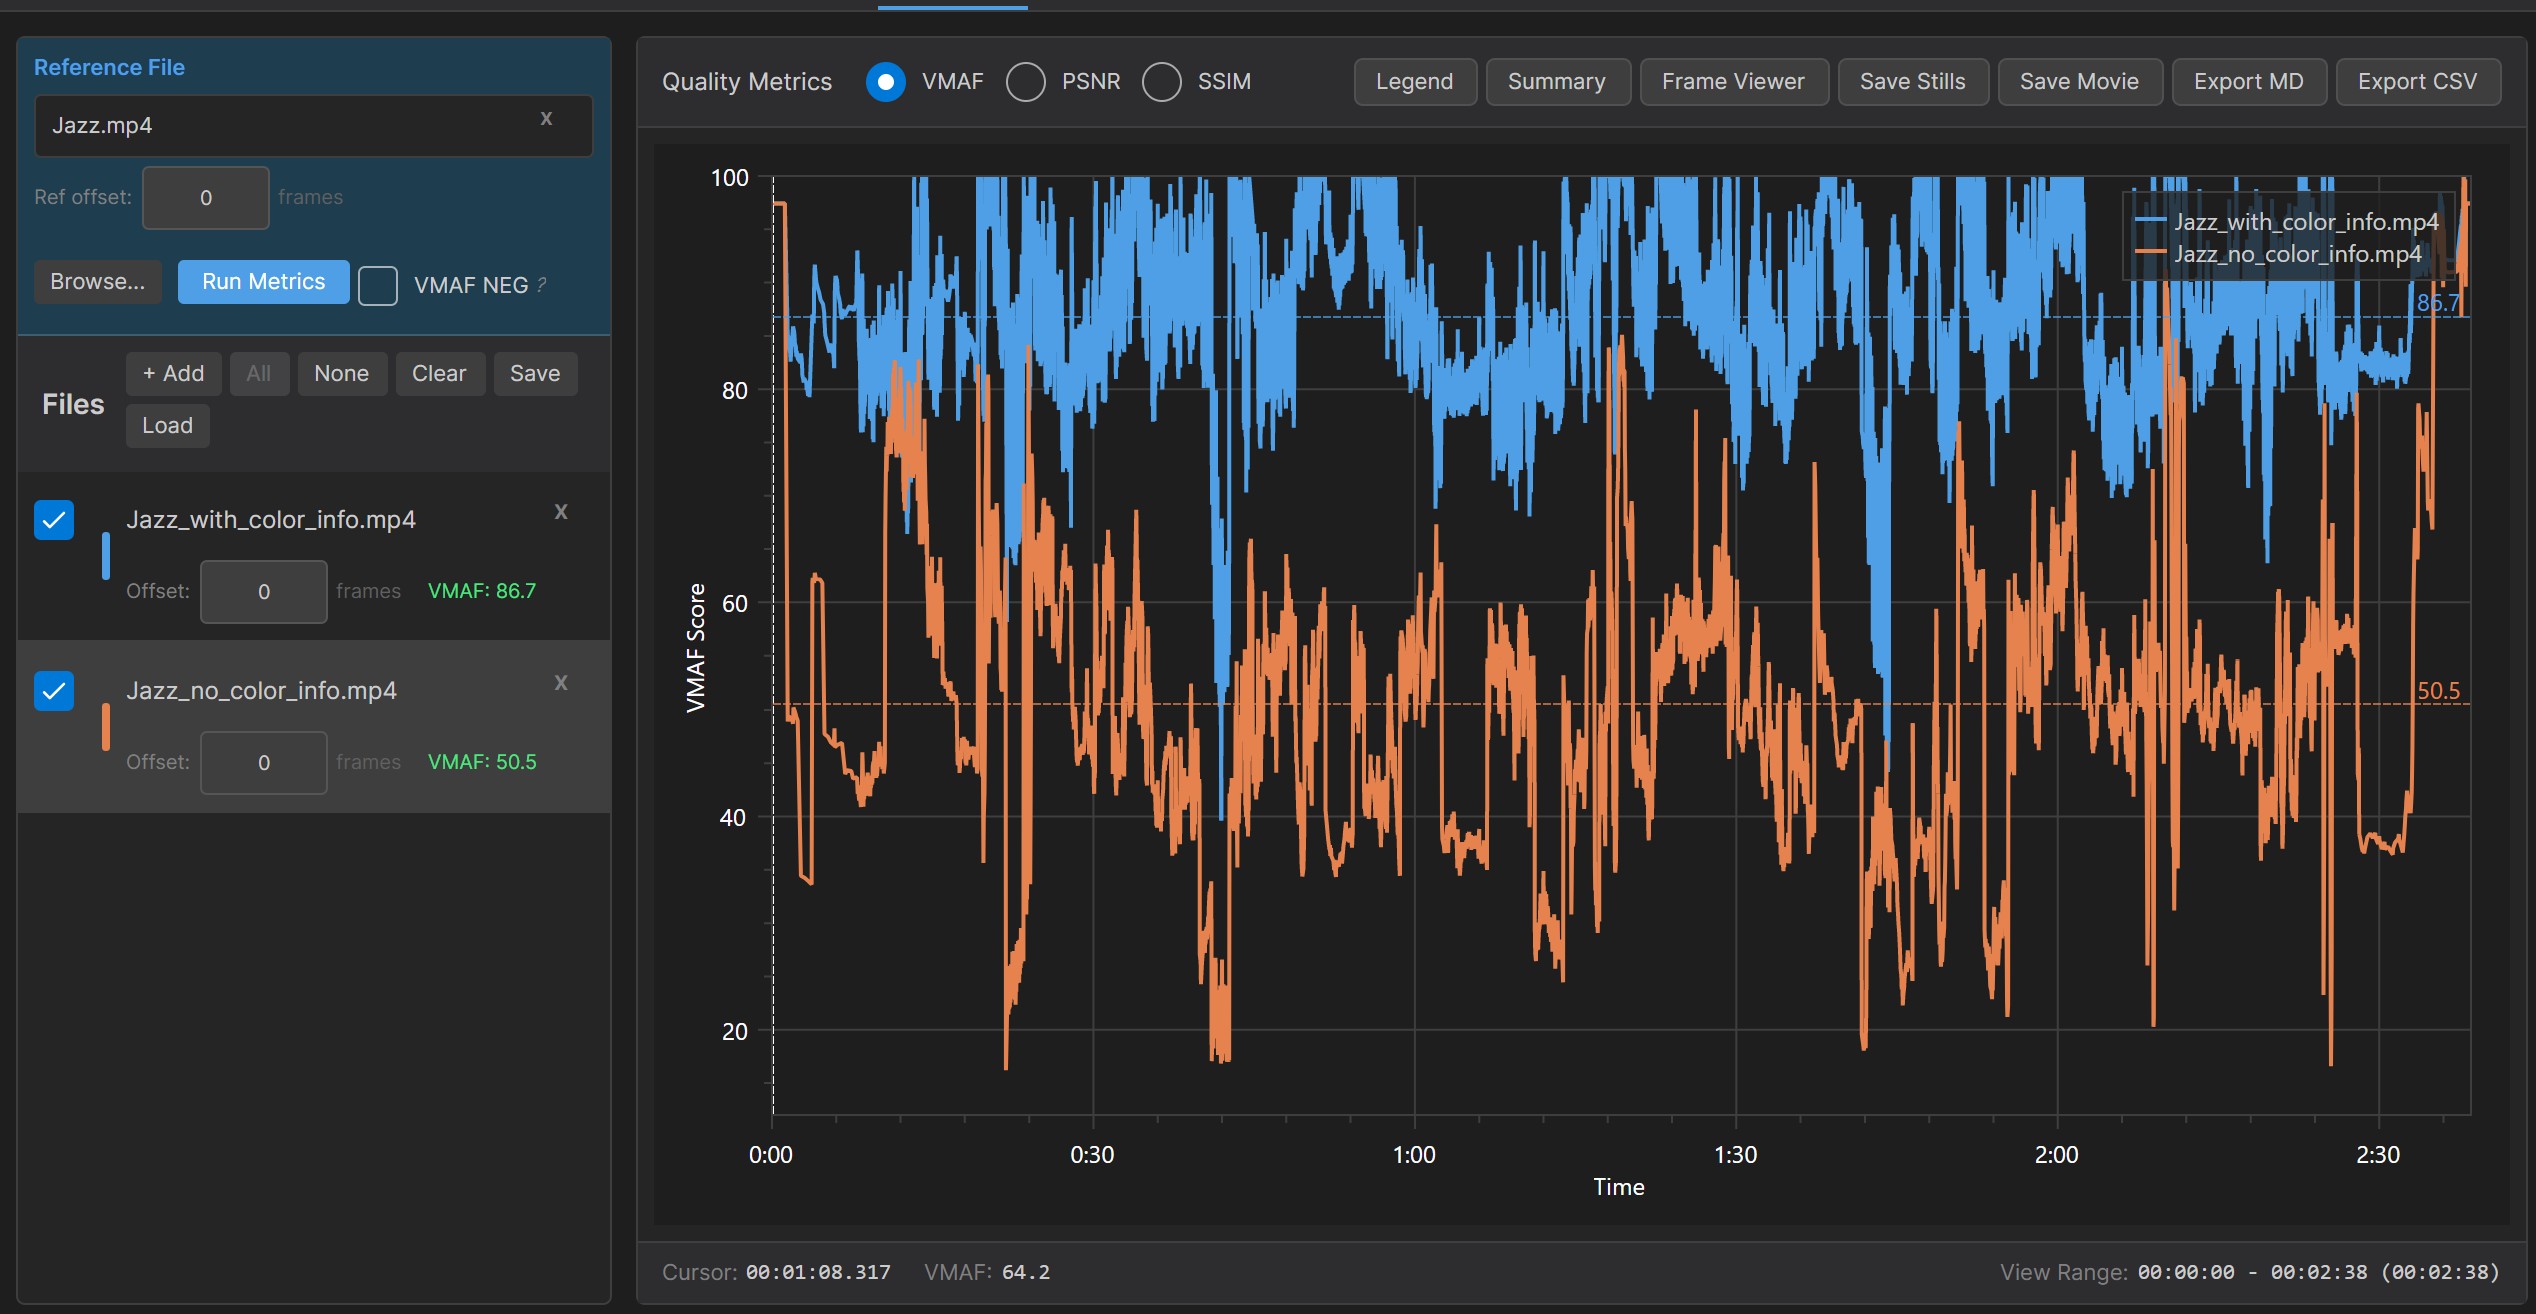
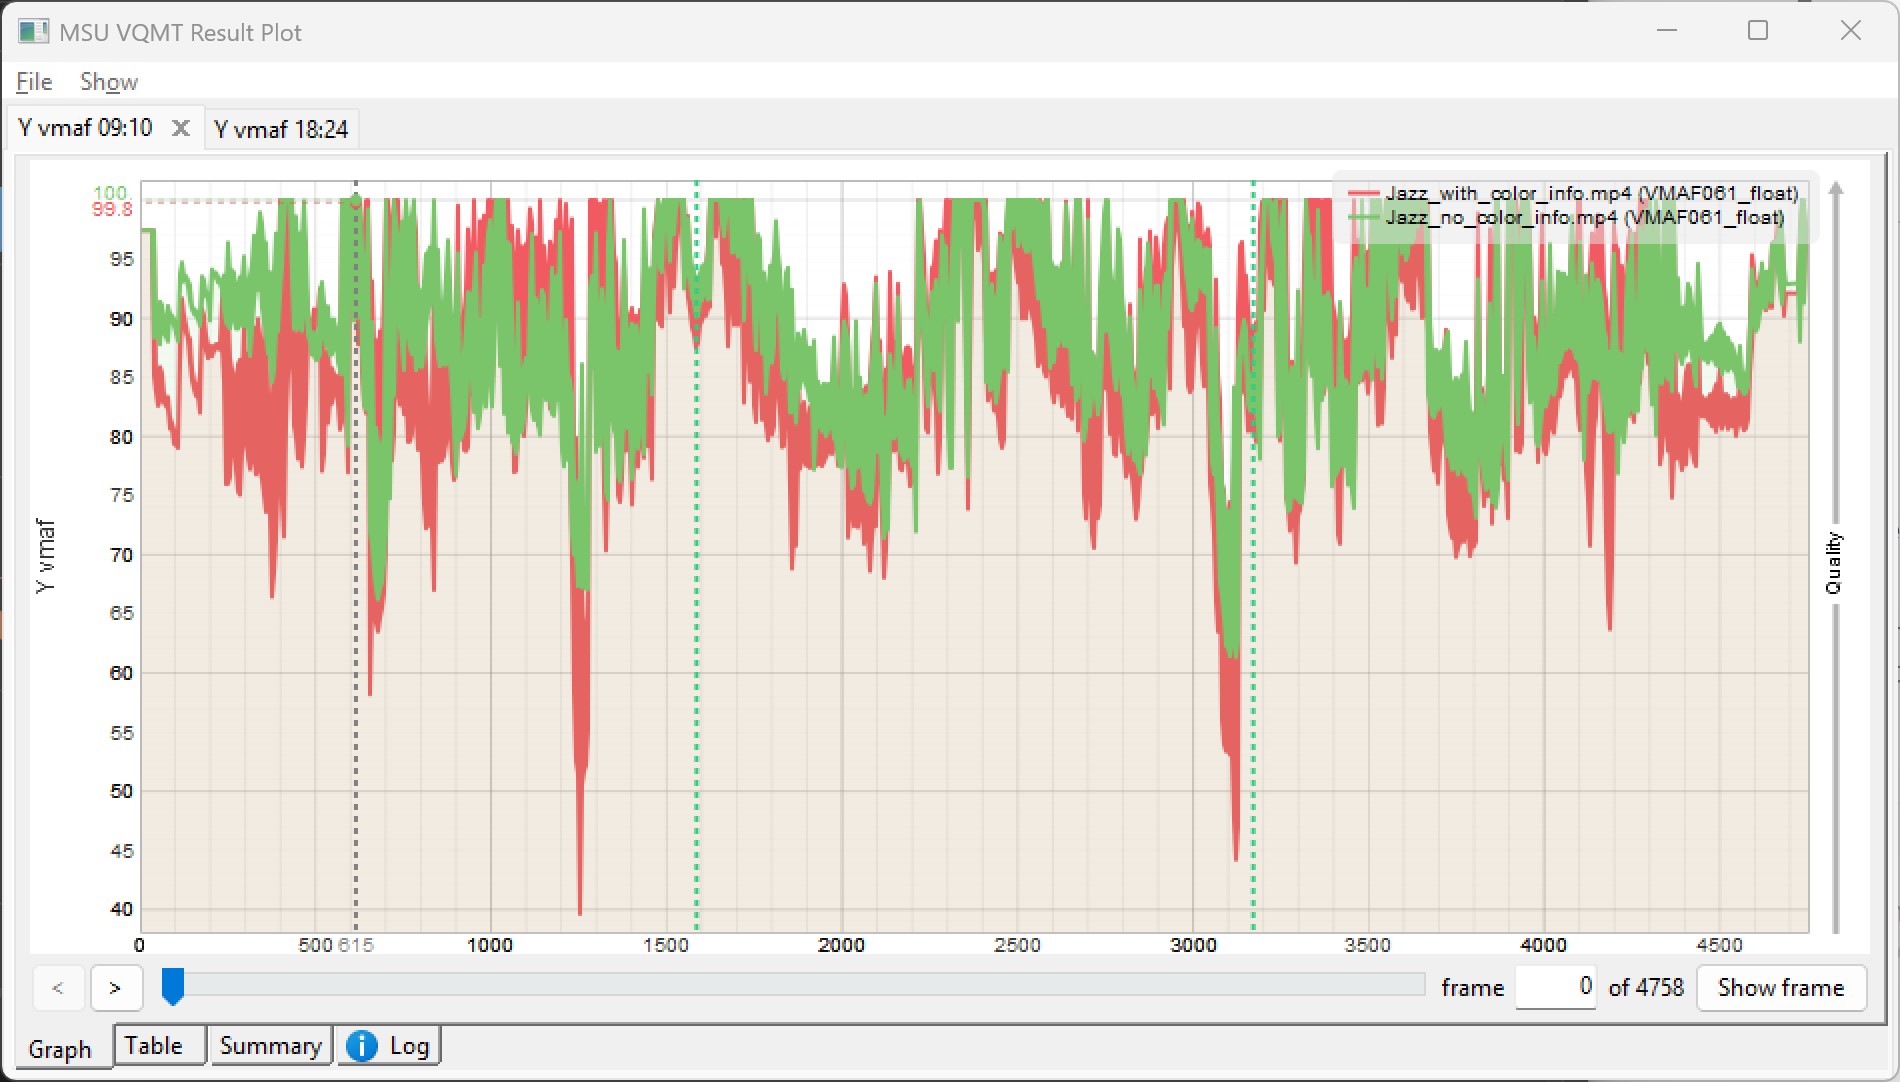
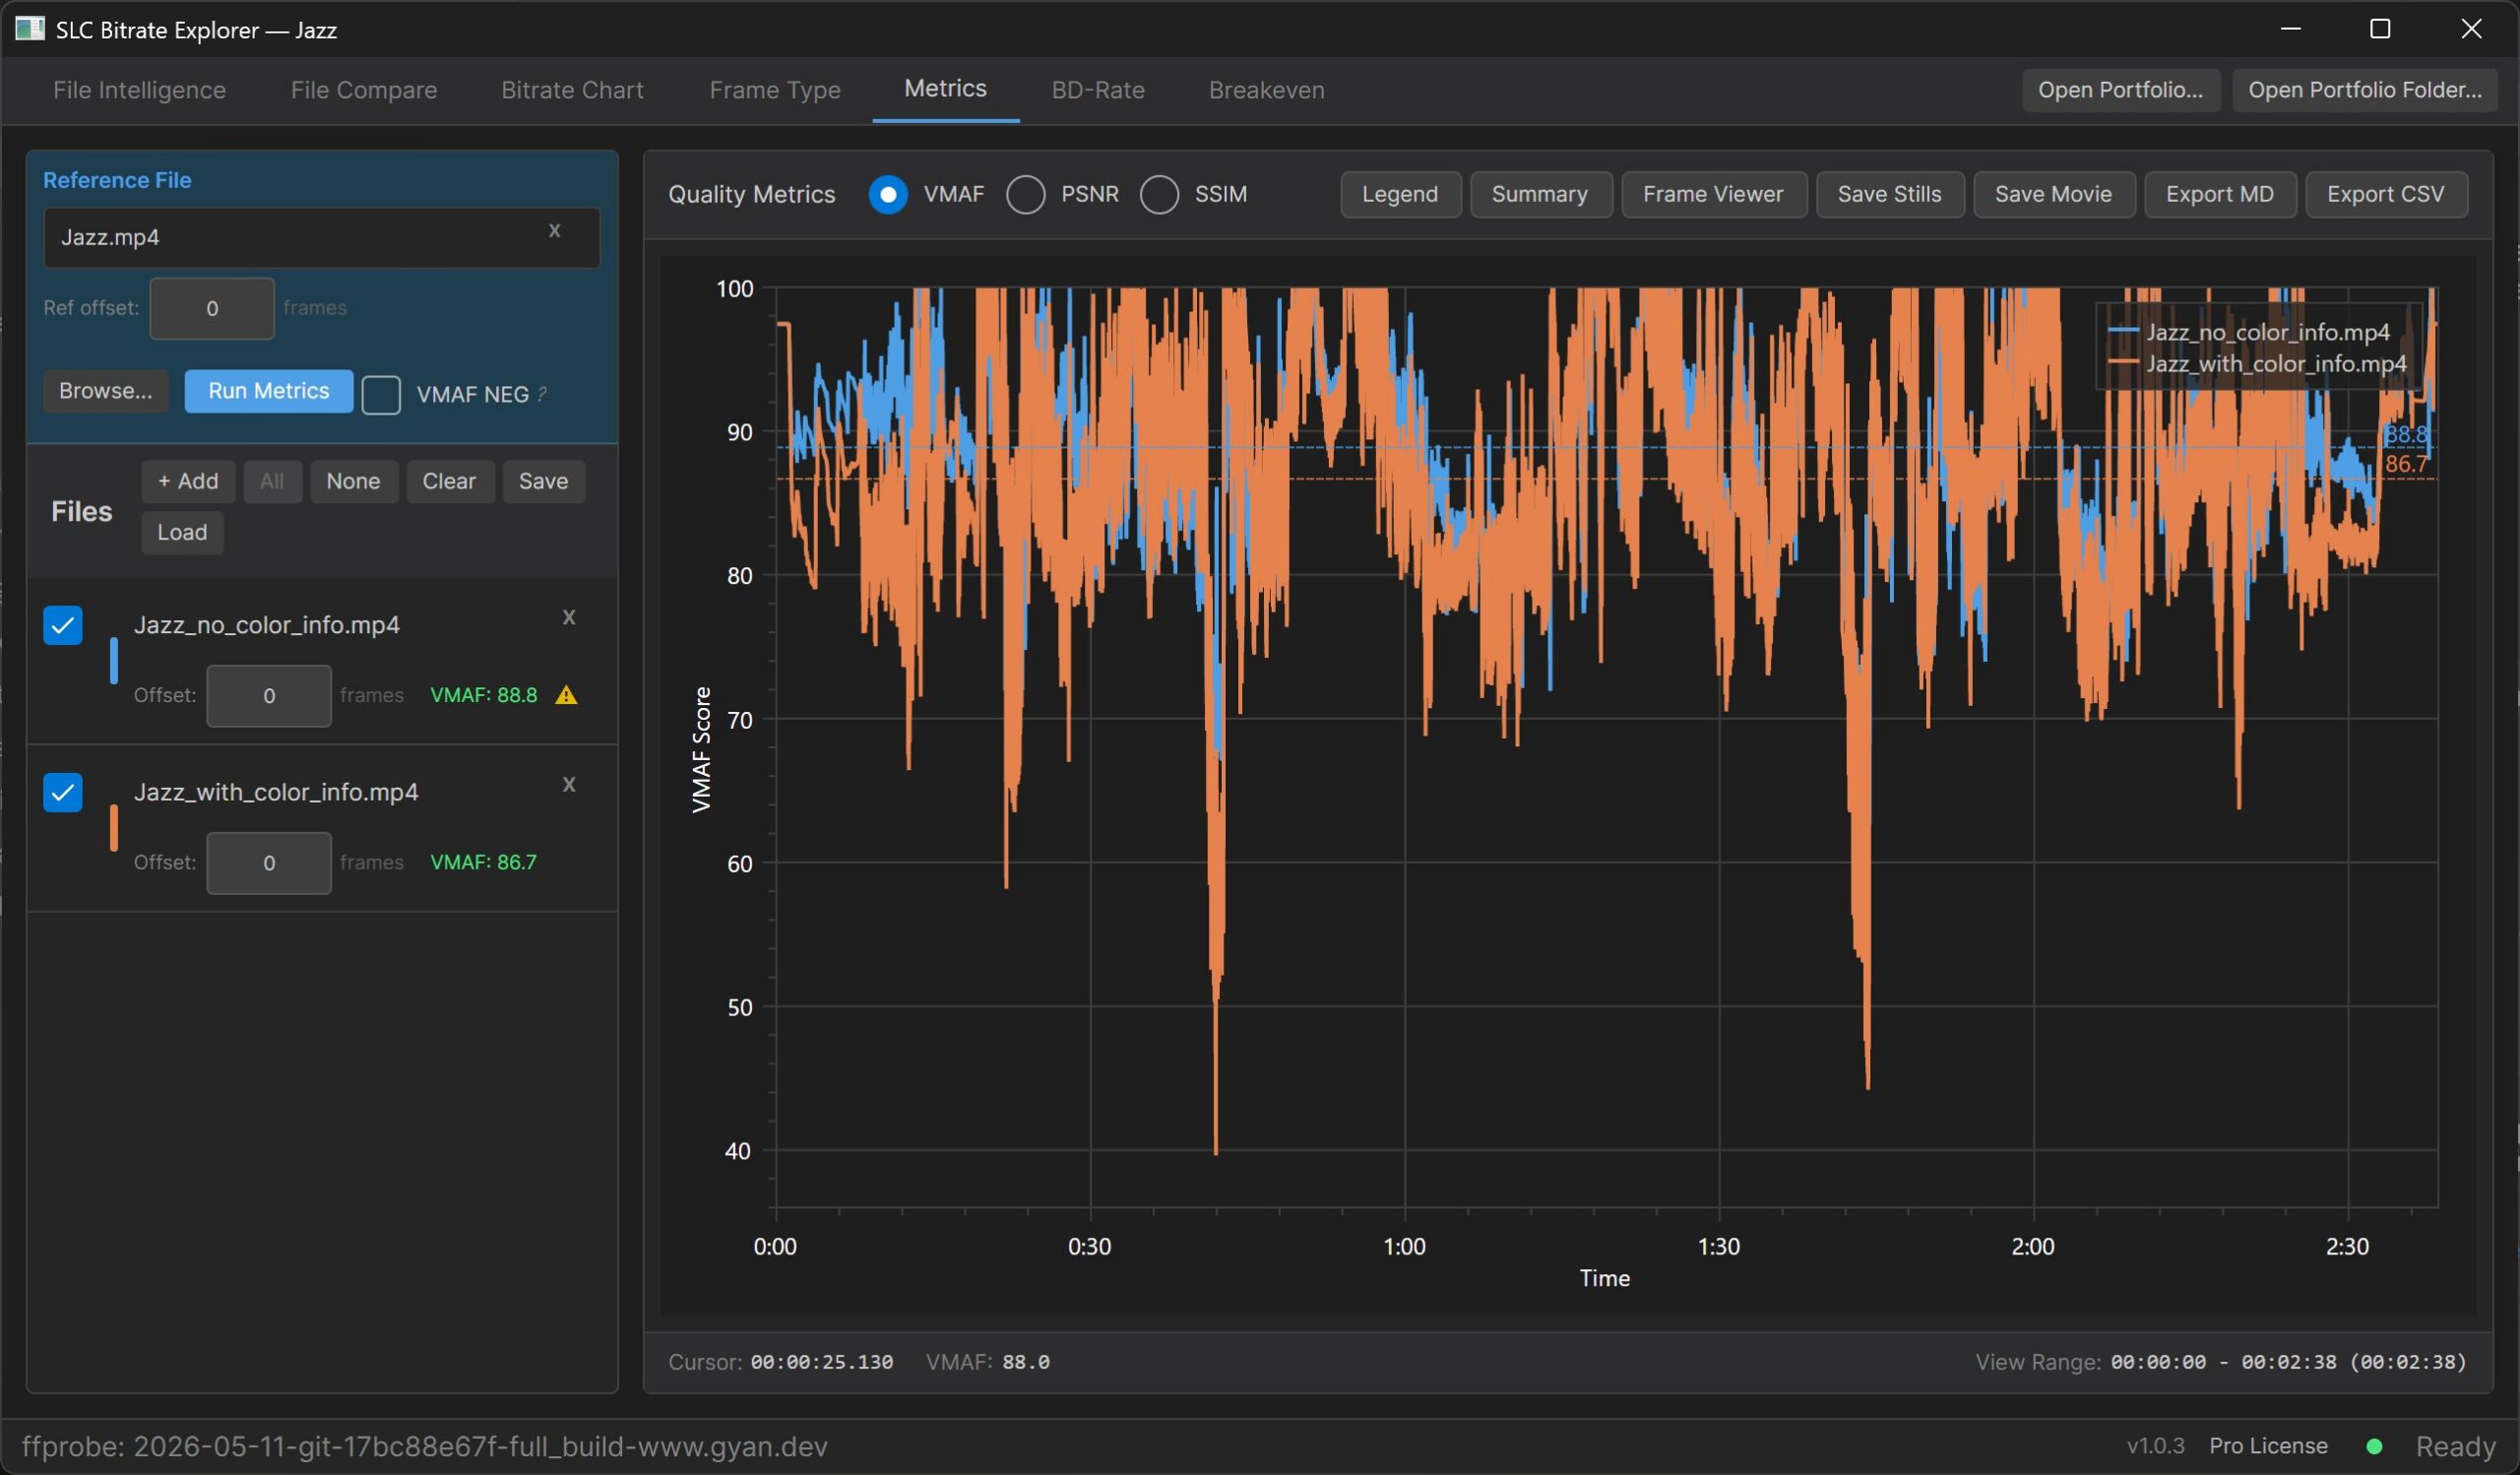
That’s when a batch of encodes returned ultra-low VMAF scores. Numbers so bad they’d imply a broken encode. You see this in Figure 1, with the orange file substantially below the blue file. On the left, if you click the image to open it in full size, you’ll see the scores: 50.5 for jazz_no_color_info.mp4 (orange), 86.7 for Jazz_with_color_info.mp4 (in blue). But when I viewed the files in Frame Viewer, the integrated player, they looked very similar. I couldn’t spot any differences to account for the scoring discrepancy.
So, I ran the same files through VQMT, and the order reversed. Jazz_no_color_info (Figure 2 in green) edged jazz_with_color_info (in red), 88.81 to 86.73.
To obtain another data point, I ran the same files through FFmetrics, and the results were identical to SBE. So, two out of three tools produced answers I knew were very likely incorrect. That’s not a “you have a bug” situation. That’s a “there’s something about these files” situation.
Finding it: just look at the files side by side
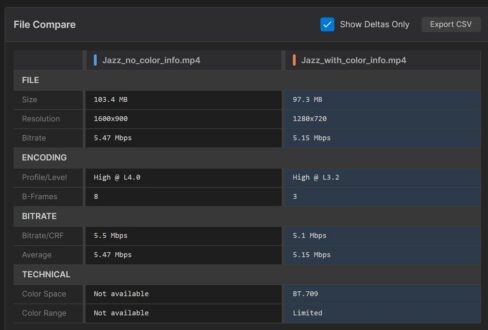
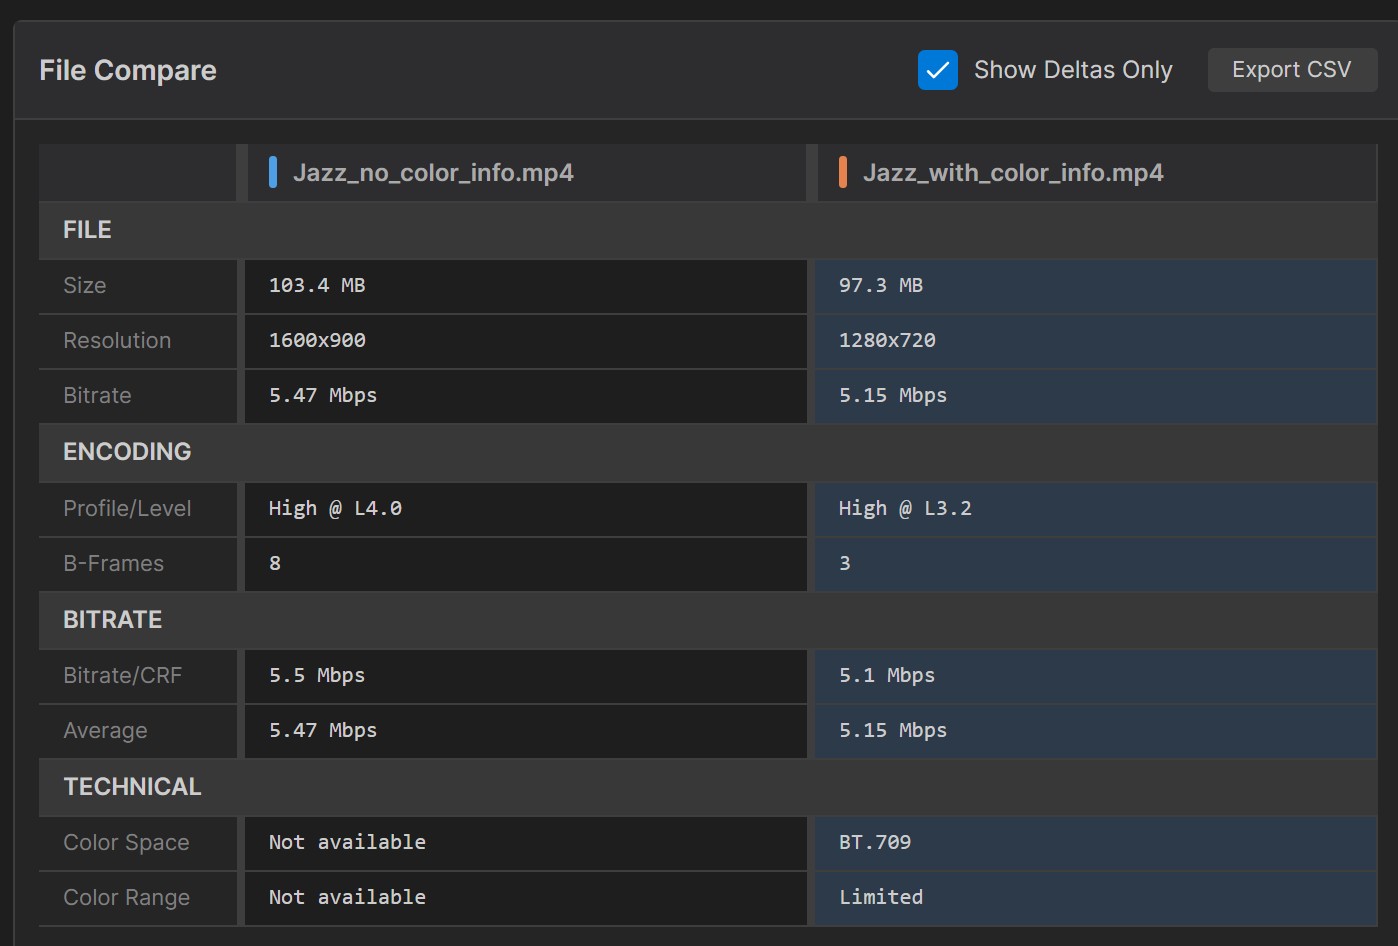
This is where one of SBE’s quieter features earned its keep: the File Compare screen. Drop the problem file next to a file that scored correctly, and read down the column. If you click the Show Deltas Only checkbox on the upper right, it hides all parameters except those that differ.
The only major difference was in the color space and color range, which were absent on the left, but accurately provided on the right. Note that these are datapoints that should be included in the file header metadata, not information that we discern from the file itself.
That one difference is the whole story. Here’s why.
Why a missing tag craters the score
As you almost certainly know, VMAF compares the encoded picture to the source, pixel by pixel. When the encode is a lower resolution than the source, you must scale it up to match the source; otherwise, the metric won’t compute.
All GUI-based tools, like FFMetrics, VQMT, and SBE, perform this scaling under the hood. Unfortunately, without the color information in the file, SBE and FFMetrics produced a faulty scaled file.
We figured out it was the scaling step by using FFmpeg to scale the same input to a Y4M file at the source resolution. We ran that file through SBE, and the score matched VQMT. It was the scaling step without the color information that was hosing our comparisons.
How we fixed it, and why it’s not a magic wand
The fix was to stop letting FFmpeg guess when there was no color information. SBE now explicitly declares the color at the input for any untagged file. We applied the fix, re-ran the analysis, and the score matched VQMT again.
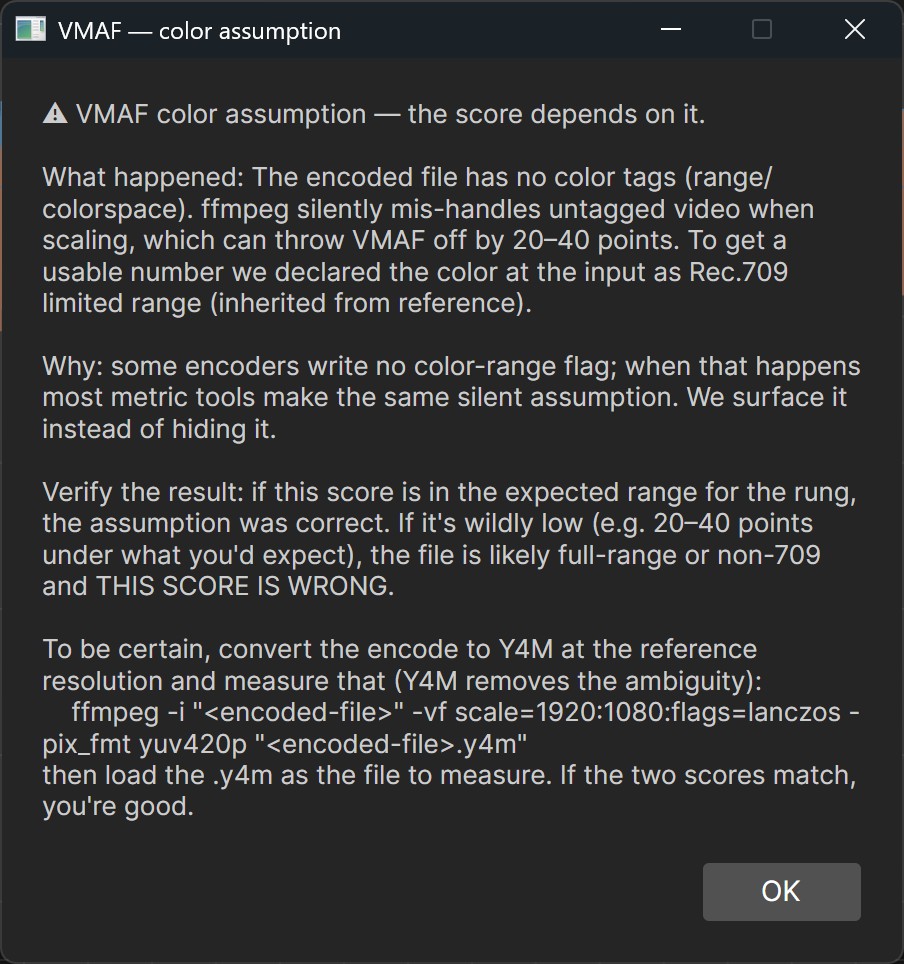
While this worked in this case, here’s the thing. An untagged file genuinely doesn’t tell you whether it’s limited or full range. We make the safe, standard assumption, but it’s still an assumption. So instead of hiding that, SBE surfaces it.
A warning icon sits right next to the affected score (see the top-left of Figure 4), and clicking it opens a window that explains what we assumed, why, and how to verify the result (Figure 5). Specifically, scale the file to Y4M format at its source resolution and run SBE again on the Y4M file. If the score matches SBE, you’re good; if not, you’ll have to experiment further in other tools.
Two takeaways
If you’re measuring quality, with any tool, SBE, FFMetrics, VQMT, or even FFmpeg: the moment you see a score much lower than you’d expect, stop and find the cause before you trust it. You always have to confirm the low score visually. That’s why features like SBE’s Frame Viewer (and VQMT’s Show Frame) are so critical.
A 40-point miss usually isn’t the encode. It’s something upstream, like color tags, frame alignment, or a resolution mismatch, quietly lying to your math. And note that the tools that “agree” can all be making the same assumption and the same mistake.
If you’re an encoding vendor, this is your edge-case reminder. Truth be told, the file played fine and looked completely normal. A viewer would never notice. But hand that untagged file to a QC engineer at a streaming shop on deploy day, watch their VMAF dashboard light up red, and you’ve manufactured a five-alarm fire over a single missing flag. It’s worth a line in your QC step: does every output actually declare its color?
We can’t promise we’ll resolve every edge case before you hit it, but if you do run into one, we’ll do our best to track it down and fix it. That’s how this issue surfaced, and it’s how the product will keep evolving. If you want to see how SLC Bitrate Explorer behaves on your own files, you can download a 14-day fully functional trial and try this workflow in your environment.