Streaming Learning Center Where Streaming Professionals Learn to Excel

Related Articles
This tutorial teaches you how to install and use FFMetrics, a free tool that lets you compute and visualize VMAF, SSIM, and PSNR on up to 12 files.
Let me start this article by stating that the one program I couldn’t live without in my role as video tester and evaluator is the Moscow State University Video Quality Measurement Too (VQMT). It’s awesome for nuts and bolts testing and evaluation of different codecs, encoders, and encoding settings, measuring over two dozen quality metrics, with outstanding features for visualizing low-quality frames, great alignment features for files that have an extra frame or two, and a host of other advanced tools not found on open-source tools. If you’re serious about streaming production, codec and encoder evaluation, or similar topics, you absolutely need VQMT.
On the other hand, if you don’t have $995 handy or even if you’re just looking for an easy way to compute VMAF scores with FFmpeg, you should definitely consider FFMetrics, which is free and open-source. In this article, I’ll detail where to get FFMetrics, how to install it, and how to use it.
If you prefer to learn by video, note that I’ve added three lessons detailing how to install, run, and interpret FFMetrics’ results to the course Computing and Using Video Quality Metrics: A Course for Encoding Professionals. You can read about the additions here. Here’s one of the videos from those lessons.
Contents
Installing FFMetrics
Here are the prerequisites according to the Read Me file:
- .NET Framework 4.7.2 or later. The framework is already included since Windows 10 1803 (4.8 included since Windows 10 1903) so you do not need to install it separately. However, if you use earlier versions of Windows 10 or Windows 7/8, the program should ask you to download and install it.
- FFmpeg, and it’s easiest if FFmpeg is in your path; If not, you should copy FFmpeg into the FFMetrics folder.
- VMAF models, though many of these are included in the FFMetrics download so you shouldn’t have to do anything special here.
To install the program, go to https://github.com/fifonik/FFMetrics. On the right, you can click Latest to be taken to a page to download release 1.0 or click +25 releases (or the number showing when you visit the site) to download more recent versions (Figure 1).
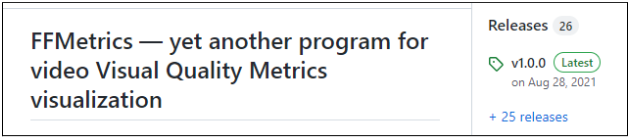
Figure 1. Downloading the codec
I’m downloading v1.3.2 beta 2 as shown in Figure 2, and downloading it to a new folder that I’ve created at c:\ffmetrics.

Figure 2. Downloading beta code into a separate folder.
Then extract the zip file, which creates another FFMetrics folder (C:\FFmetrics\FFmetrics). Drag the files and folders from the FFMetrics sub-folder into the folder, so the files and folders are all at c:\FFmetrics. Figure 3 shows how everything should look like when you’re done. The FFMetrics subfolder on top should be empty and you can delete it. The vmaf-models folder should contain the VMAF models downloaded with the FFMetrics program.

Figure 3. Here’s what the installed program should look like.
To run the program, double-click FFMetrics.exe. You’ll see error messages if the program can’t find FFmpeg in your path, but it worked perfectly for me on three computers that were properly configured. The GitHub site does contain diagnostic information if you’re having problems getting up and running. Again, the biggest prerequisite is to have FFmpeg in your path, or copied into the FFMetrics folder.
Using FFMetrics to Compute PSNR, SSIM, and VMAF
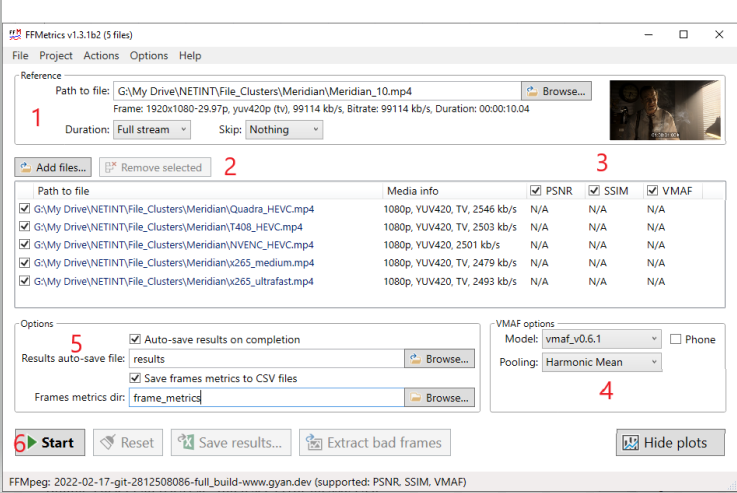
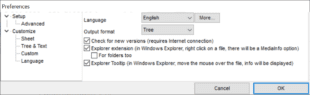
Figure 4. Here’s the UI.
To run the program:
- Drag the source file into the Reference box or use the Browse button to select the source. If desired, you can customize the portion of the file analyzed by clicking the Duration or Skip drop-down boxes.
- Drag up to 12 encoded files into the second box, or use the Add files button to select them.
- Choose which metrics to run
- Choose which VMAF model to run and the pooling method. I prefer the Harmonic mean method because it incorporates quality variability into the overall score.
- You can try auto-saving the results files, but this crashed the program on the two machines that I tried it on. No worries, I’ll show you how to save the results file in a moment.
- Press Start to run the analysis.
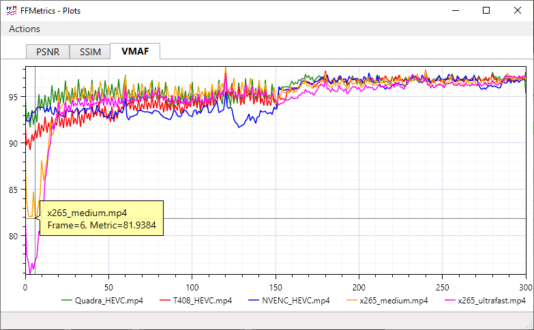
Once the program starts, you’ll see progress in both the main UI as the scores are computed and in the Plots window shown in Figure 5.
Once complete, you can toggle through the different results in the Plots window via the tabs on top of the window. As you can see in Figure 5, hovering your cursor over any plotline will identify the source file, frame, and score. You can zoom into the frame graphs via your mouse wheel and drag around the window by clicking your right mouse button when the pointer is in the graph and moving the mouse in any direction.
Looking beyond the mechanics, you can instantly see how visualizing the data can be so useful. For example, in these ten-second comparisons of HEVC encoders, you see that the first 50 frames of the x265 medium and veryfast files are extraordinarily low. In a two-minute test clip, this would be irrelevant, but in a ten-second test file, it can skew the scores. You also see that the quality of the NVIDIA clip is well below the others through the middle of the file.
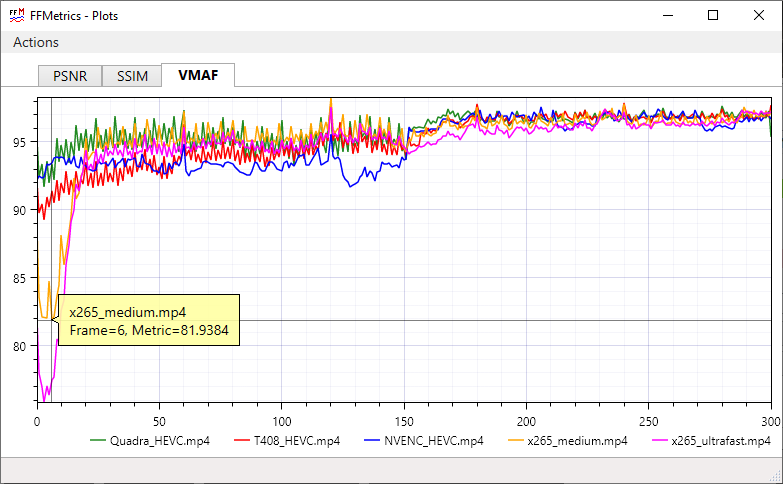
Figure 5. The Results plot. Zoom in with your mouse wheel and drag around by holding down your right mouse button.
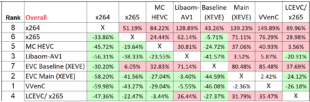
Interpreting FFMetrics Results
Back in the main interface (Figure 6), you see the metric scoring and the ranking of the different files. In this ranking of HEVC encoders, you see the scores for the individual files with the top score in green and the bottom score in pink. In this comparison, the NETINT T408 file scored highest in PSNR and SSIM, with the NETINT Quadra ranking the best in VMAF, though the scores are all very close, which a peek at the graphs confirms.
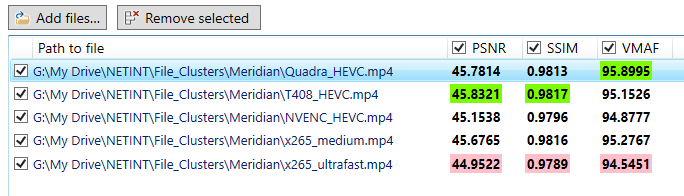
Figure 6. Comparative scoring for the five test files.
If you hover your pointer over any individual score you get more data. In Figure 7, the pointer is over Quadra’s PSNR score, and you see the mean, harmonic mean, minimum and maximum scores, and standard deviation, which is a good measure of quality consistency. You also see the percentile scores for the top 1, 5, 10, and 25 percentiles. The green and pink markings indicate which scores the Quadra rated first and last respectively.
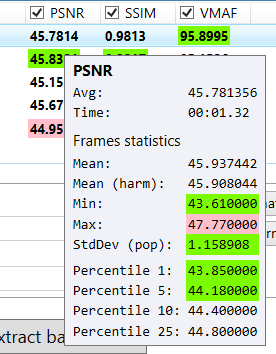
Figure 7. You can see additional data by hovering your pointer over any score in the interface.
All this data is saved with the results file you can save by pressing Save results… on the bottom of the interface (see Figure 4). This creates a CSV file that you can import into Excel or Google Sheets. Don’t try to load the file directly as that won’t work. Rather, create a spreadsheet and import the CSV data.
As you can see in Figure 8, the CSV file contains summary results for most of the data shown in Figure 7, except the percentile data. You also get comparative bitrate data, which is always useful, and details about the metrics, including which VMAF model. Note that you don’t get frame-related data, which I’ve always found useful in the CSVs produced by Moscow State’s VQMT.
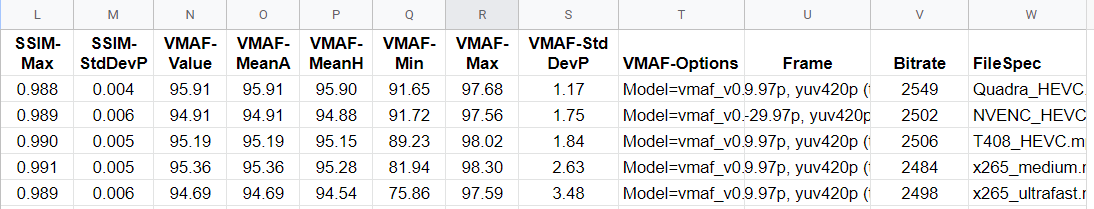
Figure 8. Here’s some of the information contained in the CSV export file.
Also on the bottom of Figure 4 is a button to Extract bad frames, which captures the five worst quality frames for each metric for each file, along with the source file for comparison purposes. This is another area where the VQMT product excels, with the ability to visualize frames from within the interface with multiple options like side-by-side, top-bottom, or split-screen presentation and zoom into the frames to spot artifacts and other issues.
What about metrics accuracy? I ran PSNR, SSIM, and VMAF using FFmpeg and got the same exact scores out to three decimal points. So, that’s good.
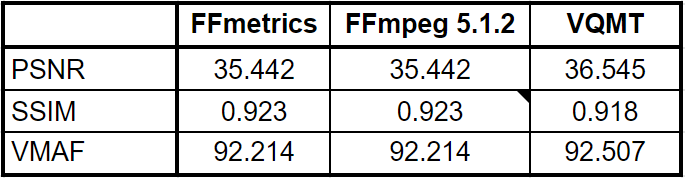
Figure 9. FFMetrics produced scores nearly identical to FFmpeg which was good.
Interestingly, when I compared VQMT to FFMetrics, I noticed the difference between the average score (34.4026) and the mean score (36.4402). I had always thought that the average equaled the mean.
I spent a bit of time researching the difference between average and mean, and found no resource that explained why there could be a difference. See here for this pithy description (An average can be defined as the sum of all numbers divided by the total number of values. A mean can be defined as an average of the set of values in a sample of data). I’m sure it makes sense to some of you but not to me.
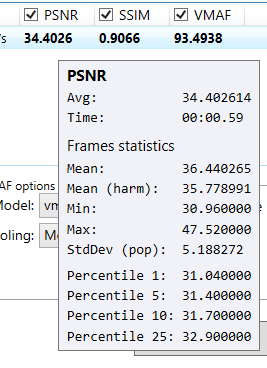
Figure 10. Note the significant delta between the average score and mean.
The only reason this mattered was that FFMetric’s scores differed the most from VQMT in the PSNR value, where the mean differed the most from the average (in FFMetric). If you compare the data in Figures 9 and 10, you’ll see that VQMT’s mean score was very close to the mean computed by FFMetrics (36.544 compared to 36.440) than the average score (36.544 to 34.402).
The bottom line was that while you could use VQMT and FFMetrics interchangeably for VMAF and SSIM scoring using average or mean for FFMetrics and mean for VQMT, you’d have to use the mean FFMetrics PSNR score to match up with VQMT. I don’t know why that is. FYI, I’m running VQMT 14.1, which is the latest version.
Now let’s take a quick look at the command line.
FFMetrics Command Line Operation
While FFMetrics the program was generally solid, my command line experience was pretty rocky. That could be user error, and I’m willing to be proven wrong, but a lot of simple operations just didn’t work for me.
The basic command line is this (from Github).
,cidafad
FFMetrics.exe [options] ref.mp4 file1.mp4 [file2.mp4] [file3.mp4]
By way of operation, this runs the program, inserts the reference file and all encoded files into the UI, and runs the requested operations. Simple enough, and you can see the options at the bottom of this article. The first command I tried was this:
ffmetrics -metric=ssim -log-frames -save-results -save-results-file=c:\ffmetrics\results.csv -run Football_10.mp4 Quadra_HEVC.mp4
Note that you have to insert -run into the command line; otherwise, the program will open and load the files, but nothing will happen. The -log-frames command was to save frame-related data, and that worked fine, but I couldn’t get the program to save the results file with the -save-results command. It saved fine if I used the Save Results button in the program but not in the command line. I tried multiple attempted fixes but couldn’t get anywhere.
I also couldn’t figure out how to analyze multiple sequences, as the program doesn’t automatically close once the operation is done. I created a batch file with three command strings, and only the first ran. I added a kill switch in the command line, but that didn’t work.
The only use for the command line, as far as I can see, is to produce the frame-related data that I couldn’t produce from the UI. That’s useful, but I’d rather have it work within the UI. Again, I’m open to amending these findings if proven wrong, but that’s where we are right now.
Overall, FFMetrics is a very simple way to compute VMAF, PSNR, and SSIM, and graphically display the results of up to 12 files. It’s very easy to use and free, so there’s that.
In terms of really exploring the differences between the files, VQMT has a much richer and more usable feature set, as you would expect for a 14-generation tool that costs $995. Notably, the most recent update allows you to analyze more than two files at once; this two-file limitation was why I started working with FFmetrics in the first place.
FFMetrics Command Line Options
-duration=<seconds>                    Duration of video stream to be processed
Default: 0 (whole stream used)
-log-commands                          Log ffmpeg commands
-log-frames                            Log frames' metrics in csv files
-log-frames-dir=C:\path\               Folder where frame's metrics will be stored
-log-level=DEBUG|ERROR|INFO            Default: INFO
-metric=PSNR|SSIM|VMAF                 Default: all (-metric=PSNR -metric=SSIM -metric=VMAF)

-project=C:\path\to\project.ffmproj    Read project options from specified file
-run                                   Run calculation when program started
-save-results                          After calculation save results to log -save-results-file=C:\path\file.csv
-scaling-method=NEIGHBOR|GAUSS|BILINEAR|BICUBIC|LANCZOS|SINC|SPLINE Default: BICUBIC
-skip=<seconds>                        Duration of video stream to be skipped Default: 0 (stream processed from the beginning)
-vmaf-model=filename                   Default: detected automatically based on reference media info
-vmaf-phone-model
-vmaf-pool=MEAN|HARMONIC_MEAN          Default: MEAN