Streaming Learning Center Where Streaming Professionals Learn to Excel


Related Articles


In a recent interview, Elecard’s Alexander Kruglov shared practical approaches for diagnosing and fixing common streaming problems. Alex, the product manager for StreamEye Studio, demonstrated this product, as well as Boro, a live QoS/QoE monitoring tool. This blog summarizes the discussion, which you can watch on YouTube here.
As Alex explained, Elecard started out as a codec developer, but in building tools to support their own engineers, they realized those tools had broader value. What began as internal utilities evolved into commercial products, marking a pivotal shift from codec development to professional toolmaking. From there, they expanded into a full suite of analysis and monitoring solutions now used across the streaming industry.

As shown in Figure 1, StreamEye Studio is a collection of file-based analysis tools designed for deep inspection of compressed video. It includes multiple components: StreamEye for detailed bitstream analysis, Stream Analyzer for validating transport streams and containers, a Video Quality Estimator for calculating objective metrics like PSNR, SSIM, and VMAF, plus tools for handling uncompressed YUV data and comparing streams across different resolutions or frame rates. Together, these features enable engineers to dig into encoder settings, verify compliance, and measure quality differences with precision.
Here’s a video introducing you to StreamEye Studio 2024.
Boro is Elecard’s system for live monitoring. It has two components: lightweight probes that can be deployed at different points in a delivery chain (before and after transcoders, at headends, even after CDNs), and a central Boro server that collects error reports, warnings, and statistics from all those probes. This setup gives operators a single dashboard to see where problems are occurring, whether at the content source, inside the operator’s workflow, or out in distribution.
Here’s a video introducing you to Boro.
Contents
Who Uses These Tools
According to Alex, Elecard tools are utilized across the streaming ecosystem, including encoder developers validating new algorithms, IPTV and OTT operators managing live workflows, forensic labs investigating content, and universities teaching digital video. For this session, he focused on operational engineers working at IPTV and OTT broadcasters, the professionals who wrestle daily with quality control, encoder optimization, and troubleshooting.

Case 1: Quality Control and Encoding Optimization
The first scenario Alex presented is a problem most broadcasters and IPTV operators will recognize. You configure an AVC 1080p25 stream at a constant bitrate of 7 Mbps, which by all accounts should be sufficient for HD delivery. Yet viewers complain about soft pictures, visible artifacts, or overall poor quality.
With StreamEye Studio, you can hold the bitrate constant and systematically adjust encoder settings such as GOP length and B-frames, rather than blindly raising bitrate and adding cost. As shown in Figure 3, Alex modified the encoder settings to adjust GOP length, B-frame settings, and other parameters.

Then it was time to assess the results. As Alex explained, “With StreamEye Studio, you can open the file and confirm the exact encoder settings that were used. From there, it’s straightforward to prepare several controlled variants and compare them objectively.”
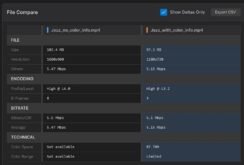
In this demonstration, he showed four variants created from the same 7 Mbps baseline. Variant 1 shifted from Baseline to Main profile and changed entropy coding from CAVLC to CABAC. Variant 2 moved to High profile and introduced B-frames. Variant 3 increased the number of B-frames and reference frames. Variant 4 extended the GOP length and enabled lookahead, giving the encoder greater flexibility in prediction.

“The point is not just to tweak a setting,” Alex noted, “but to validate what those changes actually deliver. StreamEye lets you document the configuration and then confirm the effect on quality.”
To that end, Elecard’s Video Quality Estimator was used to calculate objective metrics, including VMAF, PSNR, and SSIM. Each successive variant showed higher scores: VMAF increased from around 80 to more than 85, PSNR rose from 36 dB to over 38 dB, and SSIM improved in parallel.

Explaining the utility of these metrics, Alex stated, “Visual impressions are useful, but in operations, you need numbers. When you show management or a vendor that VMAF has improved five points, the discussion changes. You can prove that quality has improved at the same bitrate.”
He also reminded the audience that these improvements don’t come free. More complex encoder settings, like longer GOPs, additional reference frames, and lookahead, increase CPU load and may add latency. “But that’s the trade-off,” he concluded. “You keep the same bitrate, you deliver better quality, and you know exactly what it costs you.”
Case 2: Troubleshooting Live Stream Artifacts
The second scenario Alex addressed shifts from file-based analysis to live operations. Here, the challenge is familiar to any broadcaster: the stream is being received, transcoded, and distributed as usual, but viewers complain of visible artifacts or dropped frames. These issues are often intermittent and difficult to trace.
The immediate question is whether the fault lies in the content itself, in the elementary video or audio streams, or somewhere in the transport layer. Without the right visibility, operators can waste hours pointing fingers at encoders, transcoders, or upstream providers.

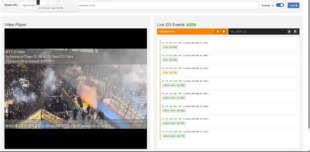
This is where Boro proves its value. As Alex explained, “With Boro, you can put probes at any point in your chain — before and after the transcoder, at the headend, even after the CDN. Wherever the stream passes, a probe can sit there and tell you exactly what is happening.”
Each probe runs locally, capturing statistics and errors as they occur. Those results are aggregated by the Boro server and displayed in a single web interface. The operator doesn’t need to manually inspect streams at each stage; the probes send up-to-date reports continuously. This distributed architecture is what makes the system powerful: instead of guessing where the problem originates, you can see it in real time.

In practice, setting up probes is a straightforward process. The software probe installs on a local machine at the monitoring point. As an example, this can be before the transcoder input, or immediately after it. Configuration takes minutes: the probe connects automatically to the central server and begins analyzing the stream. Tasks are assigned in the Boro dashboard, and violations are flagged instantly. This means that within 20 minutes of deployment, you can have active monitoring across your network.
Alex illustrated this with a simple example shown in Figure 7. Two Boro probes were deployed around a transcoder. The upstream probe immediately detected packet losses before the content even reached the transcoder. The downstream probe showed more severe corruption, since those errors propagated through the chain. In his words, “Our customers are often surprised. They expect the problem to be inside the transcoder, but with probes they can see it started much earlier, at the input stage.”
That distinction is critical. Problems that manifest as “encoder errors” may actually be upstream packet loss, poor handoffs between providers, or corrupted input signals. By localizing the defect, operators avoid chasing the wrong culprit and can resolve issues more quickly, whether that means adjusting their own equipment or returning to the content provider with clear evidence.
The key takeaway is not just that Boro detects errors, but that it shows you exactly where in the delivery chain they arise. That positional insight saves time, reduces misdiagnosis, and ultimately improves service reliability.
Here’s a video that describes how to set up and configure Boro.
For more information on Boro, click here.
Case 3: Timestamp Validation in Transport Streams
The third scenario Alex presented is more subtle than visible blockiness or packet loss. It is a case where all the usual checks say the stream is fine, with no TR 101 290 errors and transport packets that appear compliant, but viewers are still reporting playback problems. Lip sync drifts, audio and video stutter, or set-top boxes occasionally freeze.
As Alex put it, “No TR 101 290 errors does not mean the stream is perfect.”

The issue is often timing. Every packet in a transport stream carries timestamps. Presentation Timestamps (PTS) tell the decoder when to show a frame, and Decoding Timestamps (DTS) control the order in which frames are processed. When everything is healthy, the difference between PTS and DTS is stable, and the video and audio PTS values stay tightly aligned.
StreamEye Analyzer can plot these values dynamically, making timing behavior visible. In the first example screenshot, you can see the PTS/DTS dynamics for a single H.264 PID. The plot should hover around a small, consistent offset. Instead, the lines bounce between +40 ms and –50 ms, producing a jagged saw-tooth shape. That variation means the encoder and multiplexer are not producing consistent timing, forcing decoders to constantly stretch and shrink their buffers to keep up.

In the second example, audio and video PTS values are plotted together. Here, the problem is drift. The gap between audio and video timestamps exceeds three seconds, far beyond the one-second tolerance most systems can handle. The graph resembles two waves pulling apart, and the practical effect is a loss of audio sync, which may be noticeable to the viewer whenever the speaker is on screen.

As Alex explained, the decoding timestamp must be earlier than or equal to the presentation timestamp for the same frame. A negative delta, defined as PTS minus DTS, means the frame would be presented before it has been decoded, which should never happen. These kinds of defects can cause modulators, multiplexers, or set-top boxes to reject streams, or to play them back with jerks and freezes.
The takeaway is that timestamp analysis is essential. Without it, you can be blind to defects that make the difference between a stream that looks “valid” on paper and one that viewers can actually watch without frustration. StreamEye exposes these invisible faults, lets engineers measure their severity, and provides the evidence needed to escalate issues with vendors or upstream partners.
Here’s an explainer video for Stream Analyzer.
Click here for more information.
Case 4: Ad Insertion Issues
For operators of FAST and other advertising-driven channels, ad insertion is revenue-critical but operationally risky. Viewers often report artifacts right at the moment an ad starts or ends, and when that happens, partners in the ad delivery chain are quick to push blame. The ad server says it is a broadcaster problem. The playout team points back at the ad server. Meanwhile, the viewer just sees broken video.

Alex framed the challenge simply: “When customers complain about artifacts at ad boundaries, you need proof of where the problem came from. Otherwise, the argument goes in circles.”
For the record, this type of failure is not unique to client-side or server-guided ad insertion. It can also appear in server-side stitching. Regardless of whether ads are assembled on the client or spliced into a manifest or transport stream on the server, the risk is the same: if the insertion point falls inside an open GOP, dependent frames are left unresolved and artifacts appear.
The difference lies in accountability. In CSAI and SGAI, the ad packager or provider is often blamed, while in SSAI the stitching engine is responsible. In either case, tools like StreamEye and Boro let you demonstrate the root cause clearly by showing that the splice was made mid-GOP.
The workflow here combines Boro probes, Stream Analyzer, and StreamEye. Boro is used first to capture and download the affected transport stream, triggered by SCTE-35 ad insertion markers. This gives you a precise segment of stream data from before, during, and after the insertion event. The dump can then be opened in both the elementary stream and transport stream analyzers, synchronized by timestamp, so the issue is easy to locate.

Then use StreamEye to drill down into the Group of Pictures (GOP) at the point where the ad was inserted. In the example Alex presented, the SCTE-35 marker aligned with an open GOP rather than a closed one. That meant the ad content was inserted mid-sequence, with dependent frames still unresolved. The result was a broken picture on the viewer side (Figure 13).
As Alex explained, “The tools let you show exactly what happened. You can point to the SCTE-35 trigger, show the GOP structure, and prove that the insertion was done incorrectly.”

The operational value here is twofold. First, you can give your playout or ad-serving partner a clear technical report rather than an argument. Second, you can divide responsibility with evidence. Instead of finger-pointing, you can document where the chain broke and take corrective action quickly.
The takeaway is that troubleshooting ad insertion requires visibility into both signaling (SCTE-35 markers) and the underlying video structure (GOPs). By combining Boro probes with Stream Analyzer and StreamEye, operators can transition from guesswork to proof, protecting revenue and ensuring the customer experience.
Wrapping Up
Elecard offers StreamEye Studio for deep file-based analysis and Boro for scalable live monitoring. Together, these tools provide end-to-end visibility across the delivery chain, enabling engineers to diagnose problems others miss, validate encoding and transport parameters with confidence, and replace finger-pointing with proof. As Alex summarized, these are “the typical cases operators face every day,” and solving them quickly is the difference between subscribers who stay and subscribers who churn.

If you want to see how these tools work in practice, Elecard makes it simple. Free online demos of StreamEye Studio and Boro are available, with live walkthroughs from Elecard engineers who can show you exactly how to apply them to your own workflow. You can also meet the team at IBC, booth #3.B47, or join their workshop session on September 13 at 11:00 for a deeper dive. The fastest way to know if these tools fit your workflow is to see them in action.

This content was produced in collaboration with Elecard.