 Streaming Learning Center Where Streaming Professionals Learn to Excel


Related Articles

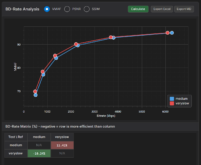

The new Portfolio feature in SLC Bitrate Explorer (SBE) version 2.0 aggregates BD-Rate and break-even results across multiple source files. This walkthrough covers the workflow from data entry to Excel export. Portfolios were NOT available in SBE version 1.0. If your version doesn’t show the portfolio buttons described below, you can upgrade to the new version below. This article was created from a YouTube video available here and embedded below.
Encoding decisions almost always balance quality and cost. The SLC Bitrate Explorer (SBE) is a tool designed to facilitate this analysis. Originally developed as a single-file analysis tool, SBE V2 adds a portfolio feature that enables producers to analyze complete libraries of test clips to gauge the cost-benefit of planned configuration and codec updates across their portfolios.
In addition to consolidated BD-Rate data, publishers can enter encoding and distribution costs to predict break-even under increased costs and estimate how much the updates will save relative to estimated hourly views.
This video details how the new portfolio feature works. If you’re not familiar with SBE, you can get up to speed here.
By way of background, SBE was built to analyze a single file. But you can’t make portfolio-wide decisions from a single clip. The new version adds a Portfolio feature that aggregates results from multiple source files and runs BD-Rate and break-even analysis across all of them. It’s a free upgrade for existing users and is available now below and here. This walkthrough covers the new feature from data entry to Excel export.
Contents
The portfolio model
Let’s start with an overview of the portfolio model. Going back to version 1.0, you can save every single clip project as an SBE project file containing all of that clip’s encodes and their scores. These SBE projects ensure that once you’ve computed metrics and inserted details like encoding and distribution costs, this data stays with each project.
If you want to revisit the results, you don’t have to rerun the metrics; just reload the project. A portfolio is simply a project that aggregates the individual results from these SBE files into catalog-wide data you can analyze and interpret.
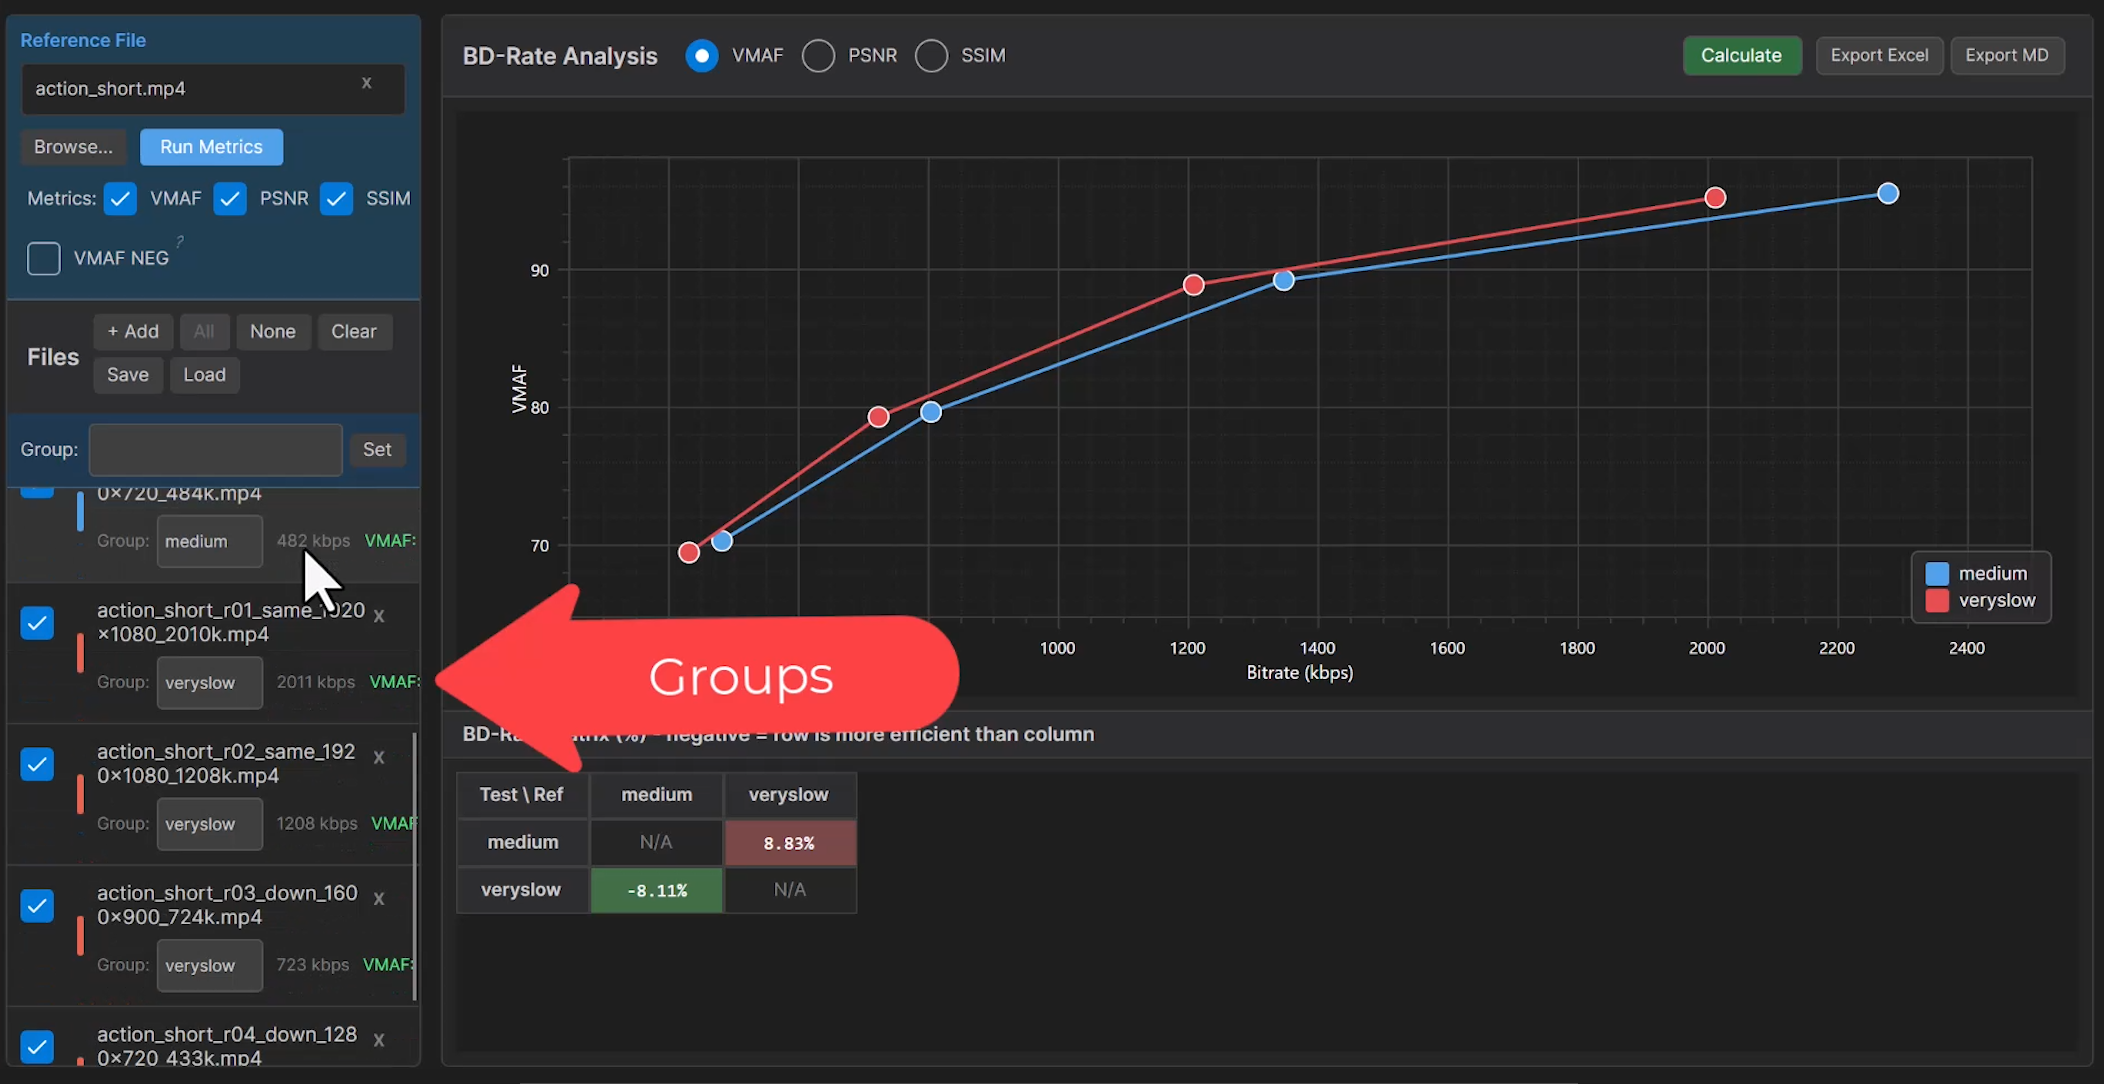
Within each project, the encodes are sorted into groups, which are the categories of encoding parameters or codecs that you’re comparing. In the example used in this article and video, we compared x264’s medium and veryslow presets.
Groups within projects can be any parameters you’d like to compare: codecs (AV1 vs. H.264 vs. HEVC), encoding parameters (1-pass vs. 2-pass, 1-bframe vs. 8-bframe), or encoding technologies like per-title vs. fixed ladders. You create the groups as you work with each individual file, as shown in this YouTube video.
The test procedure is familiar and creating the SBE project is simple.
- Identify your test files. We used 21 for this analysis, all between 90 seconds and five minutes in duration.
- Create comparison encodes for each test group for each test file using your production encoder. For these tests, I created full ladders for each test file using the two FFmpeg presets. You don’t need to create encoding ladders; you can simply encode files at different bitrates or quality levels. But, you need at least four files in each group to compute BD-Rate comparisons.
- Import the source and encoded files into SBE, then run the metrics. If you don’t have SBE, you’ve been computing metrics with your own FFmpeg-based tools, or apps like Moscow State University’s Video Quality Measurement tool or the open-source FFMetrics.
- Most compressionists then import the metric results into custom Python or similar routines or Excel to produce Rate-Distortion Curves and BD-Rate comparisons. SBE does this automatically.
- Save the results as an SBE file.
When creating a portfolio from multiple SBE files, all group names must match exactly across every clip. If one clip lists a group as “very slow” and another uses “veryslow,” the portfolio will not line them up, and that clip will drop out of the comparison.
Fortunately, mislabeling is simple to fix. You can change the group name in SBE and resave the project file. Or, you can make the changes to the text-based SBE project file directly. One global search and replace, and you’re back on track.
Two ways to create a portfolio
There are two ways to create a portfolio. First, if you’re working through multiple projects, just save the SBE project files into a common folder. It doesn’t matter where the videos in the project live; the SBE project file will find them.
SBE Version 2.0 debuts the portfolio feature. You can tell you have version 2.0 by looking at the upper right (Figure 3). If you don’t see these buttons, you don’t have version 2. The update link is below.
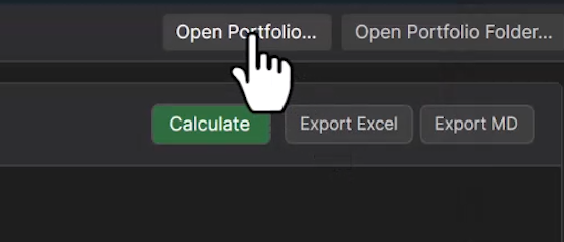
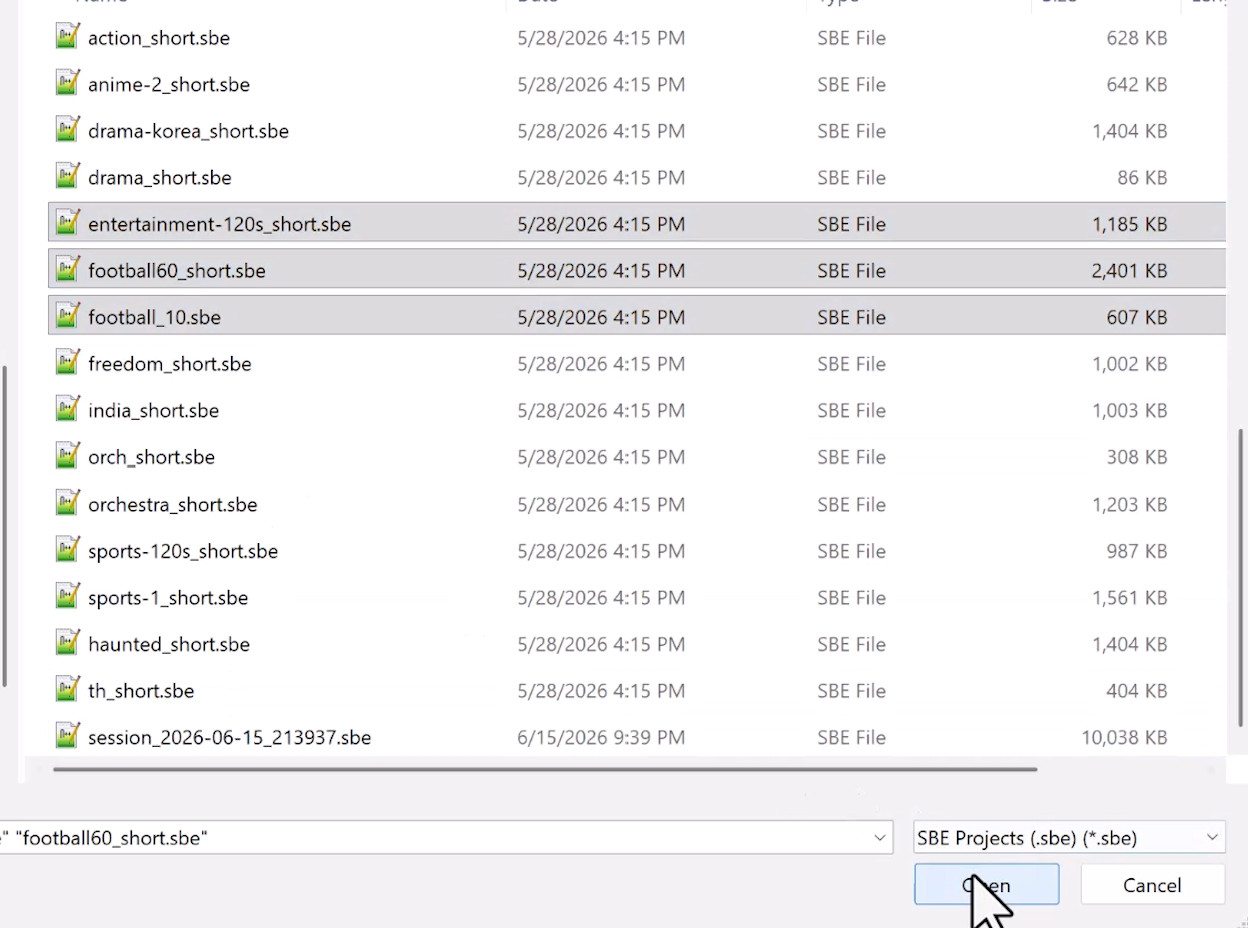
To load multiple SBE files into a portfolio, click Open Portfolio (Figure 3), navigate to the shared folder, and select multiple projects to include (Figure 4). In Figure 4, I’m creating a portfolio from the three selected SBE files.
Click Open, and SBE 2.0 will build the portfolio and ask you which group to set as the baseline.
Once SBE creates the portfolio, you’ll see a button to save the portfolio file, which has an .sbeport extension.
PreComputing multiple files
If you’re working with ten-second test files and a limited number of test projects, creating SBE projects on the fly is efficient. Metric calculation is pretty snappy, so processing 15 to 30 files in a project would take only a few minutes.
On the other hand, if you’re testing two-minute-or-longer source files across multiple codecs, processing time for each can be 30 minutes or more. For these cases, we’ve created a batch processing function using a precompute utility that’s essentially a headless version of SBE.
To run precompute:
- Create a folder to contain all your test encodes (e.g., d:\tests).
- Then create a separate folder for each test file, placing the source file inside it (e.g., d:\tests\file1).
- Then create a separate subfolder for each group (e.g., d:\tests\file1\av1) and place the files for that group in the folder. Name these folders the name you want the group to be called inside the project file.
In the example shown in Figure 5, the folders are H.264, HEVC, VP9, and AV1. So long as all folders are named the same for each test file, the resultant project file should load without a hitch.
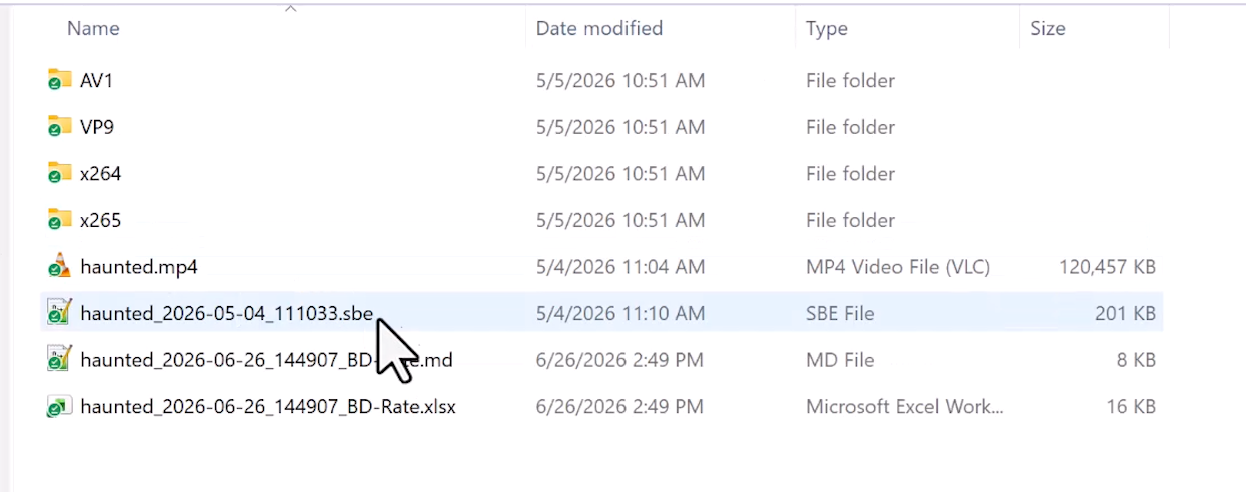
When you run precompute, it computes all metrics and creates the SBE, MD, and XLSX files shown in Figure 5.
Once you have all the files precomputed, click Open Portfolio Folder (Figure 3), then navigate to and select the root folder containing all the test files. SBE adds the most recent project file from each folder. Save the portfolio as before.
Precompute has been tested on the Mac and Windows but hasn’t been packaged for release. If you want to test this module, contact me at jan.ozer@streaminglearningcenter.com.
Working in the portfolio view
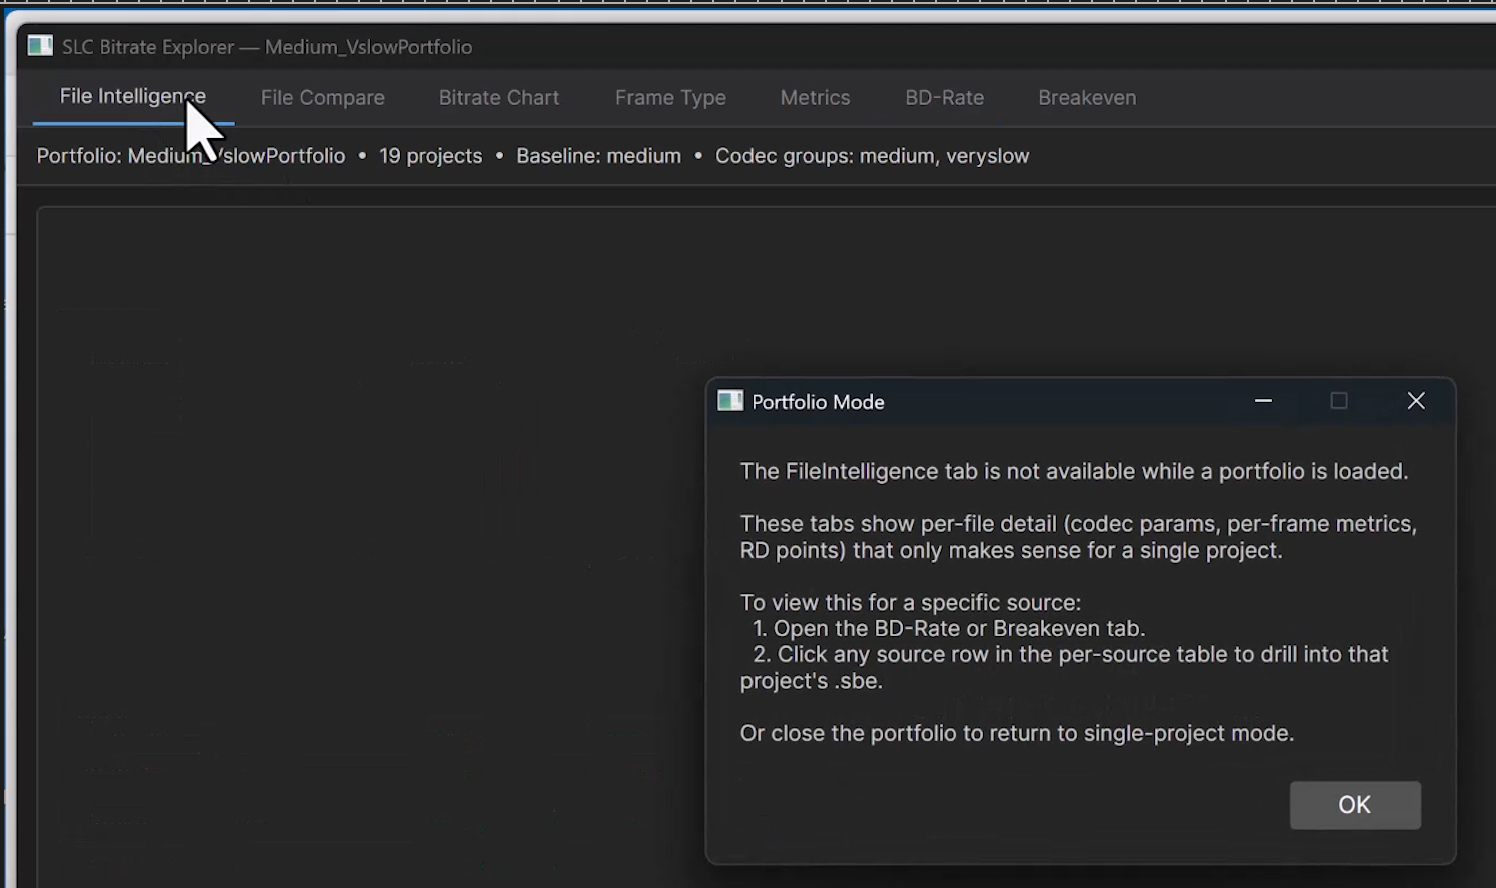
When you create or load a portfolio, the SBE interface changes. Specifically, the File Intelligence, File Compare, Bitrate Chart, Frame Type, and Metrics tabs become inaccessible because they measure aspects of a single set of encodes rather than the portfolio. So the only tabs open in the SBE portfolio view are those on the extreme right: BD-Rate and Breakeven.
Note that you can open multiple instances of SBE from the portfolio view to examine all the tabs and views for those files. I’ll show you how in a moment (Figure 8). These tabs are just not available for the SBE instance loaded with the portfolio.
The portfolio BD-Rate view
Let’s explore the two tabs available in the portfolio view. At the top of the BD-Rate view sits a metric selector for VMAF, PSNR, or SSIM and a Baseline selector. The baseline is the group everything else is measured against. In most cases, it’s the technology that you’re currently using, so if you’re comparing H.264 and AV1, H.264 is typically the baseline. In the sample analysis shown in this article, medium is the baseline. That said, you can make any group the baseline for presentation purposes.
The table shown in Figure 7 is the consolidated BD-Rate matrix. It measures how much bandwidth the veryslow preset saves over the medium preset across all clips. To compute this score, SBE averages the BD-Rate values for each individual clip stored in each SBE file.
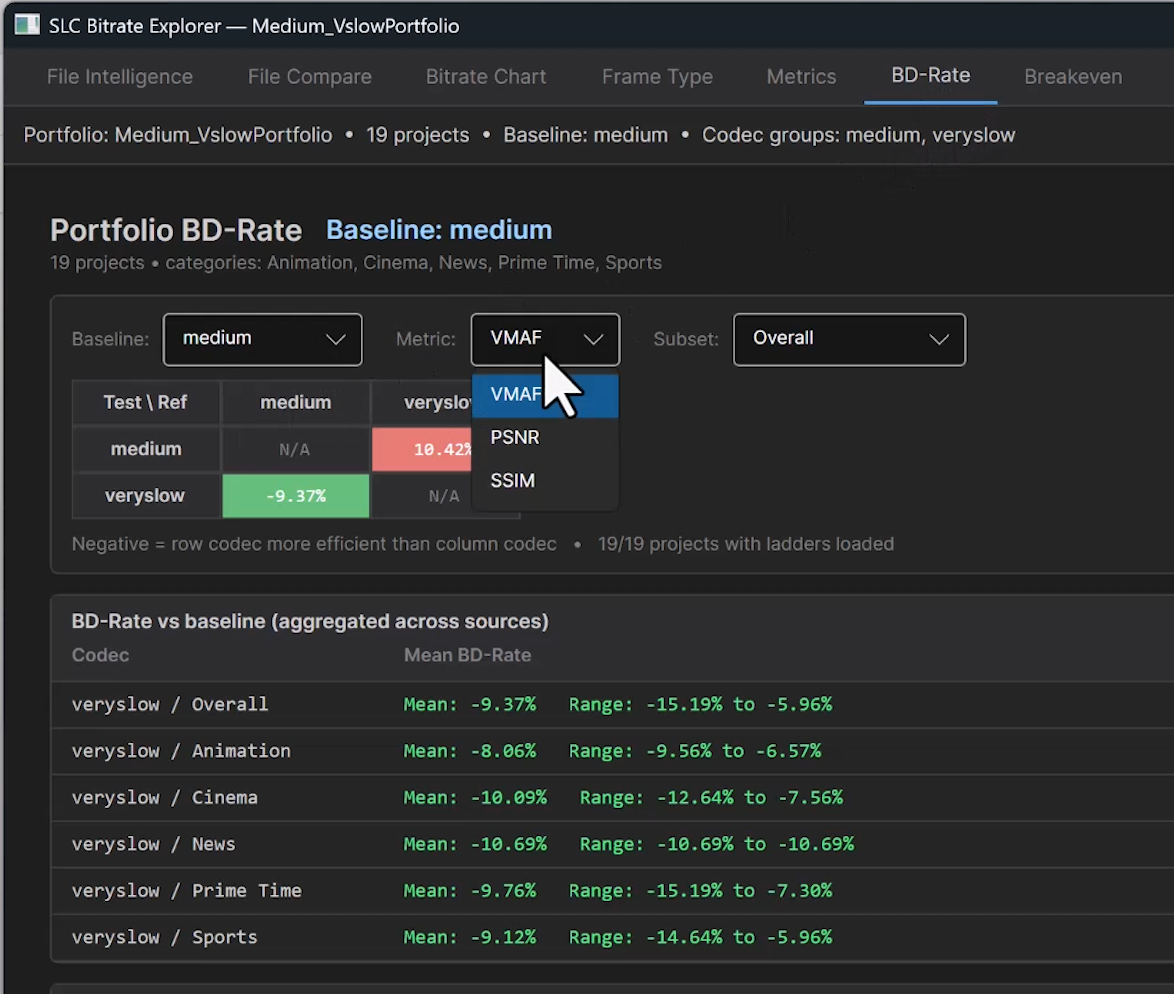
As with all BD-Rate tables, you read the data by row, then by column. The top row is the medium preset. To match the quality of the veryslow output, you’d need to boost the bitrate for the file encoded with the medium preset by 10.42%. Positive numbers are bad, shown in red.
Reading the second line, the veryslow preset produces the same quality as medium at a bitrate savings of 9.375%. Negative numbers are good, shown in green.
Note that you can assign categories to clips (Figure 8) and view category-specific results, which are shown at the bottom of Figure 7. Interestingly, for our animated test clips, veryslow produced less benefit than for cinema and news clips.
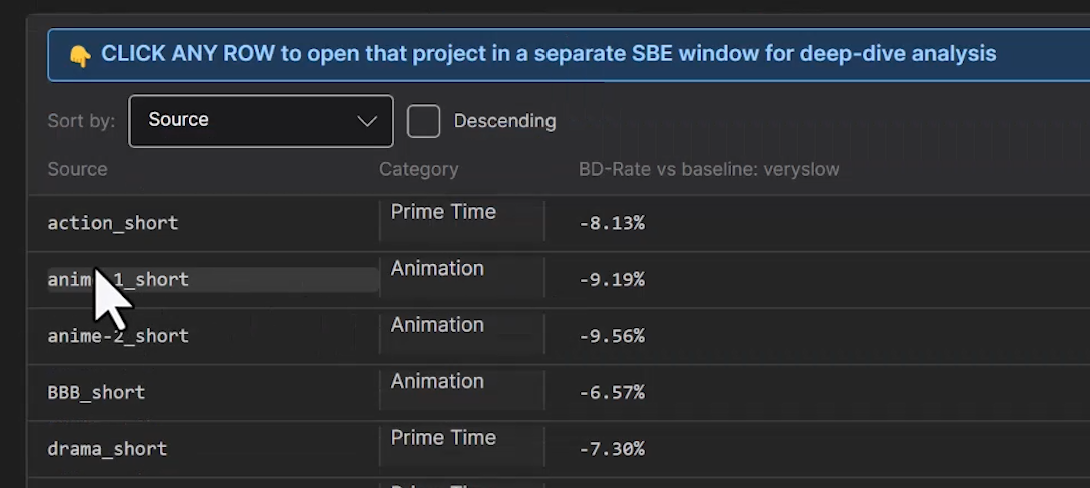
The portfolio BD-Rate view does not include an RD curve. There is no mathematically correct way to combine RD curves from different clips into one curve, particularly when the rung count differs between clips. To view the curves for a single file, click it, and a separate SBE instance opens with the RD curves and all tabs enabled (Figure 8).
The portfolio break-even view
The break-even view converts quality data into hard numbers. Several settings let you customize the analysis to your service.
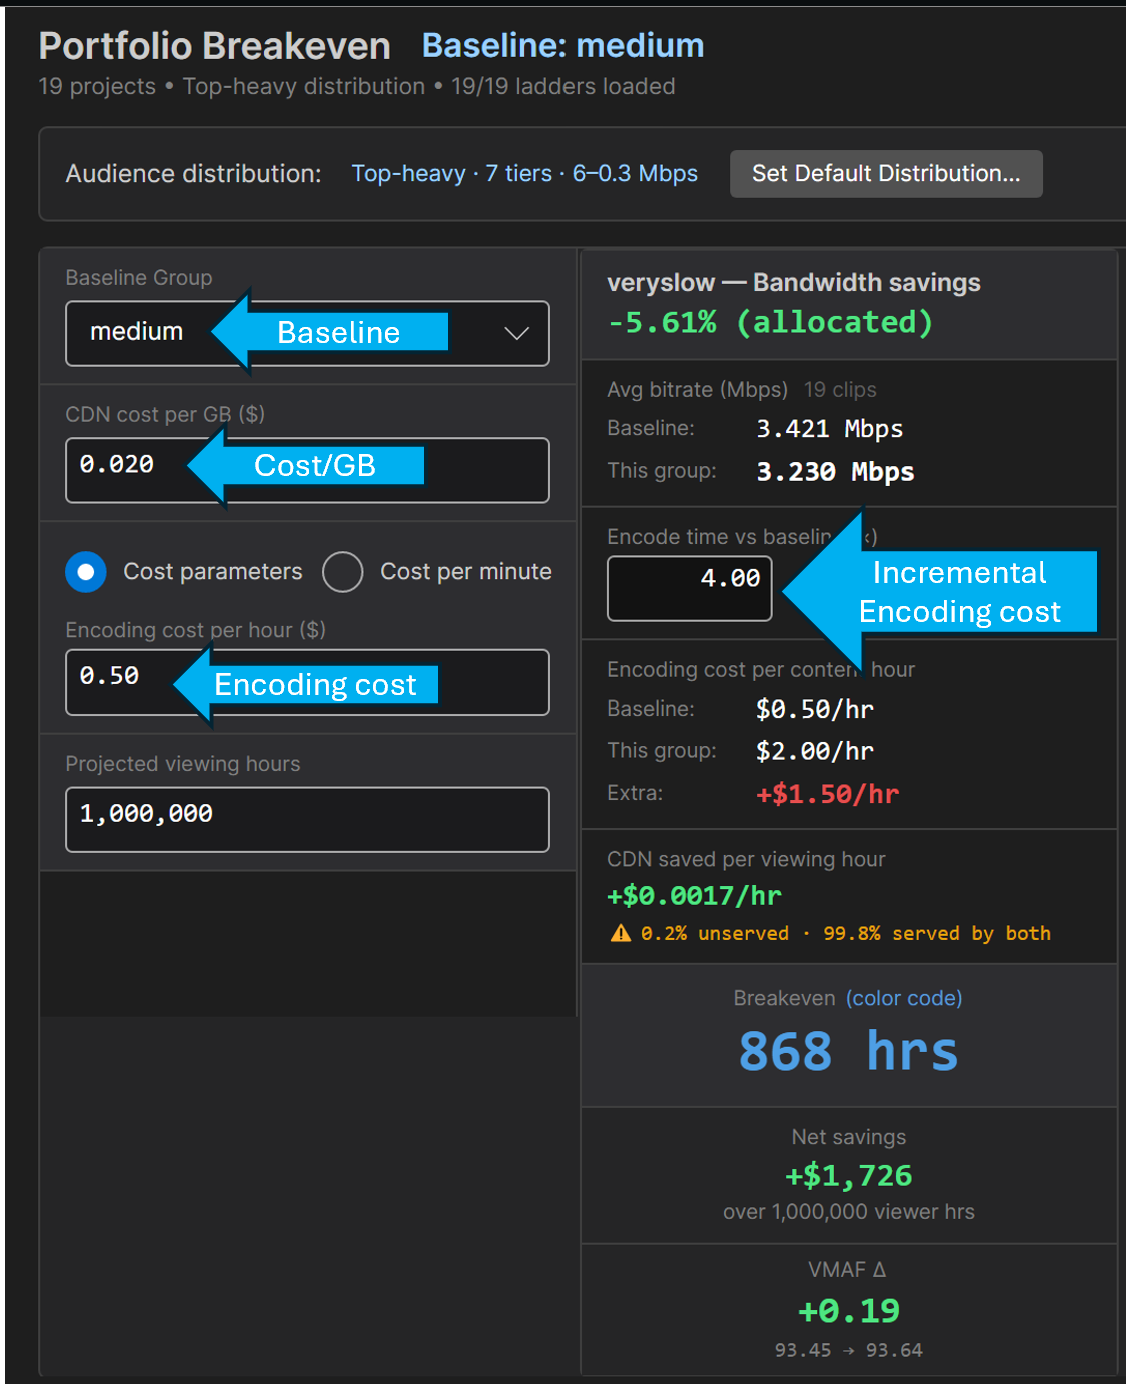
Start with the baseline, again, usually your current technology. In Figure 9, the medium preset is the baseline we’re comparing against veryslow, which saves 5.61% over medium. Enter your actual cost per gigabyte for distribution to translate these percentage savings into dollars and cents. I’m using $0.02/GB, which is high in 2026. At this cost/GB and savings, veryslow saves $0.0017 per hour of viewing.
Next, enter your encoding costs, either cost per hour for cloud or on-prem instances, or cost per minute for cloud encoding services. In this example, encoding the medium preset costs $0.50 per hour, and encoding the veryslow preset takes about 4 times as long, adding $1.50 per hour.
The break-even math is simple. Divide the $1.50 in added encoding cost by the per-hour distribution savings, and you get 869 hours of viewing to recoup the encoding cost. If your titles are watched more times than that, veryslow saves money. If not, it costs more overall.
Over 1 million viewing hours, veryslow delivers a net savings of about $1,700. It also raises the VMAF by 0.19 points, which isn’t significant in this case. Note that the quality delta reflects the metric selected in the BD-Rate tab, so analyzing with SSIM shows an SSIM delta here.
Customizing viewer distributions
At the very top of Figure 9, you’ll notice that the audience distribution is top-heavy. What is this?
Think about it for a moment. In all cases, actual bandwidth savings depend on which ladder rungs your viewers actually retrieve and play. As you know, services create encoding ladders to serve all potential viewers on all devices and connection speeds.
But if 99% of your viewers are watching the top rung, your results will be different than if 99% of your viewers were watching the bottom rung. If you want to accurately estimate how a new codec or encoding configuration will impact your service, you need to factor in the audience distribution.
In this regard, the numbers above reflect a top-heavy distribution, which concentrates viewing on the upper rungs and produces significant bandwidth savings. However, since the top rungs of all encoding ladders should have about the same quality level (just at a different bitrate) the quality differentil is minimal.
Mobile distributions reverse these results. A mobile distribution concentrates viewing in the middle rungs. Figure 10 shows the results for the mobile distribution pattern you select via the Set Default Distribution button. Bandwidth savings drop from 6.5% to 2.78%, but the quality benefit increases from .18 VMF points to 1.27. Because both the average delivered bitrate and savings drop, the break-even climbs from about 870 hours to 3,308 hours, and savings over 1 million hours fall from $1,700 to $452.
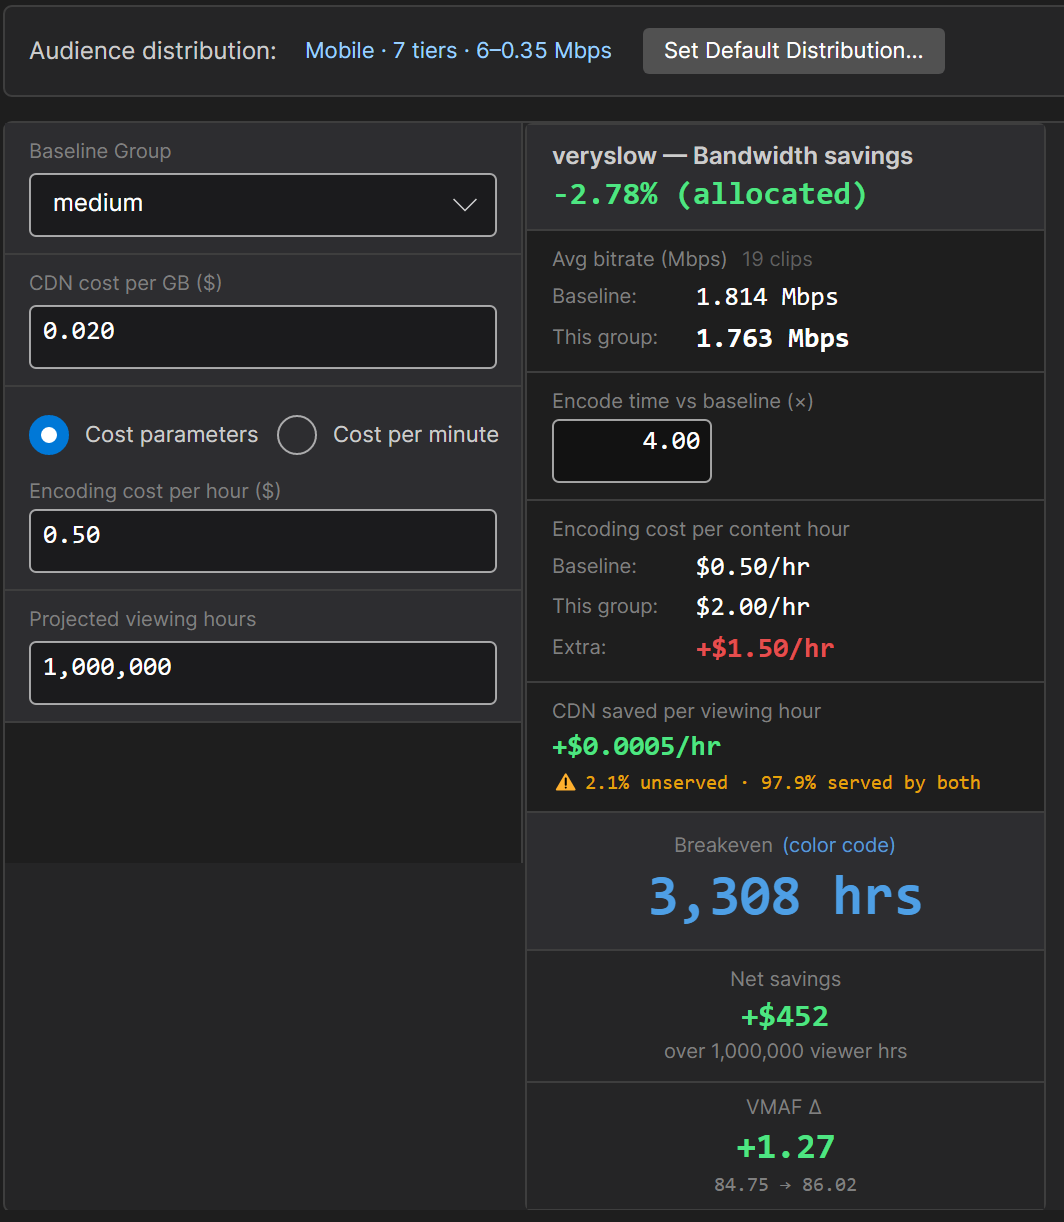
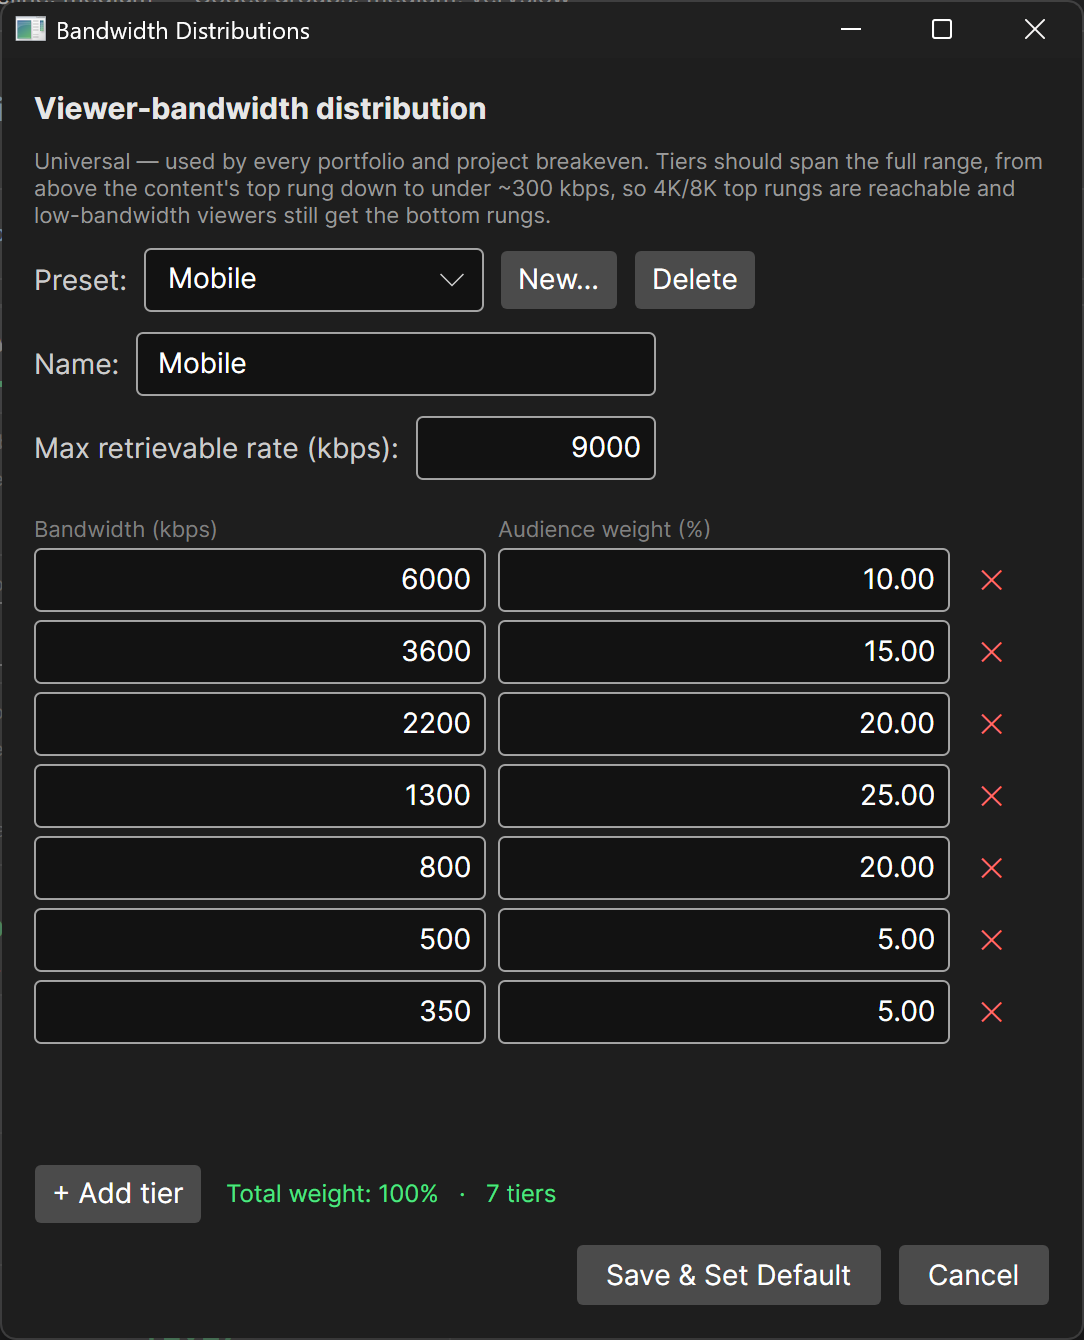
Figure 11 shows the viewer-bandwidth distribution configuration screen. You can choose from a preset or create your own distribution. In my experience, most services know these numbers (see here for a sample).
Exporting the data
The two portfolio views, BD-Rate and Breakeven, both enable Excel exports. You can see the real output included in this article by downloading the actual BD-Rate export and Breakeven export from this analysis.
The BD-Rate export gives you a complete record of every file. It includes an overall summary; the BD-Rate matrix for VMAF, PSNR, and SSIM; category scores for all three metrics; individual clip summaries; top-rung summary data; raw ladder data; and the individual ladders, curves, and BD-Rate data for each clip. It also includes genre-level results for all three metrics, along with a summary comparison. You can download the BD-Rate export from this portfolio here.
The break-even export produces a summary report for the current configuration: the distribution preset, all applied parameters, and aggregate scores by category and by source clip. You can download the Breakeven export from this portfolio here.
Summary and Downloads
Portfolio-wide decisions require portfolio-wide data. A single clip can point the wrong way, and the break-even for an advanced preset or a new codec can swing by more than three times depending on how your audience watches. The Portfolio feature lets you quantify those advantages across your full library with real distribution and cost parameters.
Get SBE 2.0
New to SBE: free 14-day trial, then $109.99 for a license.
Already own SBE: 2.0 is a free upgrade.
Windows and macOS. Requires ffmpeg/ffprobe (free).
Versions Available – Download/Installation Instructions

Windows x64 – Download
MacOS Intel – Download
MacOS Apple Silicon – Download
System Requirements
All platforms:
– ffprobe + ffmpeg must be on PATH (not bundled)
– ~130 MB disk space for the app itself
Windows x64 (win-x64)
– Windows 10 or later, 64-bit
– .NET runtime bundled (self-contained)
macOS Intel (osx-x64)
– macOS 10.15 (Catalina) or later, Intel
– .NET runtime bundled (self-contained)
– VLC 3.x must be installed
macOS Apple Silicon (osx-arm64)
– macOS 11 (Big Sur) or later, Apple Silicon (M1/M2/M3/M4)
– .NET runtime bundled (self-contained)
– VLC 3.x must be installed