 Streaming Learning Center Where Streaming Professionals Learn to Excel

Related Articles


When Facebook compared the AV1 codec to VP9 and two flavors of H264, their researcher precisely stated, “In terms of PSNR, the average BD-rate savings of AV1 relative to x264 main, x264 high and libvpx-vp9 were 51.0%, 47.0% and 29.9%, respectively.” This means that AV1 delivered the same quality as x264 main at 49% the data rate, x264 high at 53% the data rate, and VP9 at 70.01% the data rate.
This precision was enabled by a measurement called the Bjontegaard Metric, which is highly useful when comparing two codecs, or even two different encoding techniques applied to the same file. I have never used the Bjontegaard Metric in any articles, books, or other works because I thought it was wonky and impossible to calculate. When a recent consulting project required BD calculations I dug in, and (as always seems to be the case) found it both simpler and more useful than imagined.

Figure 1. BD-rate savings from AV1 as published by Facebook.
Here’s how you can do the same.
Contents
Points on the Curve
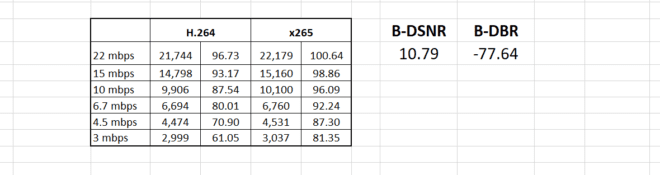
Figure 2 shows a common use case. On the left is the data, the data rates and VMAF rating for H.264 and HEVC videos. On the right is the chart, showing substantial savings. For the record, these numbers are from work performed in 2017 and should not be considered current. They are presented for example purposes only.
 Figure 2. The raw data.
The Bjontegaard Metric answers two questions:
- What’s the data rate savings delivered by HEVC?
- At the equivalent data rate, what’s the quality improvement?
To find the answers, start at https://github.com/tbr/bjontegaard_etro.
Getting the Worksheet
The Github was created by Tim Bruylants, back when he was a research scientist at ETRO, Vrije Universiteit Brussel (Bruylants is now a System Development Engineer at ON Semiconductor). As you’ll read on Github, the page contains “Excel VBA code for calculating Bjontegaard Delta SNR and Rate, using an arbitrary number of data points. The calculated results comply with VCEG-M33 when using 4 data points.”
The Github contains two downloadable worksheets, one a worksheet with the VBA code that you can use directly, the other a .xla Excel Add-in file with the VBA code that you can make globally available via Excel’s Add-In preferences. However you get to the VBA code, it computes two values.
B-DBR – this is the data rate savings delivered by the codec (or encoding technique), essentially the number quoted by Facebook.
B-DSNR – This is the average quality difference for whatever metric you’re using, whether PSNR, VMAF, or other.
At the Github, you’ll see what’s shown in Figure 3. I tried downloading the Excel files directly, which didn’t work. Then I downloaded the ZIP file which did.
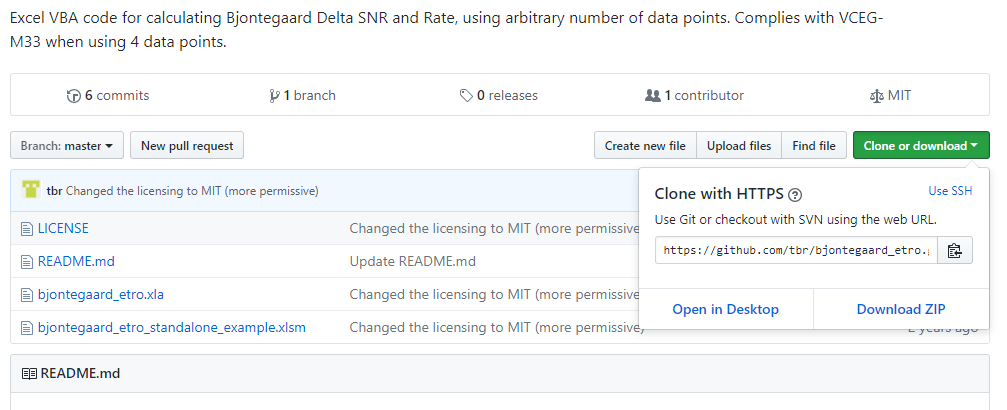 Figure 3. Download the zipped file, not the direct links.
Computing B-DBR and B-DSNR
I worked with the xlsm file, which contains example data that simplifies operation. Unfortunately, there’s one error you need to fix before using the macro. Open the spreadsheet, and you’ll see that both calculations display the error shown on the upper right in Figure 4.
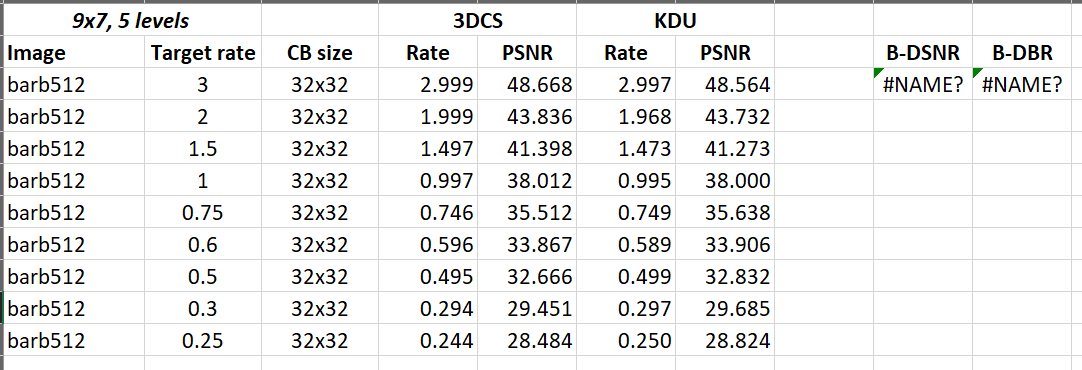 Figure 4. Here’s the spreadsheet, but both calculations show an error.
I asked Bruylants about this, and he was kind enough to respond, “The two example cells that call BDSNR and BDBR functions will probably contain some prefix path (which is wrong). Just delete the prefix path the = and the BDxxx as the functions are included in the xlsm file (no need to refer to external files). So, calling the function should be as simple as typing “=BDSNR(….)”. Not sure why Excel keeps adding those paths…”
If you click on the B-DSNR field, for example, you’ll see what’s shown in Figure 5, which contains the extraneous address information. Sorry, it’s so small, but you can click the figure to see it at full size.
 Figure 5. The computation should not include the address information.
If you shorten the macro to what’s shown in Figure 6 (and enable content, if necessary), the macro will compute. The figure also shows the data used by the macro; if you copy and paste the two computations to a similar point to the right of two data fields, you can adjust the ranges either graphically or by typing in the correct values, and the macros will compute.
 Figure 6. Remove the address information and the macro will compute.
That’s how I computed the B-DBR and B-DSNR for the data shown in Figure 2 (now also in Figure 7). The next question was how to interpret the data. Figuring that Mr. Bruylants had already done his good deed for the day, I turned to Nigel Lee, Chief Science Officer at EuclidIQ. I know Nigel from testing the company’s excellent per-title encoding technology and had noticed that he had authored a useful article entitled, Improved Video Quality Measurement Using MOS Predictor Metric that mentioned the BD-Rate metric.
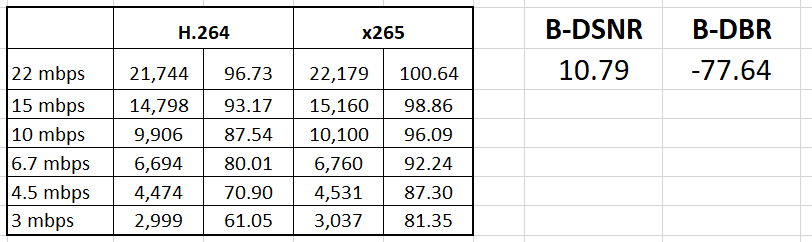 Figure 7. Here are the B-DBR and B-DSNR for the data shown in Figure 2.
Interpreting the Results
I sent a short note to Nigel asking how to interpret the results. Here’s what he said (with some minor edits).
What they label as B-DBR is the average percentage bandwidth savings for equivalent quality level, over the range of quality levels common to both curves in the plot. In your example (see Figure 2), the red curve ranges from 80 to 100, while the blue curve ranges from 60 to 95, so the common quality range is 80 to 95. Once the common quality range is determined, average bandwidth savings is determined by calculating the area between the curves (to the left of the blue curve and to the right of the red curve) and dividing that value by the area to the left of the red curve (but to the right of the x-axis).
So the best interpretation of the B-DBR results is for equivalent quality, x265 provides 77.6% avg. bitrate savings compared to H.264. I say “equivalent quality” because there are multiple quality levels being compared in the calculation, each with slightly different bandwidth savings (any horizontal line that intersects both curves is a “quality level”).
B-DSNR reverse the variables: for equivalent bandwidth, it finds the average quality improvement. Because you’re using VMAF, it wouldn’t technically be B-DSNR since SNR stands for signal-to-noise ratio, whereas VMAF is more along the lines of DMOS. You might call the second metric more generally something like B-D-Qual.
The bottom line is that with this sample data, on average, x265 delivers a VMAF improvement of about 10.79. Since a VMAF delta of six equals a just noticeable difference, this is a significant improvement, which now you know how to compute precisely.
I’ll be using both metrics a lot more going forward in my articles on Streaming Media and the update to my book, Video Encoding by the Numbers: Eliminate the Guesswork from your Streaming Video. Next time you’re working to quantify the benefits of a new codec, encoder, or encoding technique, you can too.


Does HEVC compress better than AV1 then?
Sorry, I’m stupid and I was looking for a TL;DR version
Pere: At this point, it depends upon who you ask. I’ll start running my own tests when encoding times start getting reasonable.
Jan
I just found this post, very nice writeup.
Maybe no longer relevant, but I’d like to point out that I also ported the VBA code to C++ (https://github.com/tbr/bjontegaard_cpp). It might be of interest 🙂
Tim – I’m sure it will be; thanks for sharing. Jan
Hi Jan, great article! I have been computing BD-Rate and BD-SSIM for a set of data and I’m getting a BD-Rate and BD-SSIM that are both negative (BD-Rate = -48 and BD-SSIM =-2.86). Is this possible or must I be doing something wrong? I have converted SSIM to log before plugging the data into the excel sheet (-10log(1-SSIM).
Thanks in advance
George
George:
Thanks for the kind words.
Yes, BD-Rate and BD-SIM can be negative – if you were comparing H.264 to HEVC it would be negative; if the reverse, it should be positive.
I always check by examining the rate-distortion curves. In my example, HEVC would be higher than H.264; if the BD-Rate stats didn’t support this, I’d know I probably have the fields reversed. What do your RD-Curves show?
Thank you so much for your reply!
I always thought that BD-Rate and BD-SNR can’t be the same sign i.e. both positive or negative. How can one explain a scenario like this where the BD-Rate and BD-SSIM is negative, as BD-rate is saying codec B requires less bits for the same quality as A, but codec B has less quality than A at the same bitrate? or am I thinking this in the wrong way?
I will examine the RD-curves and see what they show, but if you could clarify the above that would be much appreciated.
Thanks!
It’s Sunday and my brain is a bit too foggy for hypotheticals. Why don’t you look at the curves, draw some conclusions, and send me the curves (as png files) and your calculations? I don’t like loading spreadsheets from others, so maybe park the data in a Google sheet and share that?
An example with the BD-Rate and BD-PSNR, the RD curve is on the sheet also (although it is very odd – used the spreadsheet provided by Bruylant to generate the curves). Please not I used crf levels of 19, 27 and 35 with 7 sequences to give me 21 rows of results in the table.
https://docs.google.com/spreadsheets/d/1vGoxY-q6HDeMGl9dgRYC1eK0dc8rRFAM6KFaFMvA-_I/edit?usp=sharing
Thank you!
And I have a question about BD-PSNR. If I haven’t this tool, could I compute the approximate value? For example, I just have 4 QP values, could I get the approximate result?
Wan – not sure what you mean by 4 QP values. if you mean data rate and PSNR scores for two codecs over 4 qp-related data points, I guess you could estimate. If it’s critical, though, maybe find a colleague with Excel and use the plug-in?