Streaming Learning Center Where Streaming Professionals Learn to Excel

Related Articles


Contents
The Voronoi omnidirectional video metrics have the best correlation between test scores and subjective ratings than all measured 2D and 3D metrics according to its inventors. It’s an open-source metric you can download and learn to use below. I’ll be discussing the Voronoi metric in my upcoming talk on 2D and 3D video quality metrics at Streaming Media West and will be adding a module to my course on Video Quality Metrics. You can read more details about both below.
Most video producers are getting comfortable with the accuracy and relevance of 2D metrics like VMAF and SSIMPLUS as a useful (if not 100% accurate) gauge of how human viewers would rate the quality of a particular 2D video. However, omnidirectional video (ODV) is a completely different case (Omnidirectional video has many names, including 360-degree video and virtual reality video. I’ll use only ODV in this article for consistency).
This is shown in Figure 1. On the left is a flat representation of the earth, on the right, the globe. You can see how distorted the South Pole is, with the comparison becoming more accurate around the equator and worsening through to the North Pole. Given that a 2D representation of the ODV world is fundamentally distorted, how accurate can a 2D metric like VMAF be in predicting the subjective quality of an ODV video?

Figure 1. Representing ODV video in a 2D image.
As you’ll see, 2D metrics can do a decent job of predicting subjective quality depending upon a number of factors. But many researchers have attempted to create algorithms that deliver a higher correlation between the objective metric and subjective ratings. One such effort from Trinity College Dublin produced the Voronoi metric. You can read the abstract here; basically, the metric works by:
- Dividing the ODV into M patches using the spherical Voronoi diagram shown below of M evenly distributed points on the sphere.
- Then it applies a traditional metric like VMAF, PSNR, SSIM, and MS_SSIM to each patch.
- Then it averages the patch scores into a single score using the arithmetic mean.
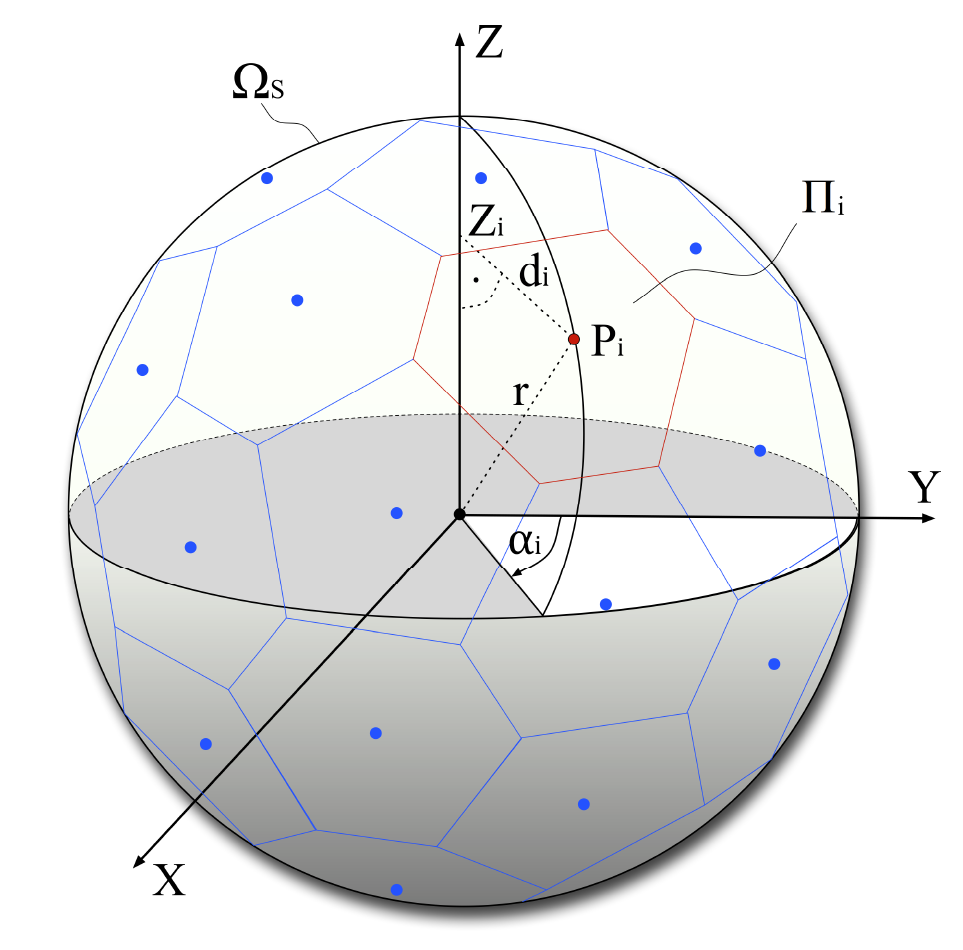
Figure 2. Dividing the image into patches.
Equirectangular vs. Cubemap
Before diving into the results, let’s cover a technical detail relating to ODV. Briefly, when a camera stores an ODV image it has to use a flat, 2D representation. The most popular is the equirectangular (ERP) representation shown on the left in Figure 3. On the right is a cube-mapped (CM) representation that is generally considered to be more accurate because it contains less distortion. In both cases, the player software will reconstitute the frame into the 360-degree view shown in the VR headset, here we’re just talking about how the image is stored. You’ll see why this is relevant in a moment.
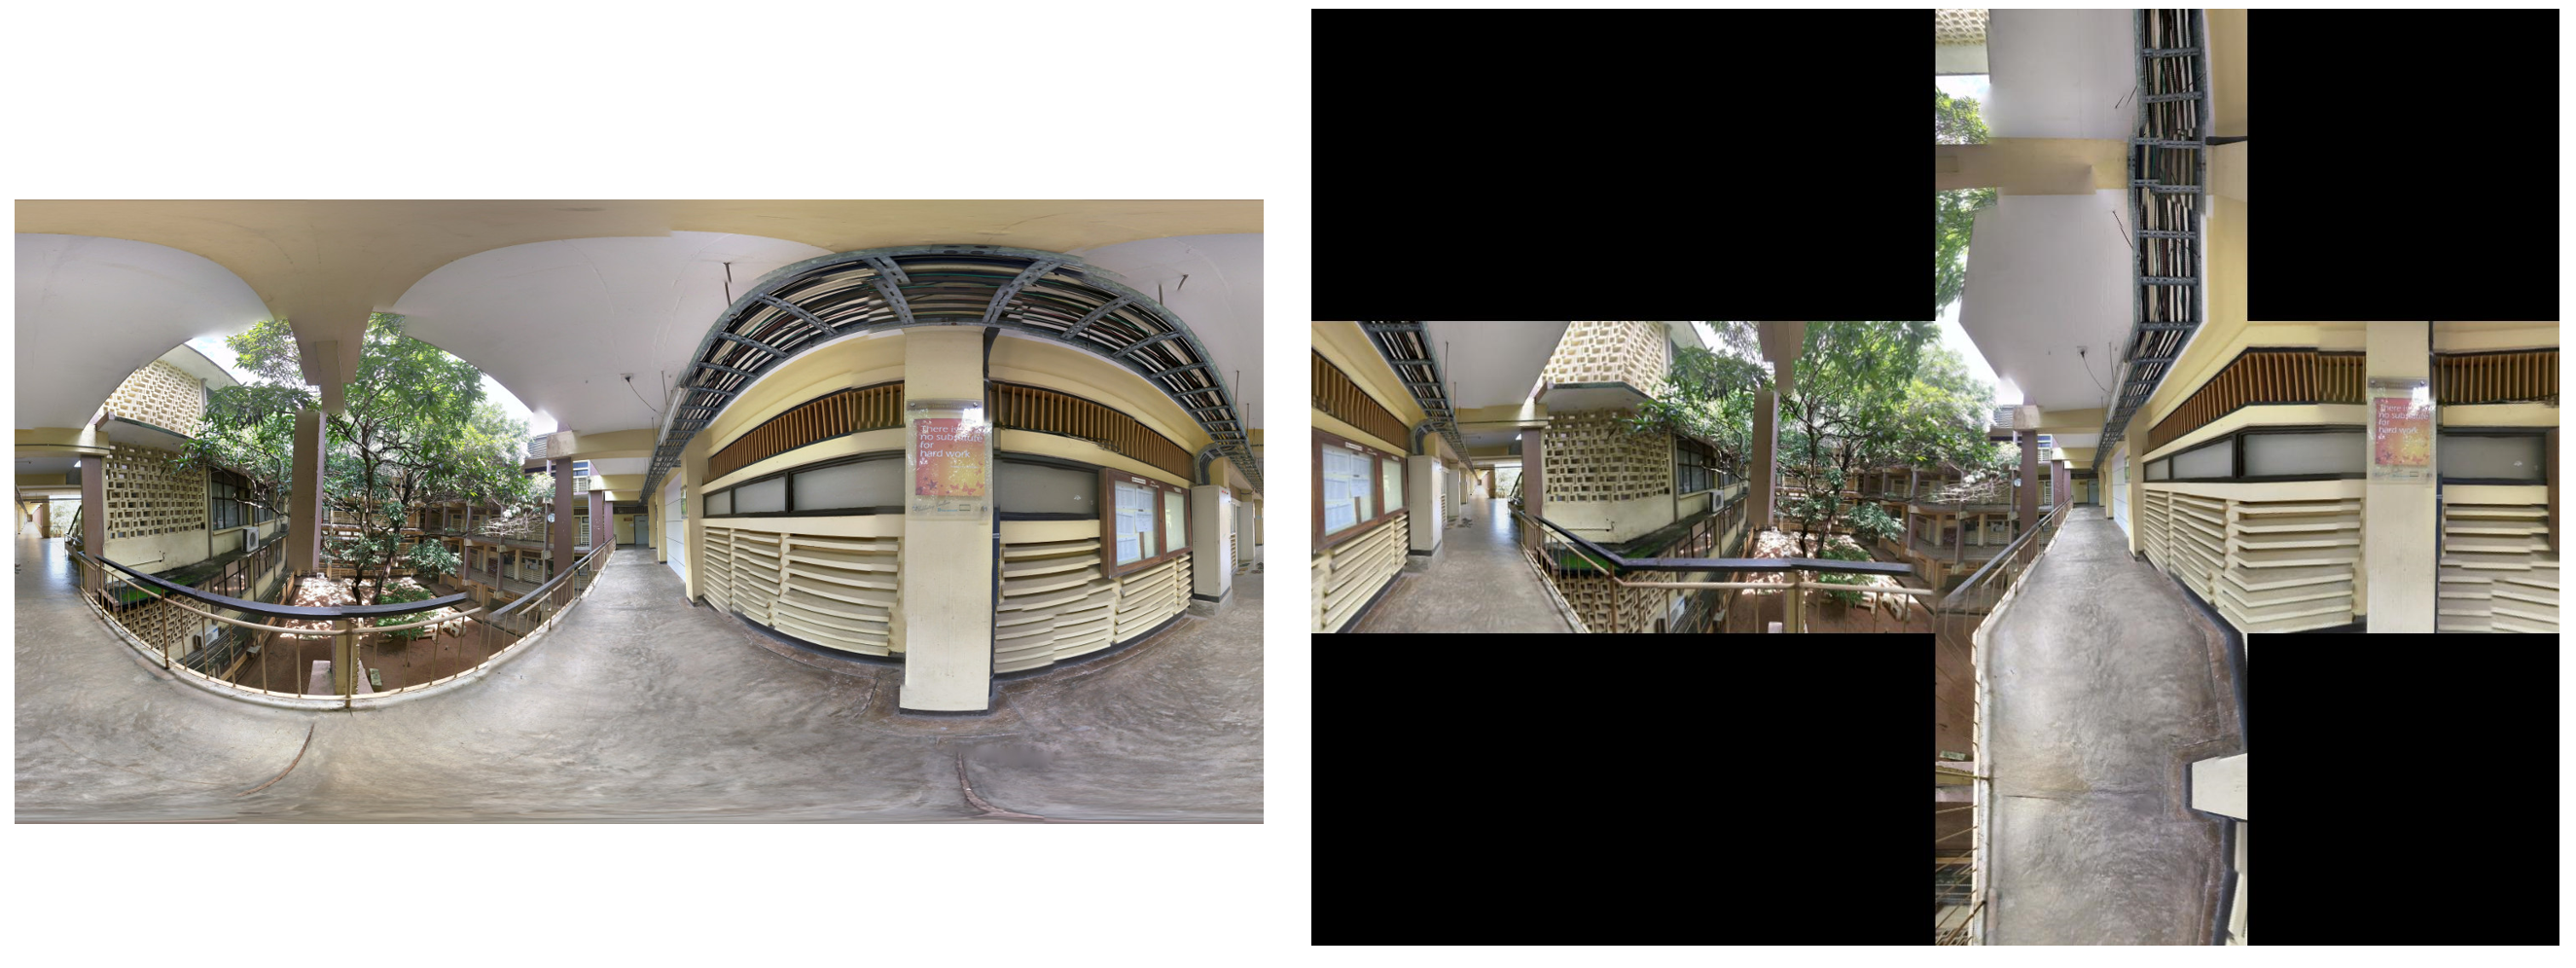
Figure 3. Equirectangular representation of ODV on the left; cube mapped on the right.
Test Routine
Let’s dive back into the test routine followed by the Trinity College Dublin researchers.
- Encoded six ODV test files to various resolutions and data rates (each 10 seconds long). This produced a total of 75 test clips.
- Measured subjective quality
- Measured objective with multiple 2D and ODV techniques
- Measured the correlation between subjective scores and objective ratings.
Table 1 shows their findings. The metrics are specified on the left; PSNR, SSIM, MS-SSIM, and VMAF are all 2D applications of these metrics. S-PSNR-I, S-PSNR-NN, WS-PSNR, and CPP-PSNR are existing ODV benchmarks, while the results on the bottom are the Voronoi scores for each 2D metric, so VI-VMAF is Voronoi-based VMAF. The four columns to the right are different measures of the correlation between objective and subjective scores; in come cases, lower numbers are better, in some cases higher numbers are better. In all cases, VI-VMAF showed the best correlation.
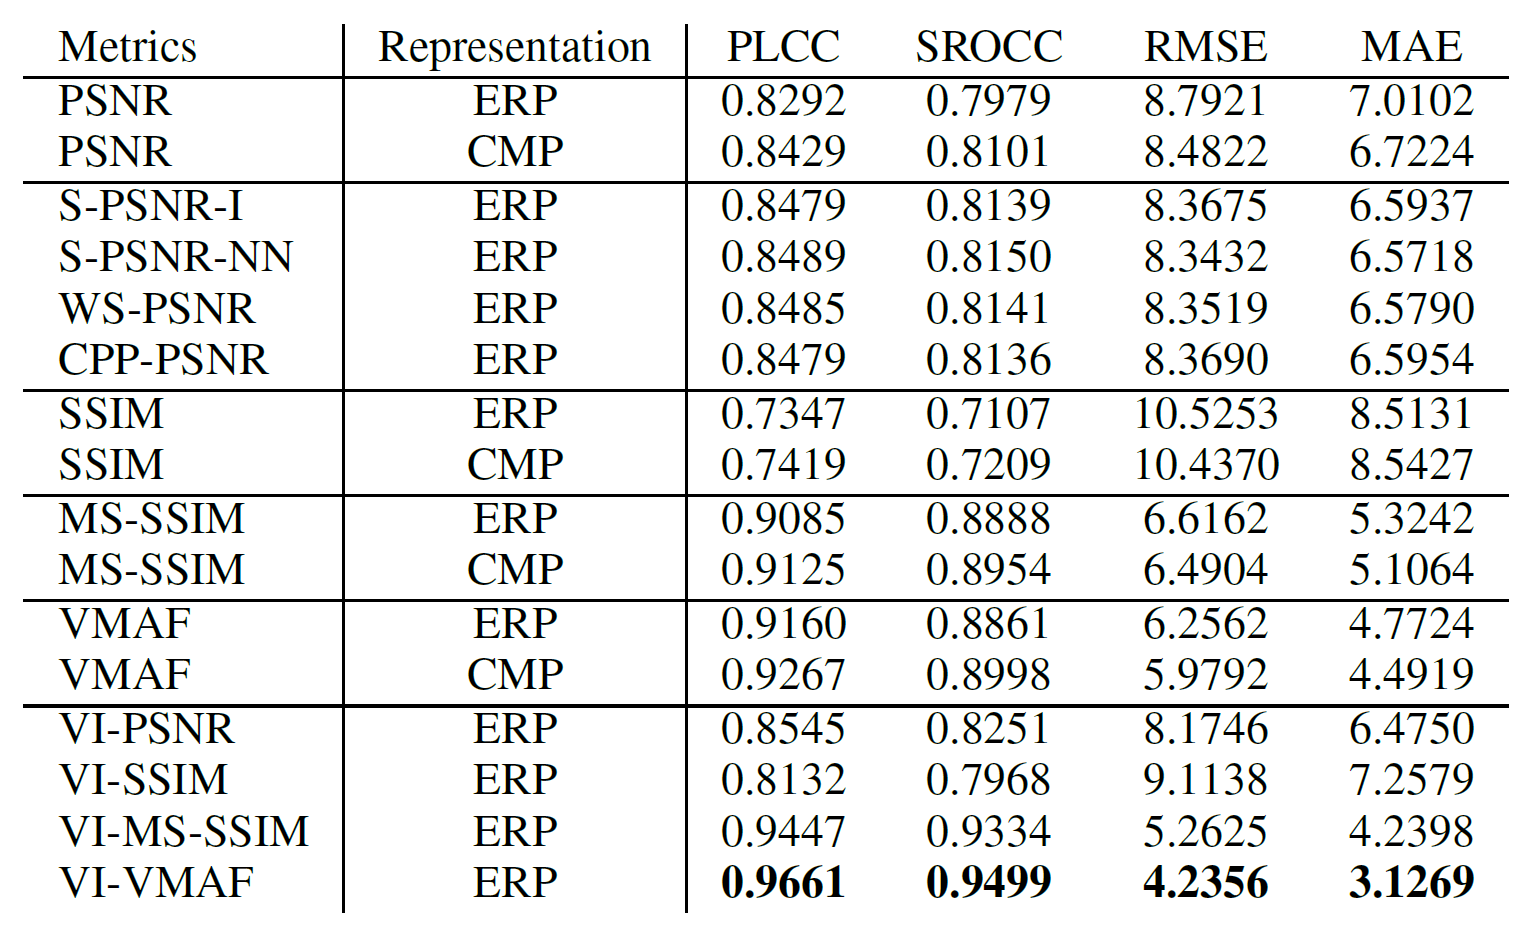
Table 1. Assessing the accuracy of 2D and 3D metrics.
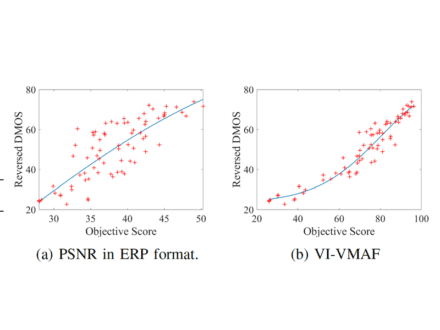
Figure 4 visually represents the accuracy of PSNR vs VI-VMAF, both in equirectangular mode. DMOS scores (differentiated mean opinion scores) are the subjective ratings on the vertical axis; the objective score is presented on the horizontal axis. If the subjective scores aligned perfectly with the objective (which they never do) you would see a single line; the further each metric’s scores vary for that line the less accurate the metric is. Since the VI-VMAF scores are much more tightly clustered around that centerline, it means that it’s much more accurate than PSNR.
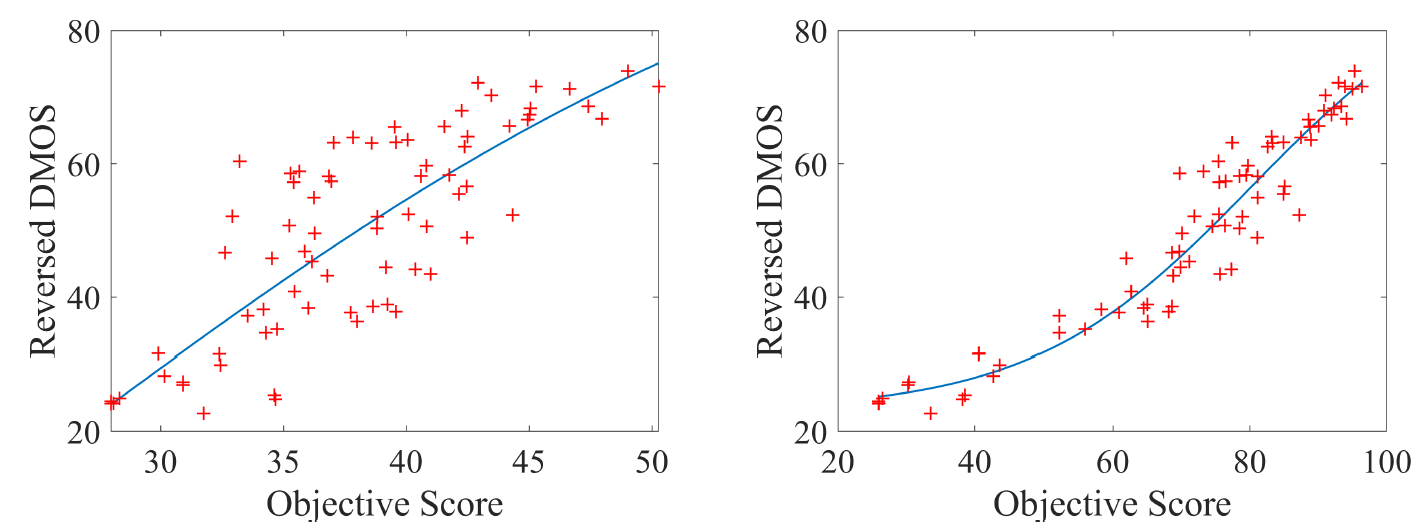
Figure 4. VI-VMAF produces a much tighter cluster than PSNR indicating greater consistency with human subjective ratings.
The bottom line is that if you’re searching for a metric to assist with configuration and encoding-related decisions relating to ODV video, VI-VMAF appears to deliver the results that align most closely with actual subjective ratings.
Getting the Voronoi Benchmarks
To run the Voronoi benchmarks, download them from this GitHub link. Click Clone or download and follow the instructions to download the zipped file to the folder where you’ll be running the benchmark.
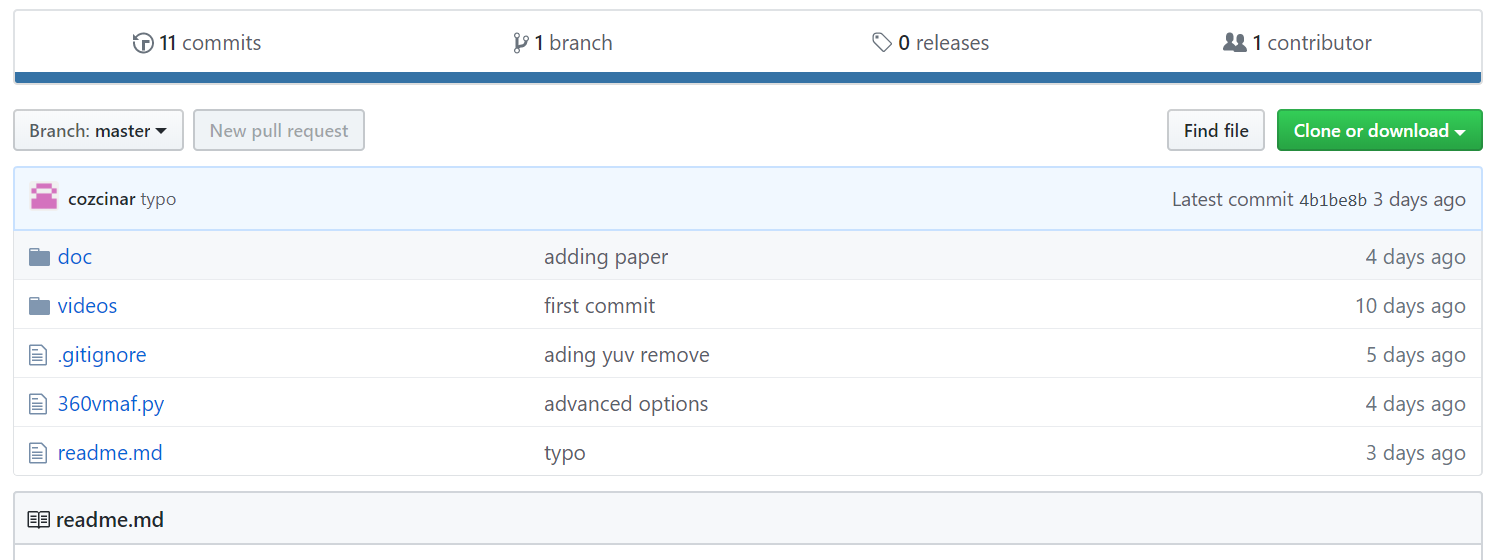
Figure 5. Download the benchmark from this GitHub repository.
The current implementation is based on Python 3, and you’ll have to install these dependencies. Once Python 3 is loaded and running, just type each line into the command line and Python should install them.
pip install wget
pip install imageio
pip install python-csv
Once you download and extract the file from GitHub (VI_VMAF_4_360-master.zip), drag the extracted files into the folder from which you’ll be running the benchmark. In Figure 6, you see that I’m running the metric from F:\VRTest. The zipped file I downloaded is still in the folder. When I extracted the zip file, it created another folder (VI-VMAF_4_360-master) from which I dragged the two other folders (doc and videos) and all other files into F:\VRTest.
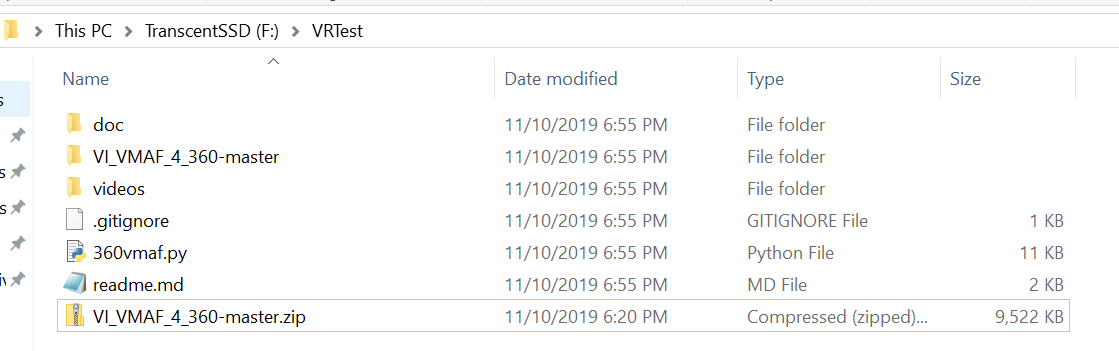
Figure 6. This is what your folder should look like after unzipping and moving the files.
You should copy your distorted (encoded) videos and the source into the videos folder. You can drag as many files as you would like into the folder so long as there’s just one source file. They must be in MP4 format or YUV format. They also must be at the same resolution as the source file so if you need to scale to the source resolution you should do that before running the tests (See Converting to a Raw Format here for instructions). Note that the doc folder contains the paper from which I grabbed most of the screens shown above.
To run the benchmark, type:
python 360vmaf.py --w 3840 --h 2160 --f 100 --r sounders2
–w: resolution width of the videos, for example, 3840
–h: resolution height of the videos, for example, 2160
–f: number of frames, for example, 100
–r: reference (original) .mp4 video name, for example sounders2.mp4. Don’t include the MP4 extension.
The script will create all intermediate files and download support files and libraries as needed, including executables for the Veronoi metric and VMAF (FFmpeg and VMAFossexec.exe) as needed and you’ll see them in the test folder once the score is complete.
The script will return two scores in CSV files to the test folder, one for VMAF and the other for VMAFossexec.exe for VI-VMAF. VMAF is calculated based on an equirectangular format. VI-VMAF is calculated based on the spherical Voronoi technique which is explained in the paper contained in doc folder and above.
Here’s what the test folder looks like after processing the single test file in the videos folder (plus the source). You see the two downloaded zip files (voronoiMetrics.zip and voronoiMetricsThirdParty.zip) plus the new folder for voronoiVMAF.
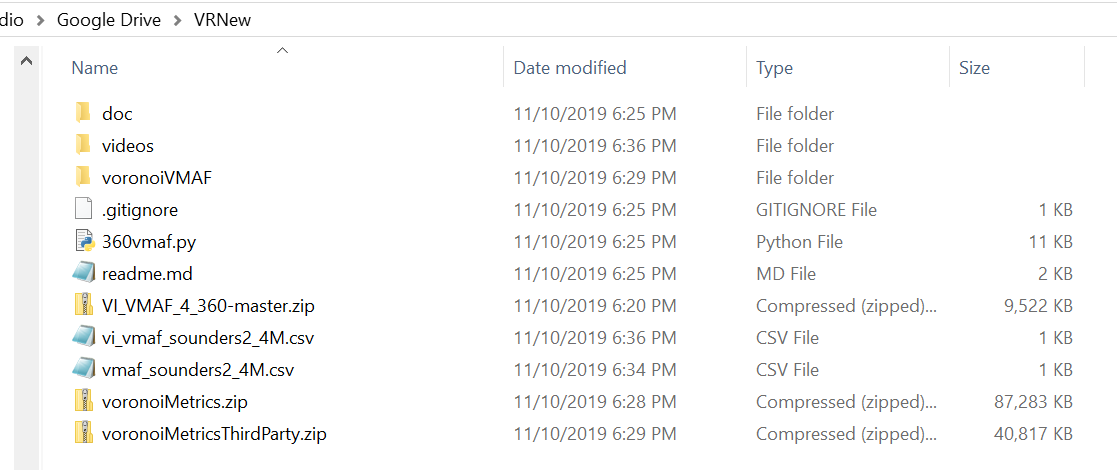
Figure 7. The test folder after processing the files in the videos folder.
You also see two csv files, with the contents of vi_vmaf_sounders2_4M.csv shown in Figure 8.
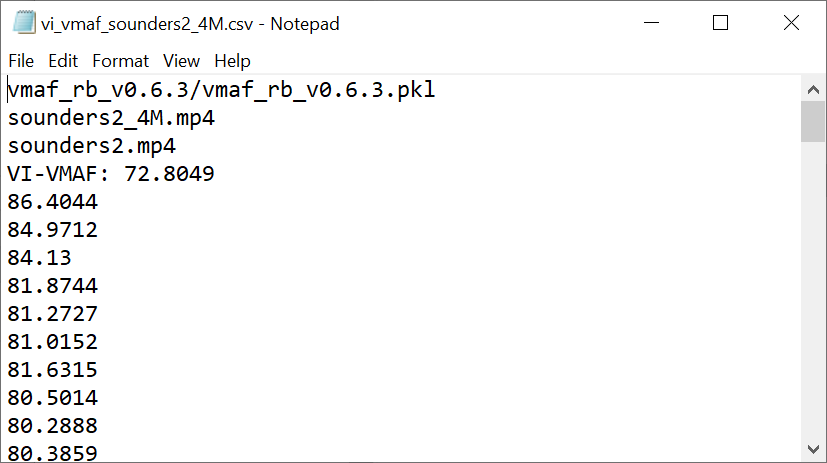
Figure 8. Voronoi-VMAF results.
I haven’t had a chance to test the VI-VMAF
For more on the pre-conference session at Streaming Media West in a few days:
W4. Objective Quality Metrics 2D & 3D: What They Are, How To Compute Them, & How To Use Them
Monday, November 18: 1:30 p.m. – 4:30 p.m.
Every compression practitioner should understand what objective quality metrics do, how to compute them, and how to use them. This workshop guides attendees through the following steps: an introduction to metrics like PSNR, SSIM, SSIMplus, and VMAF, plus several 3D metrics; how to compute metrics with open source tools like FFmpeg and VMAF Master, as well as third-party tools like the Moscow State University Video Quality Measurement tool and SSIMWAVE VOD Inspector; how to interpret the results; how to create rate-distortion curves and BD-Rate computations: and how to use these tools to choose a preset, compare codecs and encoders, build an encoding ladder, and other functions.
or more on the course, click the course image below or click here.