Streaming Learning Center Where Streaming Professionals Learn to Excel


Related Articles
This article documents two sets of tests with 8K footage; the first with two scenes from the movie Ripartenza, the second with footage from a River Plate soccer match presented as an addendum to the original article.
I met my dear friend Loren perhaps 20 years ago. When she learned I had two little girls (at that time), she smiled, wagged her finger at me and said, “little girls, little problems, big girls, biggggg problems.” Though we’ve been very fortunate with both, what she said is undoubtedly true. And when it comes to per-title encoding, the corollary is, 1080p video, little problems, 8K video, biggg problems.
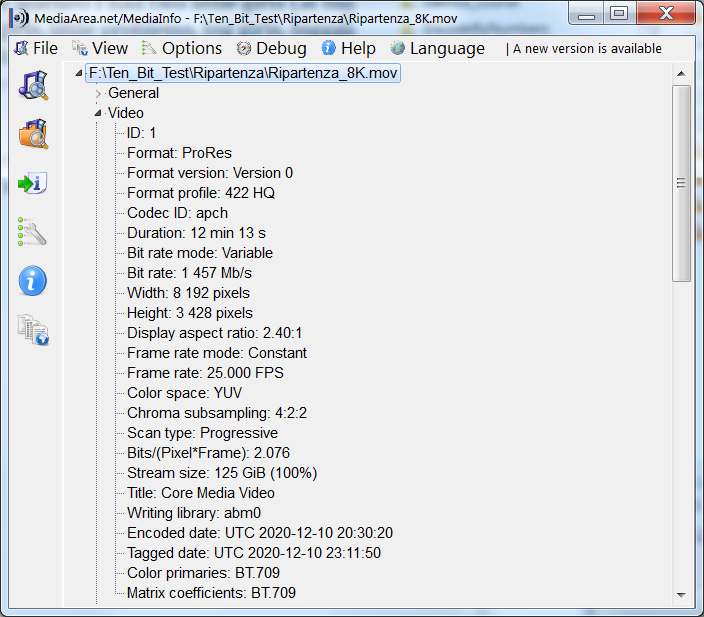
Here’s the backstory. Some folks from the 8K Industry Association saw a presentation I gave on per-title encoding and asked if I had any data for 8K. I said no. They sent an 8K file entitled Ripartenza. Figure 1 shows the MediaInfo data; it’s a 25 fps 8K file in ProRes 422 format with a 10-bit color depth, but uses the BT.709 color primaries so the version I got is not HDR.
Contents
Figure 1. The first source file.
I played the file and carved out two segments; one a talking head, the other some ballerinas dancing around a basketball court. I extracted the two 30-second segments using this command, which seeks to the start of the dance sequence (-ss 00:06:30) and copies thirty seconds (-t 00:00:30) of the audio and video.
ffmpeg -y -ss 00:06:30 -i Ripartenza_8K.mov -c:v copy -c:a copy -t 00:00:30 Ripartenza_ballet_source.mov
This created two source files, one low motion, the other high motion. Then I used the following FFmpeg command to encode the two sources using x265 with ten-bit output and the CRF 25 quality level. To explain, CRF is an encoding mode that varies the data rate to achieve the target quality. In this type of application, CRF provides a measure of the complexity of the source file; the higher the data rate the harder the file is to encode.
ffmpeg -y -i Ripartenza_ballet_source.mov -c:v libx265 -an -crf 25 -pix_fmt yuv420p10le Ripartenza_ballet_CRF25.mp4
Then I measured quality using the PSNR, SSIM, and SSIMPLUS metrics. I tried VMAF but 32 GB of memory on my HP Z840 workstation proved insufficient. Note that these are SDR metrics because the file I received was SDR.
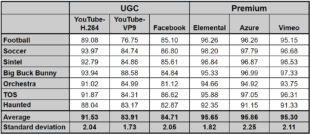
Table 1 shows the results in terms of data rate and metric scores. We see a 300% delta in data rate, with the dance clip at 7.8 Mbps and the Talking head at 2.5 Mbps. In theory, if CRF worked perfectly, the metrics should have been close to identical; with SSIM and SSIMPLUS they were, but with PSNR they varied significantly. That said, with PSNR, values above 45 dB are typically indistinguishable to the viewer, so the difference between 52.69 and 61.63 would be visually irrelevant. As noted here, SSIM scores above 0.99 would show imperceptible artifacts and predict that human viewers would rate video quality as excellent.
The SSIMPLUS score was the Encoder Performance Score (EPS) that “assumes that the source asset is pristine and focuses solely on measuring the degradation introduced by encoder impairments.” I used this rather than the SSIMPLUS Viewer Score (SVS) because SSIMWAVE doesn’t currently compute SVS on videos larger than 4K. With both SSIMPLUS metrics, any score above an 80 would be ranked as excellent quality by a subjective viewer, so the EPS score was quite good and confirms the SSIM score.

Table 1. 3x higher data rate is needed to deliver relatively similar quality.
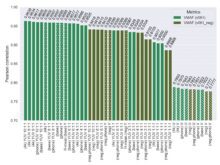
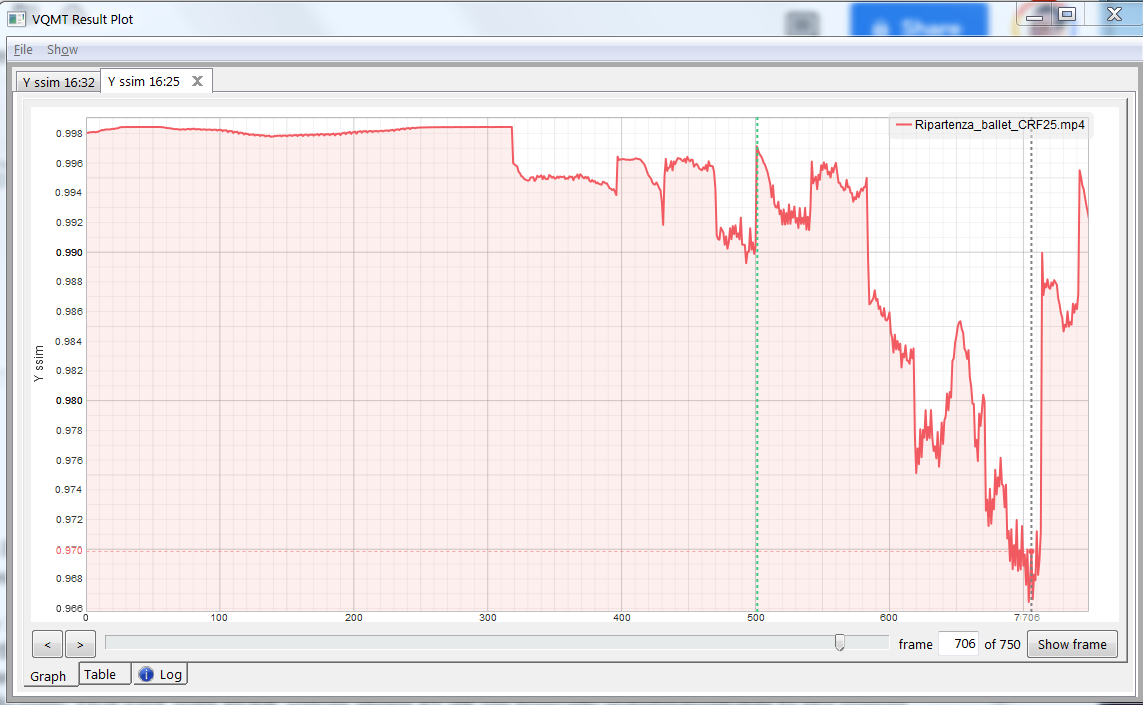
I know there’s some skepticism about using metrics to predict subjective quality, but one of the great features of the Moscow State University Video Quality Measurement Tool that I use is the ability to see the score over the duration of the file and then examine the frames at any point in the video. You see this in Figure 2, which tracks the SSIM score frame-by-frame over the duration of the file and shows that the lowest score in the dance clip was around frame 706.

Figure 2. The VQMT plot showing the SSIM score over the duration of the ballet clip.
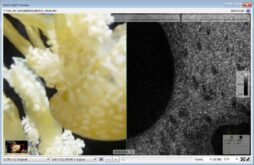
If I drag the playhead to that frame and click Show frame in the lower right, the tool presents the frames as shown in Figure 3 and I can toggle between the source and encoded frame to view even subtle differences. As the SSIM score predicted I saw very little differences between the source and encoded frames. Note that the SSIMPLUS VOD Monitor that I use has a similar feature for viewing the score over the duration of the file and checking frame quality (see video here).
Figure 3. Comparing the source and encoded frame.
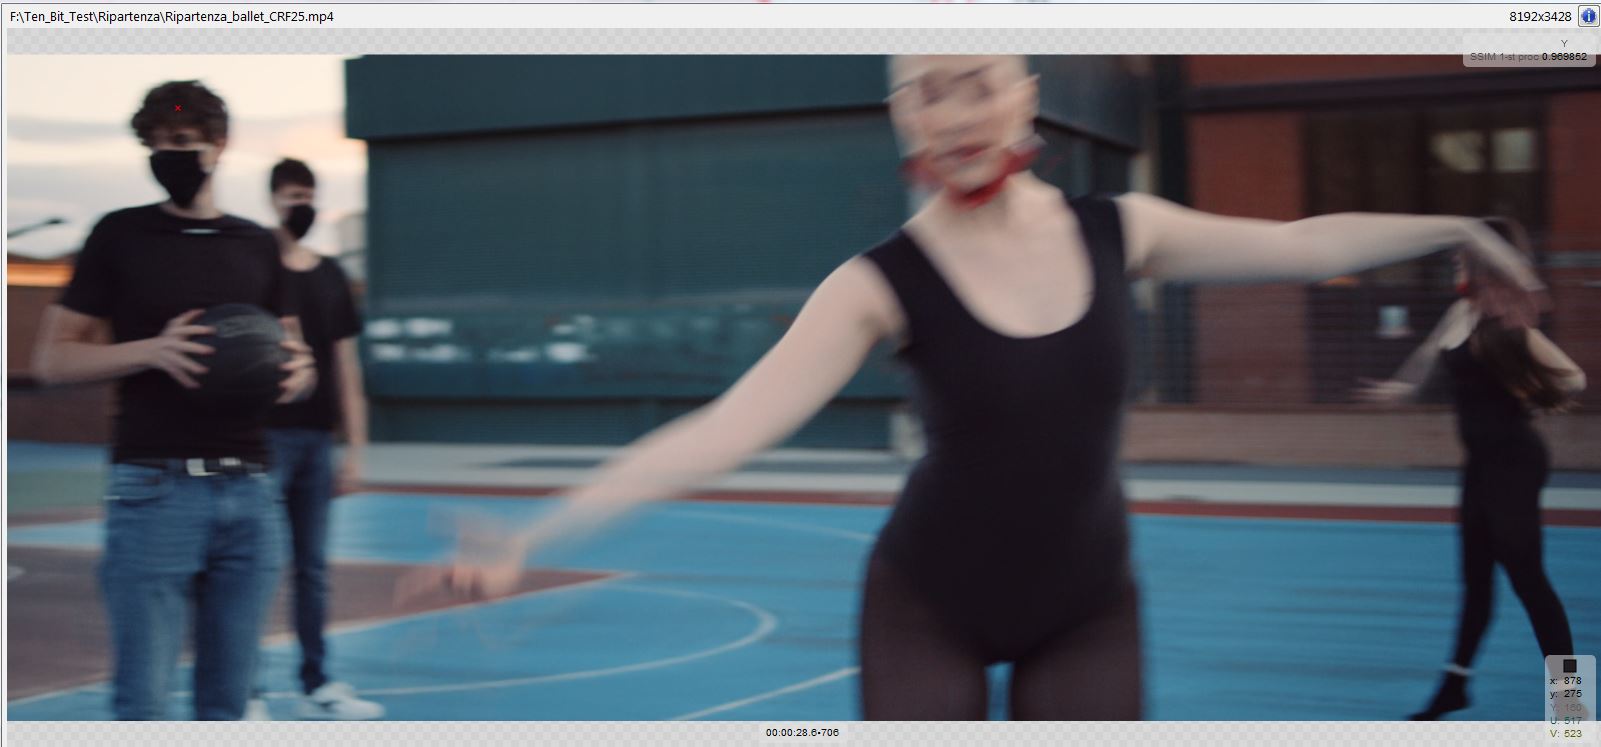
I should note that Figure 3 shows why the overall 8K data rates were unexpectedly low. Not only was the source 25 fps rather than 50 or 100 fps, but the shutter speed was also relatively slow, blurring the frames a bit during high motion scenes and making the video easy to compress. Overall, the video was beautifully shot with a narrow depth of field, again contributing to low complexity. As you’ll see next, if you encode an 8K soccer match at 100 fps the required data rates could easily be five to six times higher.

But Wait, There’s More
After reviewing these findings with the folks from the 8K association we decided to ask around for an additional clip with more dynamic footage. Harmonic, Inc was able to provide highlights from a soccer match they produced between Club Atletico San Lorenzo and Club Atletico River Plate. This is a 59.94 8K file with BT.2020 color primaries. I checked, and there were no relatively low motion sequences in the highlights; it was action and drama from start to finish. So, there was no way I could compare high and low motion sequences as I did with the first clip.
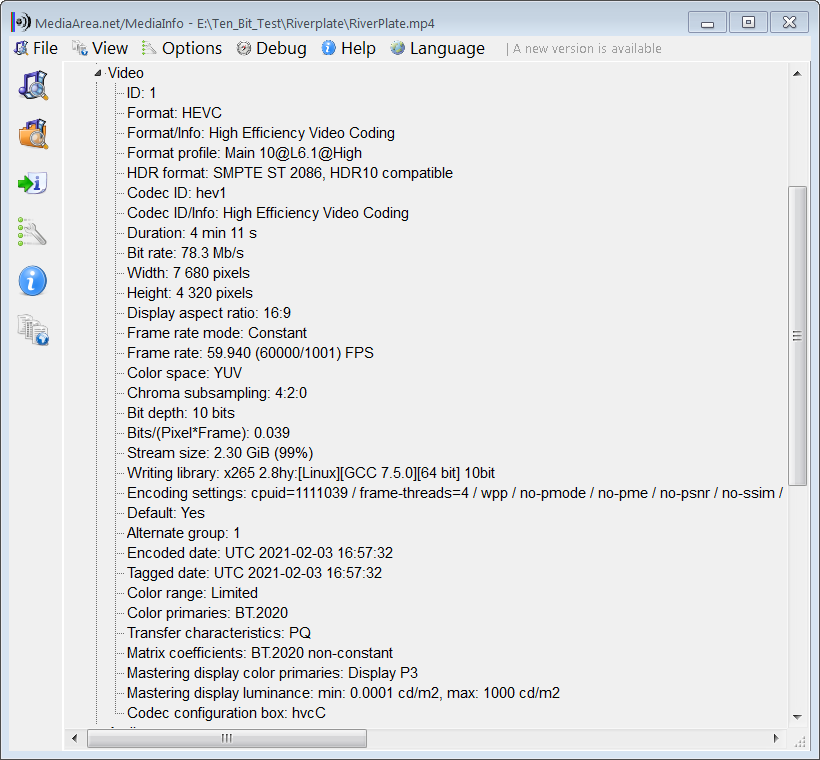
Figure 3. The second source file.
Here’s where things get apples and orangey, though hopefully not distractingly so. I extracted thirty seconds of footage from the soccer match as shown above, and then encoded it to Rec 2020 using this command string.
ffmpeg -y -i Riverplate_source.mp4 -c:v libx265 -crf 25 -pix_fmt yuv420p10le -color_primaries 9 -color_trc 16 -colorspace 9 Riverplate_CRF25.mp4
Then I computed PSNR and SSIM for the soccer match using HDR versions of each metric from the Moscow State University Video Quality Measurement Tool version 13, which is brand spanking new, and presented the results along with the talking head segment from Ripartenza in Table 2. I also computed the SSIMPLUS score using the HDR option.
You see that the data rate of the soccer clip is almost 18 times higher than the talking head sequence and the metric scores are lower, significantly so for PSNR, but to an insignificant degree for SSIM and SSIMPLUS. By comparison, with 1080p video, most simple talking head footage looks great at 2.5 – 3 Mbps while action sports requires about 6-9 Mbps. a delta of around 1:3.
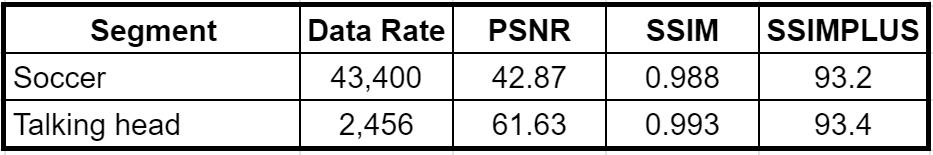
Table 2. 17x higher data rate is needed to deliver lower quality.
I understand that the metrics are fundamentally different, and at this point, I can’t say how the HDR versions of PSNR and SSIM translate to subjective observations. I did compare the frames as described above and saw very little difference between the source and encoded soccer match.
It’s also apparent that comparing HDR and SDR footage is inherently flawed for a number of reasons, including that even if the metric scores are similar, HDR footage viewed on an HDR TV should look better than SDR footage viewed on an SDR TV because of the increased brightness and expanded color palette. It’s also unclear at this point if HDR PSNR and SSIM scores mean the same as SDR scores. I can say with absolute certainty that if you encoded the Talking head sequence to 43.4 Mbps, it wouldn’t look noticeably better than it did at 2.5 Mbps and you’d be wasting a heck of a lot of bandwidth.
The Bottom Line
Producers seek to deliver a certain quality level as efficiently as possible. Not surprisingly, the data rates necessary to deliver that quality, which varies significantly by source video for 1080p, varies even more for 8K because of the differences in frame rate and dynamic range. If you use a fixed bitrate ladder, it will have to be excessively high to achieve the necessary quality in hard-to-encode clips, making it a total waste for easier-to-encode clips.
Beyond per-title, producers should explore extending the traditional 200% constrained VBR maximum to 300% or higher. That’s what would have been necessary to achieve good overall quality had the two source sequences been contained in a single clip, which of course, they were.
Finally, there are people who very savvy about HDR metrics, but I am not one of them. There are many outstanding issues about which metrics to apply and how much to rely on them. We do know that you shouldn’t use SDR metrics to gauge the quality of HDR video (see, Diagnosing Visual Quality Impairments in High Dynamic-Range/Wide-Color-Gamut Videos, Benchmarking of objective quality metrics for HDR image quality assessment, and Practicalities of predicting quality of high dynamic range images and video). We also know that VMAF hasn’t been trained on HDR so it’s unclear whether VMAF will accurately predict subjective evaluations of HDR videos.
As mentioned, version 13 of the Moscow State University Video Quality Measurement Tool debuts several HDR metrics. However, the most proven HDR-capable metric is SSIMWAVE’s SSIMPLUS, which has Dolby certification and has been extensively tested to ensure that HDR ratings match actual subjective ratings to a high degree.