 Streaming Learning Center Where Streaming Professionals Learn to Excel

Related Articles


Consider this beta version 0.9 of my algorithmic view of how codec markets are penetrated. There are lots of assumptions that I’ve tried to document in the readme tab of the Excel file you can download below. I assume there will be errors in both math and assumptions. If you find one, please contact me at jan.ozer@streaminglearningcenter.com and let me know.
I think a lot about how long codecs take to deploy. Ask when AV2 will matter to premium publishers outside the Alliance for Open Media, and I might casually say, “Not until 2032 at the earliest.” Cue outrage and accusations of negativity and bias.
But that date depends on many assumptions. Some, like device replacement cycles, can be grounded in data. Others, like the share of phones shipping with AV2 hardware decoding in 2028, require educated guesses.
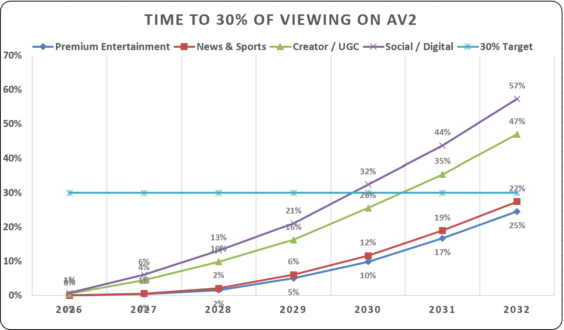
This weekend, I built a model to make those assumptions explicit. It allows users to compute when the addressable share of viewing relevant to their distribution schema will accumulate to a configurable target. For some premium content publishers that might be 30%. For social media hyperscalers, it might be 15%. The featured image above this article shows the AV2 results for four publisher categories with different viewing mixes across living-room devices, computers, and mobile devices. The target, in blue, is 30%.
The Excel workbook lets you change the assumptions and see how they affect when a codec reaches your target share of viewing. This article serves as its manual and you can download it at the bottom of the article.
I should start by paraphrasing Tip O’Neill and stating that all target markets are local. Many TVs sold in Brazil now have VVC decoders. Ditto at least two phones in China. Unless you’re distributing video to Brazil and China, these numbers are irrelevant. Compute the installed base within your actual target market.
Let’s jump in.
Contents
Publisher Categories
The model follows four publisher categories, each with a different assumed distribution of viewing across living-room devices, mobile devices, and computers. You can access the different markets using four corresponding tabs in the spreadsheet.
| Publisher category | Typical content | Living room | Mobile | Computer |
|---|---|---|---|---|
| Premium Entertainment | Streaming TV, films, full live sports and events, 24/7 live/linear channels |
75% | 20% | 5% |
| News / Publisher Video | Reports, highlights, interviews and clips on news, sports and publisher sites/apps |
15% | 60% | 25% |
| Creator / Long-form | Creator videos and livestreams watched by choice: tutorials, reviews, podcasts | 45% | 40% | 15% |
| Social / Short-form | Feeds, reels, shorts and stories | 5% | 85% | 10% |
These percentages are starting assumptions, not set in stone. They represent shares of viewing, not shares of devices or viewers. These numbers are in the spreadsheet, but publishers can and should replace them with their own data.
Codec economics consulting
You're about to make a seven-figure codec licensing decision. Are you sure you've accurately estimated the EBITDA impact?
Our codec economics service models the EBITDA impact using your ladders, your encoder, your delivery costs, and your royalty exposure. The most accurate estimate you can get.
Learn how it works →As you can see, premium entertainment is most viewed on living-room devices, which requires hardware decoding. This requirement and long replacement cycles pushes codec availability much further out than the other distributions. News / Publisher Video is mobile-first, with only 15% of viewing in the living room.
Creator / Long-form splits between the TV and mobile, while Social / Short-form is overwhelmingly mobile (85%) Software decoding can provide an earlier deployment path on those endpoints, subject to performance, browser support, and the publisher’s willingness to use it.
Choosing a Target
As mentioned, the target is the addressable share of viewing that make the expenses related to new codec adoption, including additional encoding, storage, royalties, and many others financially worthwhile. You don’t add AV2 because a single endpoint can support it.
At its core, the spreadsheet works you through details that allow you to predict this accumulation. As you can see in Figure 2, all categories have a target (30%). It’s nothing magical; all it does is set the horizontal line set in the image atop this article.

Color Coding
Figure 3 shows the color coding for the cells in all tabs. Yellow cells are for your input. They’re all populated already, but you should work through every yellow cell in each sheet and enter your own data.
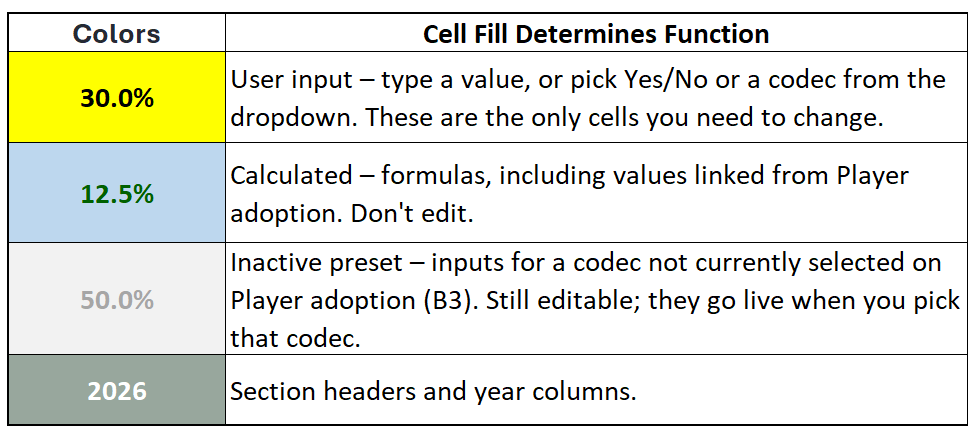
Blue cells are computed from the data entered in the yellow cells. Blue cells are all formulas, and if you change them, you’ll break the spreadsheet.
Cells that are grayed out relate to one of the two unselected codecs. You can enter data into them when grey, but they don’t contribute to the output until that codec is selected. Finally, green cells are headers.
Basically, when you open a tab, enter your data into the yellow fields. Everything else is automatic.
Player Adoption Tab
The Player Adoption tab is the workbook’s shared input layer. It translates assumptions about AV1, AV2, or VVC support into the endpoint-level capability curves used throughout the four distribution models. Figure 4 shows an overview of the tab. The three red numbers show critical inputs.
- 1 = Choose the active codec. This controls the codec for this sheet and all distribution profiles.
- 2 = Choose the replacement cycle for the listed devices.
- 3 = Choose the starting year if not 2026.
Below and to the right of these entries are cells with a blue background. These are computed from the data entered below. This is the data that feeds the distribution tabs like Premium Entertainment. Don’t touch these formulas.
Below the blue cells are three sets of entries, one for AV1, AV2, and VVC. The cells for the selected codec appear normally, the unselected codecs are greyed out. In Figure 4, AV2 is selected so VVC and AV1 are greyed out.
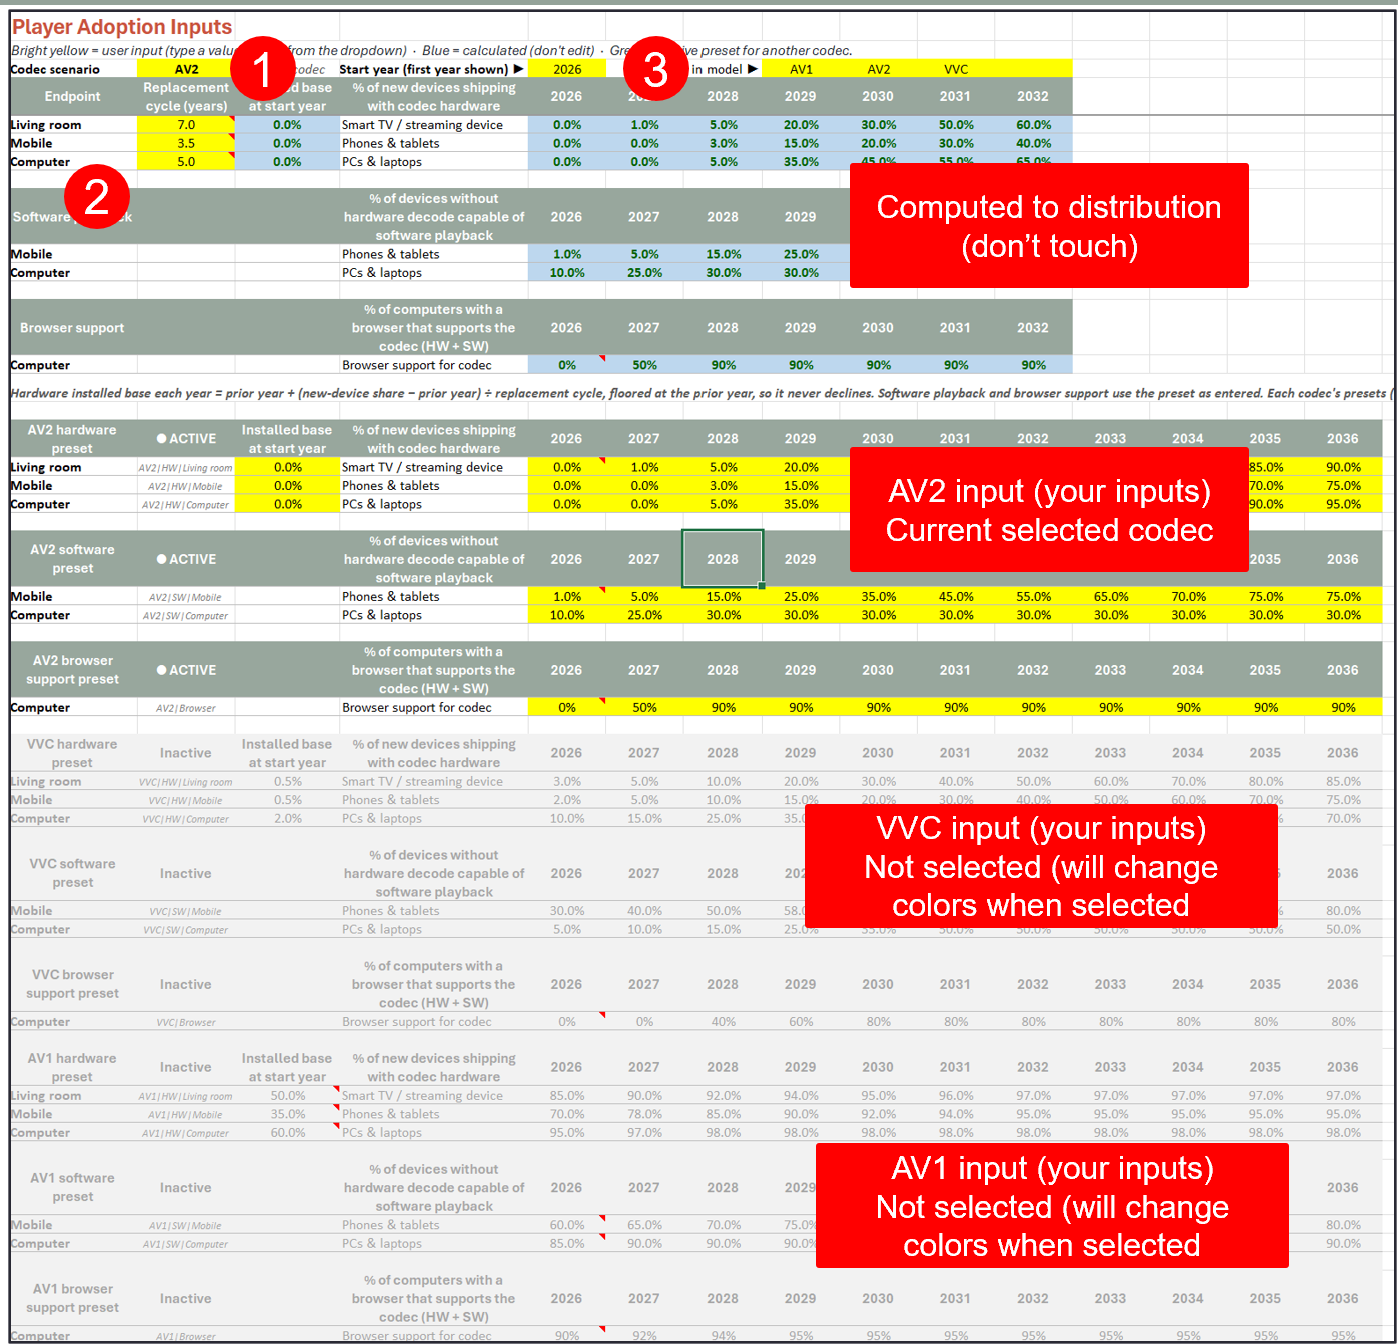
In this view, enter playback data into the cells with a yellow background shown in the AV2 section.
Player Adoption Inputs
Figure 5 shows the Player Adoption inputs for AV2. Note only two years are shown; the full preset block contains 11 years (2026 to 2036) of scenario data, while the top calculation rows display the active 7-year projection window.
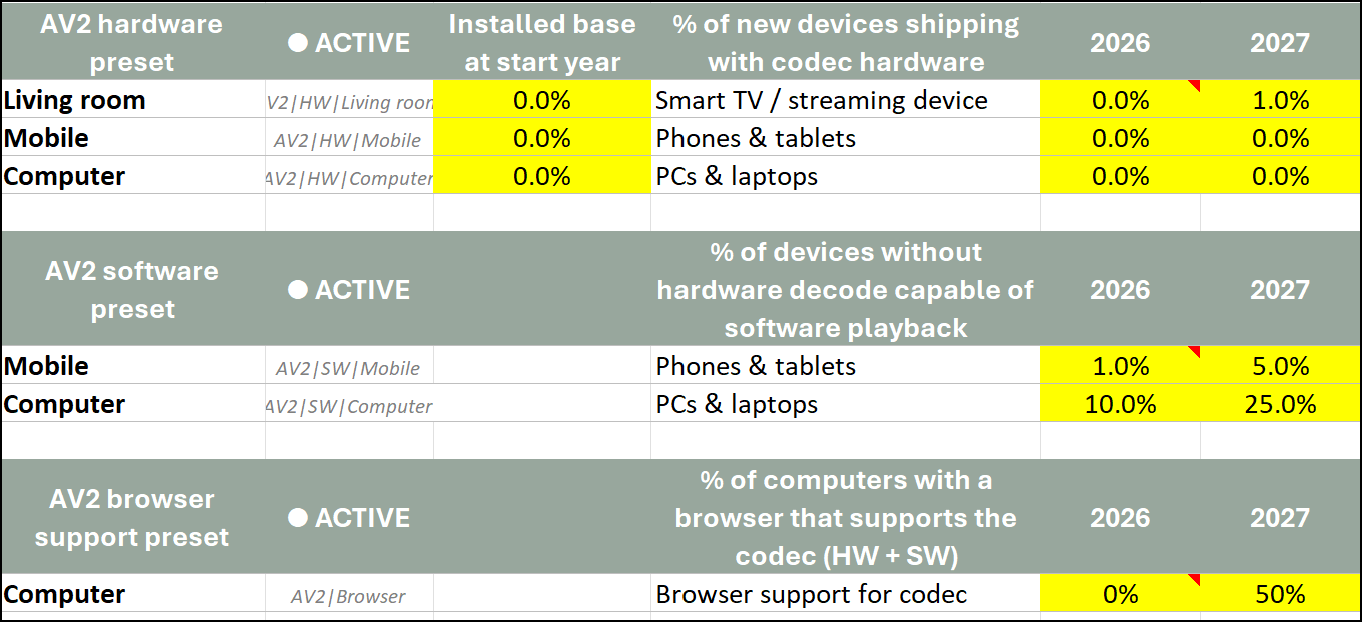
Users select a codec, then enter or revise the yellow cells for three related adoption paths:
- Hardware decode in new devices.
- Software playback on devices without hardware decode.
- Browser support for computer playback.
The screenshot shows the AV2 starting assumptions. They are editable scenario inputs, not claims about measured market penetration.
Hardware Decode
The top block estimates the share of new devices shipping with dedicated codec hardware each year. It separates the three logical endpoints, living room (Smart TVs and dongles), mobile devices, and computers. Users should enter their estimates of the % of devices that will ship in that year with hardware support for the selected codec.
For each endpoint, the user also enters an estimated installed-base share at the model’s start year. In the AV2 example, the starting installed base is set to 0% for all three endpoints.
Once you input your estimates, the model uses the annual new-device input plus the endpoint-specific replacement cycle described above to calculate the portion of the active viewing base that becomes hardware-capable over time.
A 1% AV2 hardware assumption for living-room devices in 2027, for example, doesn’t mean 1% of all CTV viewing becomes AV2-capable that year. It means 1% of new smart TVs and streaming devices are made available with AV2 hardware. The active installed base then accumulates that capability gradually as devices are purchased and older devices are replaced.
Software Playback
The second block addresses devices without dedicated codec hardware. For mobile and computer endpoints, the user enters the share of the non-hardware population that can play the codec acceptably in software. These are challenging numbers and will vary by publisher and publisher category. So, 720p30 might be acceptable for UGC or social media, but not premium content. Or software playback might be acceptable for Netflix (since it was for AV1), but not Disney.
For AV1, in 2024 Google was quoted as stating that, “Most devices can decode 720p30 [AV1] in software using dav1d.” Regarding AV2, in May 2025, VideoLAN president Jean-Baptiste Kempf stated that “AV2 decoding is roughly five times more complex than AV1 decoding. In practice, which means software running on today’s hardware will struggle to decode AV2 in real time without careful, architecture-specific optimization.” How does that translate to AV2 addressability in current Android hardware? Your estimate is as good as mine.
For VVC, we know that services like Tencent are currently distributing VVC to mobile, though they don’t specify which devices or with what success. We also know that an open-source player from Ittiam is coming. At IBC 2026, Qualcomm, Alibaba, and NHK demonstrated live 1080p30 VVC capture, software encoding, Wi-Fi transmission, software decoding, and display between Qualcomm-powered mobile devices. The demonstration established feasibility on the selected devices, but how they translate to the installed base is unknown.
These values apply only to devices without hardware decode. That prevents double-counting: devices already counted in the hardware-capable population do not also receive a software-playback contribution.
The fact that devices with hardware decode is excluded is significant. Hardware decoders are typically installed in the most powerful and expensive phones that don’t really need it. The high-end iPhones equipped with AV1 decoders worked fine without them. When estimating software-playability, you have to exclude these phones from your estimates since they’re already included.
To explain further, a mobile software value of 5% in 2027 tells the model to assume that 5% of mobile viewing on devices without AV2 hardware can play the selected AV2 software profile acceptably. It does not mean 5% of all phones have AV2 hardware, nor does it mean 5% of all mobile viewing will necessarily be served AV2.
Browser Support
The third block applies only to computer viewing. On computers, browser support typically determines whether a service can practically use a codec, via either software or hardware decoding.
This was one factor that hindered HEVC adoption for computer playback. HEVC was finalized in January 2013, but Chrome didn’t add HEVC playback support until September 2022, nine years and eight months later. In contrast, AV1 was finalized in March 2018, and Chrome added beta support in October 2018, about seven months later.
VVC was finalized in July 2020 and still isn’t supported in Chrome’s standard media pipeline, more than six years later. Until it is, publishers focused on computer browser playback will have trouble deploying it as a primary codec. Even if a computer has VVC hardware decode, that capability isn’t available to browser-based publishers unless the browser recognizes VVC and exposes it through its media pipeline. A publisher could use a WebAssembly decoder or require a standalone application, but neither is a practical replacement for native browser support in mainstream consumer streaming.
The workbook applies browser support after it calculates computer hardware or software eligibility. If browser support is zero, the model doesn’t count computer viewing as addressable even if the device itself could decode AV2 in hardware or software. If browser support is 50%, only half of otherwise eligible computer viewing is counted.
Player Adoption Reality Check – the Input Comparison Tab
The Input Comparison tab shows comparisons for all three codecs for all six inputs, enabling a quick reality check of your data. You see this in Figure 6, which estimates the share of mobile devices without hardware playback that successfully play each codec in software. Not surprisingly, AV1 is on top, but some may be surprised that VVC has a substantial lead over AV2. Of course, that’s because, as mentioned, AV2 is 5 times more complex than AV1, while VVC has been deployed for mobile software playback in China for several years.
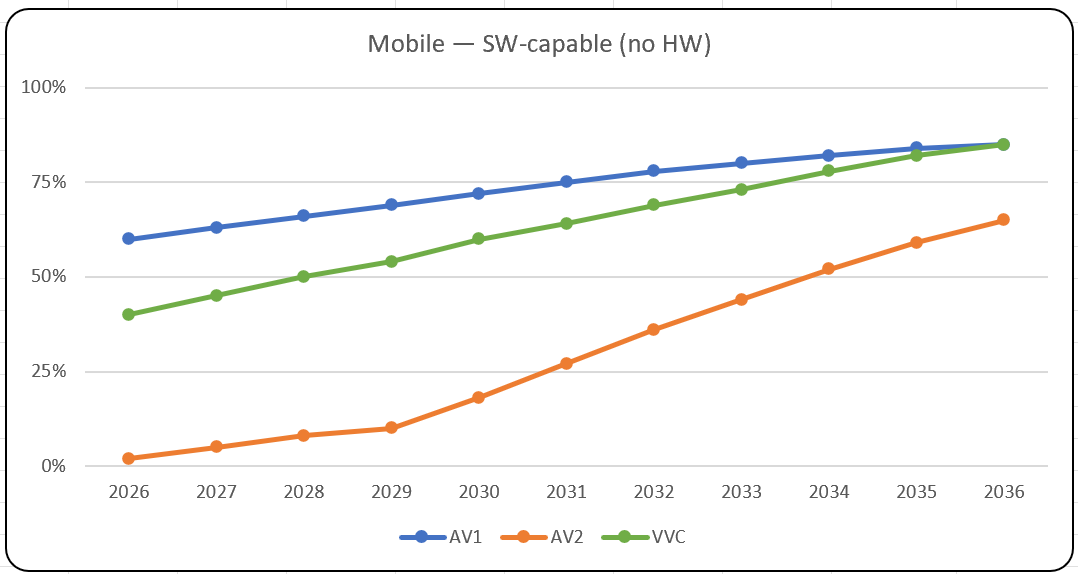
You could also look at the chart and say that the longer term assumptions about mobile playback are all too low, and surely will come close to 100% by 2036. All fair game, I find visual representations of the data useful for finding inconsistencies and inaccuracies so included them.
Distribution Profiles
You’ve entered all the common data; now it’s time to enter data relating to the four distribution profiles in the spreadsheet.
- Premium Entertainment
- News / Publisher Video
- Creator / Long-form
- Social / Short-form
The reason I included distribution profiles was to account for variances in platforms utilized, resolutions, and concerns over QoE that might dictate enabling or disabling certain platforms depending upon the service. For example, Premium Entertainment leans towards living room viewing, which is hardware-playback only, DRM is critical, and QoE is paramount.
Social media is mobile centric, DRM isn’t a factor, and QoE is less critical. These factors combine to mean that whatever your critical mass target is, social media can reach it much more quickly than Premium Entertainment.
All distribution tabs have similar inputs, with the overview shown in Figure 7. Here are some pointers.
- 1 = Selected codec is in the title. This comes from the Player adoption tab and you can’t change it here.
- 2 = target share of viewing. This controls the target in the chart on the right. Not the chart in the Summary tab covered below
- 3 = Distribution check. Just makes sure that the numbers in the three distribution platforms equal 100. Turns an alarming color if they don’t.
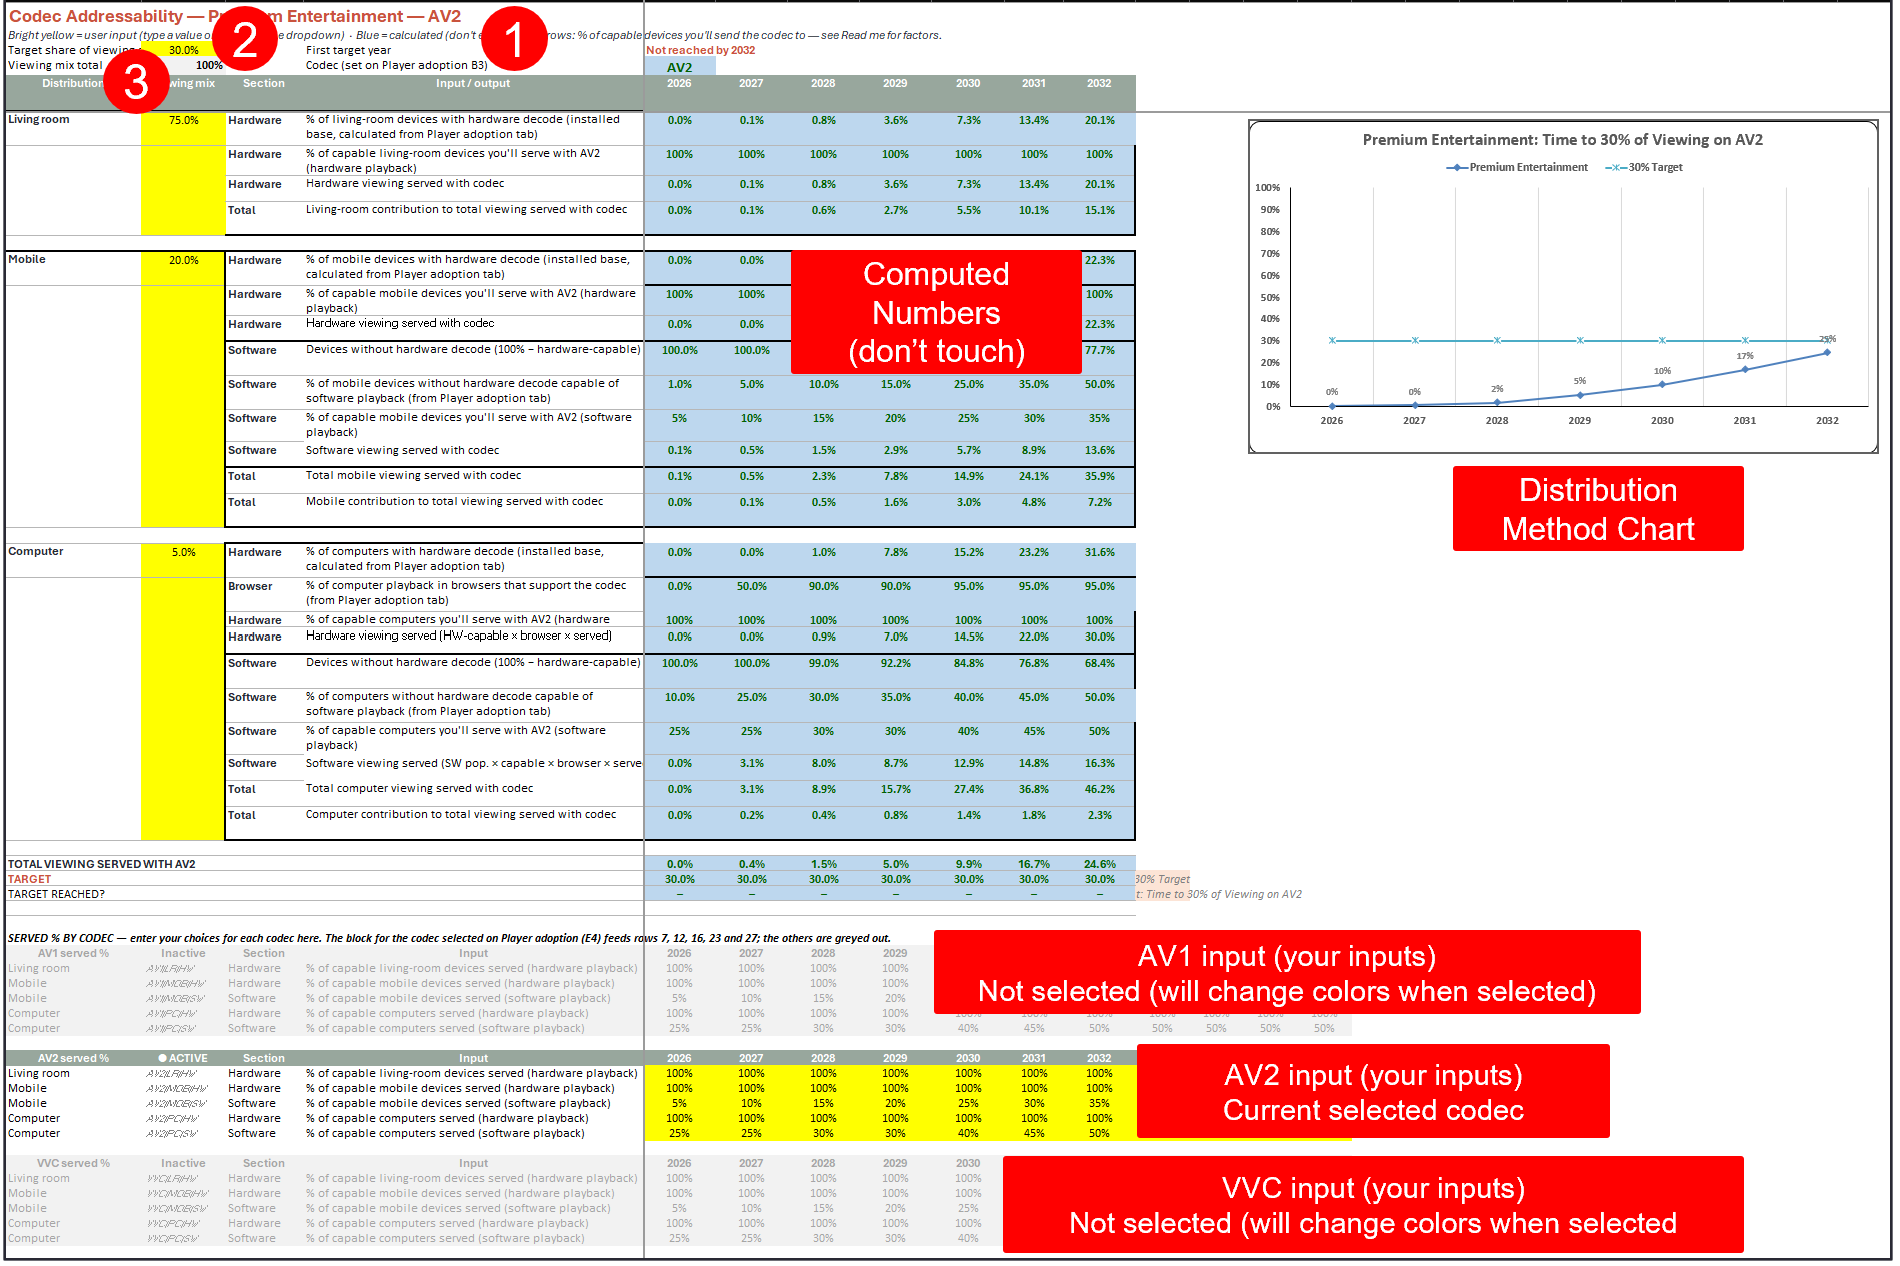
On all four distribution tabs, there are two classes of entries. On the left is the viewer distribution by device, which services should customize for its viewing patterns.
On the right are percentages of available devices that the service will actually deploy, which is divided into five classes:
- Living room (which is only hardware)
- Mobile hardware decode
- Mobile software decode
- Computer hardware decode
- Computer software decode
On top you see the computed numbers are all in blue. Don’t touch them. Instead, enter the details for each codec in the three regions below, just like you did for codec specific data in the Player adoption tab.
We designed it that way because some numbers will vary by codec. For example, you might enable 100% of capable mobile devices to play AV1, but only the top tier of devices, say 15%, to play AV2. Once you specify these numbers by codec, you can switch from codec to codec without having to update any data fields.
Speaking of them, let’s cover them as shown in Figure 8. There are 11 years of figures, but I’m showing only two. Let me be clear on what these numbers are.
In the Player adoption tab, you input details that determine whether a platform can technically play the codec. There, it’s a capability issue, not a preference issue. For example, if 30% of computers can play VVC with the Ittiam decoder, 30% have that capability.
In the distribution tabs, it’s service preference. So, even if 30% of computers can play VVC in software once browser support is enabled, a premium content service may eschew the platform because there’s no hardware DRM. Though computers with software players could technically play the video, the service declines to deploy using the schema.
Similarly, assume 50% of mobile devices can play VVC in software. That might be fine for a social media service, but a premium content service may prefer only to distribute to devices for hardware playback.

Living room and mobile hardware
For living-room devices, the decision is usually simple. The model assumes these devices can only access hardware decode. If a TV, streaming device, console, or set-top box has codec hardware, most services will likely serve the codec to that hardware-capable population.
Mobile hardware decode is usually similar. Hardware playback is efficient and avoids most CPU, battery, thermal, and dropped-frame risk. A publisher may therefore choose to serve the codec to all hardware-capable mobile devices.
Mobile software decode
Mobile software decode is more complicated. As stated, some publishers will avoid it entirely because of battery-life, thermal, performance, or QoE concerns. They should enter 0%.
Other publishers may be comfortable serving the codec only to the highest-performing part of the software-capable population. For example, a service may qualify premium phone models, newer chip generations, or devices that meet a defined performance bar. If that population represents 10% of software-capable mobile viewing, the publisher enters 10%.
The percentage is not a subscription-tier, title, or rollout assumption. It represents the share of the capable mobile playback population that the publisher is willing to use for software decoding under its general device and QoE policy.
Computer playback
Computer hardware and software are separate decisions. As mentioned, assuming browser support exists, a publisher may serve the codec to all hardware-capable computers but reject software decode entirely. Or it may allow software decode only for a defined high-performance segment, defined via CPU performance, battery and thermal behavior.
Other issues may be more global, like DRM, output protection, external-display handling, screen capture, quality control, and support concerns. Obviously, this will be service specific. So, a premium content distributor may not deploy via software on computers because of DRM concerns, while a social media publisher with no similar concerns enables it for all software-capable computers.
Reading the Chart
Each distribution tab has a chart that shows when that category reaches the addressability target using the spreadsheet’s current assumptions (Figure 9).
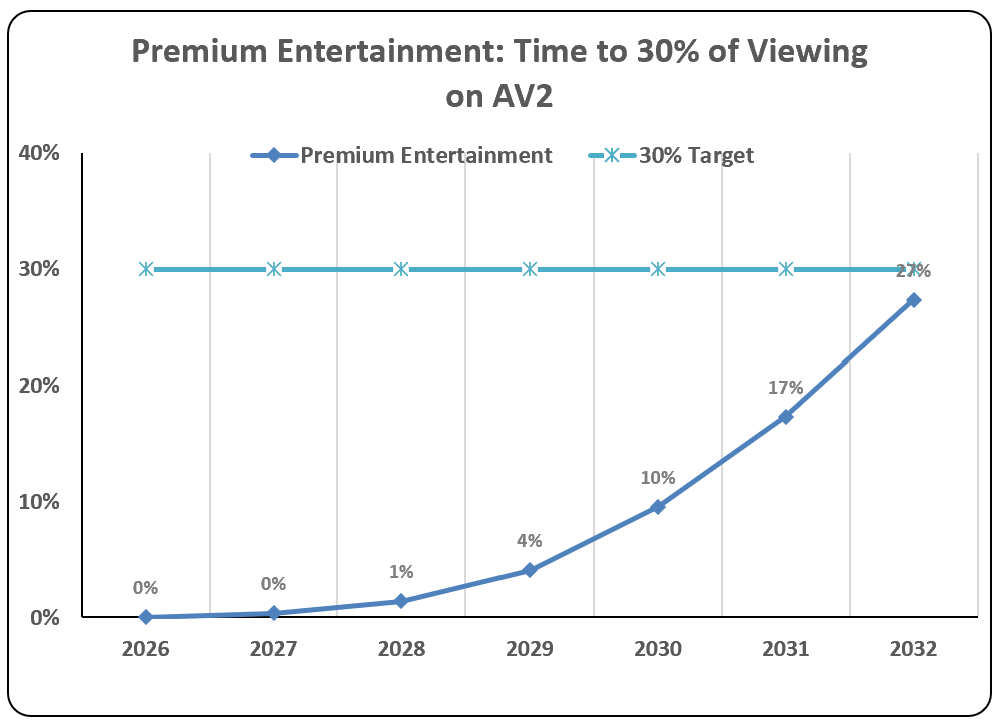
If you’re a service using this spreadsheet, you probably only care about one distribution profile. So, you’re done.
Note that it’s easy to look at this and scoff, “Ozer’s crazy, no way it will take more than 7 years to reach a 30% share.” Download the spreadsheet, work through the numbers, and build your own estimate. The value of the spreadsheet is in the formulas, not the predictions. I will say that 8+ years after the launch of AV1, only a handful of services are actually using it.
The Summary Tab – The Big Picture
If you’re a codec researcher or patent owner, you might be interested in projections for all relevant markets. That’s what the Summary tab is for. All the numbers on this sheet come from other places; the only number you control here is the comparative target in cell L2. (Note: Each distribution tab has its own independent target in cell B3, while cell L2 sets the shared benchmark line on the Summary chart.)
Figure 10 highlights what I mentioned above; different markets reach critical mass at different times. Creator / Long-form and Social / Short-form will almost always be first, hence YouTube and Meta pioneering AV1 usage almost from the start. Ditto for Chinese companies using VVC for social media as well.
Premium content and high-profile sports will always take much longer. Take Alliance for Open Media founding member Netflix out of the picture, and you’d be hard pressed to find any premium content services using AV1 prior to 2025 or 2026. Even then AV1 support in Smart TVs was pulled through by YouTube and AV2 may not enjoy the same momentum.
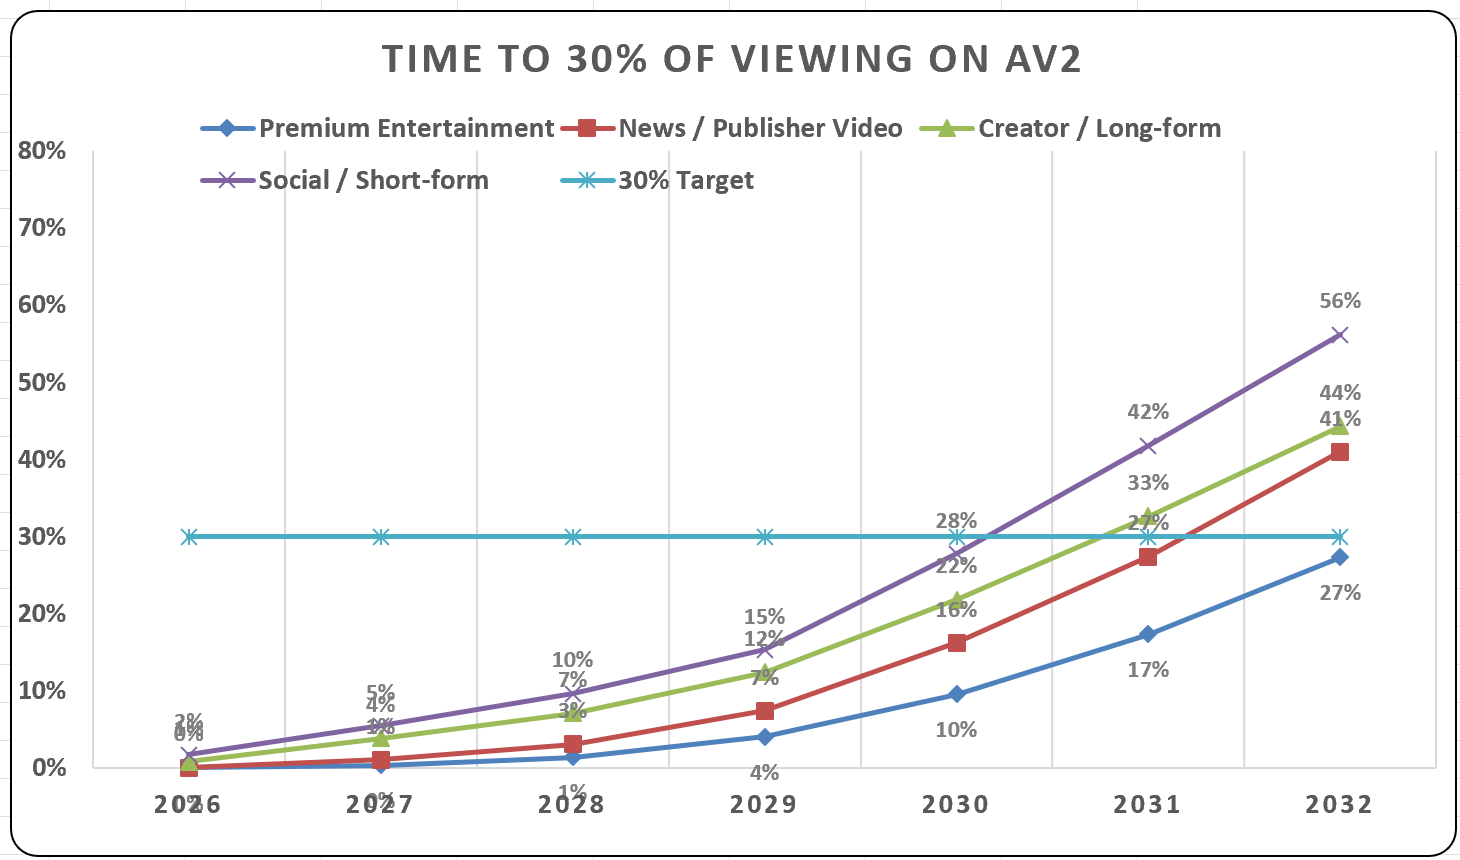
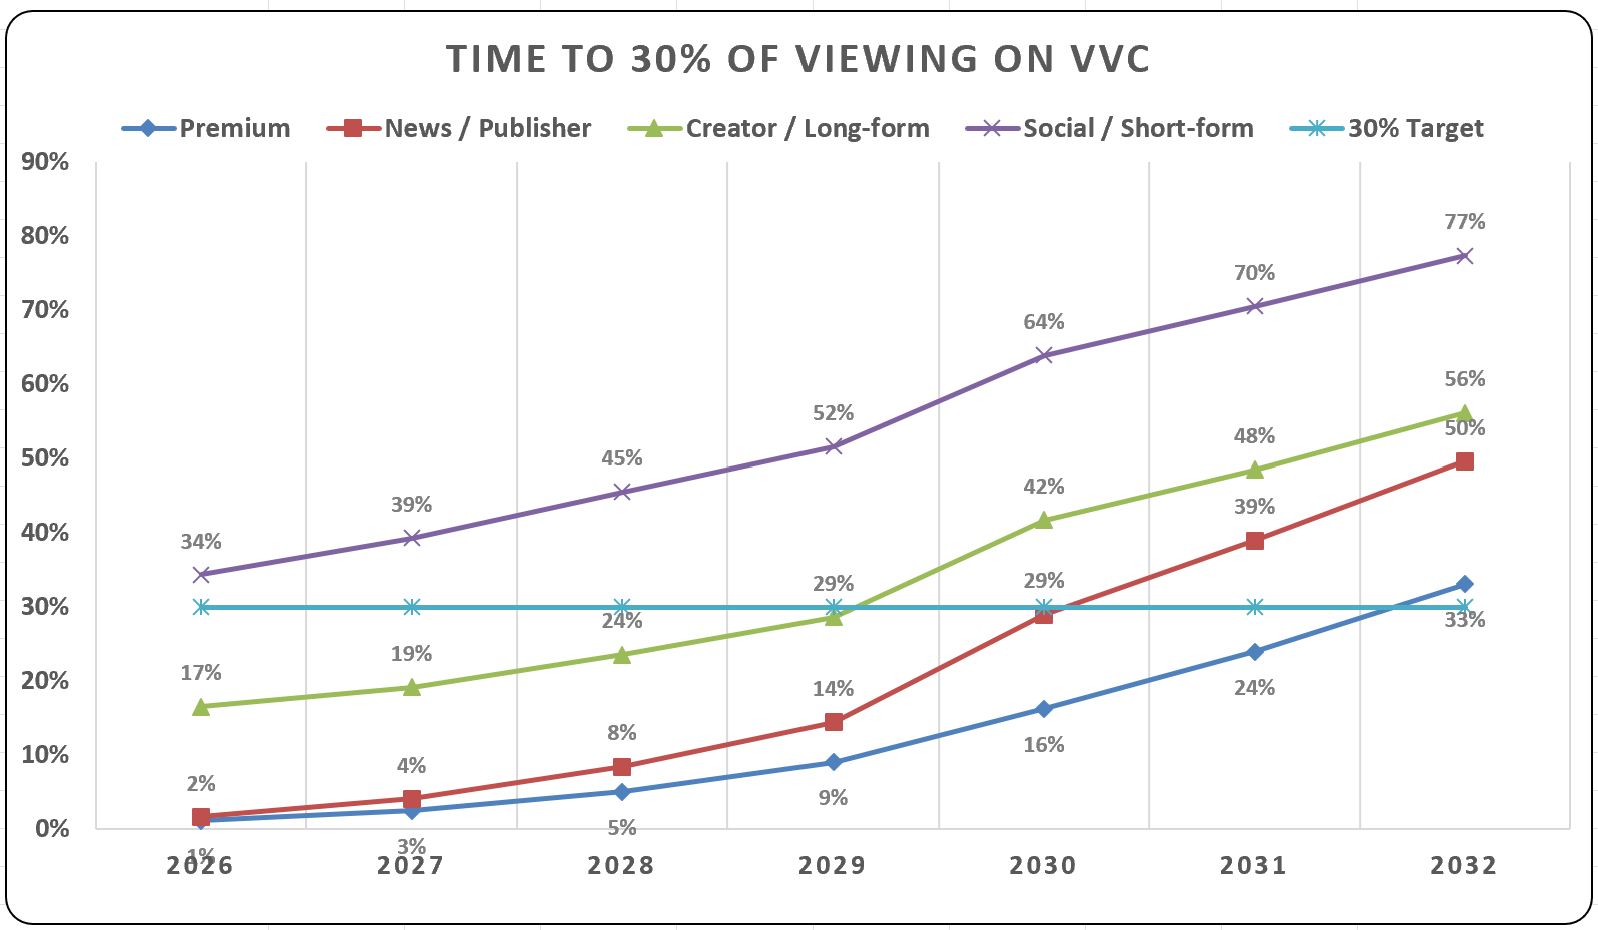
Figure 11 shows similar predictions for VVC, where the model indicates that VVC is open for business for social media today, with long form social media worthwhile by early 2030. As my esteemed colleague Robert Moore has pointed out, Meta already has a licence for VVC usage, so perhaps there’s a jolt to AOM coming. In addition, as mentioned, several Chinese UGC services already use VVC, bolstering the theory that software playback should be acceptable for social media. You see the estimates for other distributions in the figure.
How to Use These Numbers
From my perspective, not surprisingly, the algorithms in this spreadsheet represent the reality of how codecs get adopted. They are more or less immutable; while there’s certainly wiggle room in one direction or another, it’s highly unlikely that VVC or AV2 decode will reach critical mass in the living room in 2028 or 2029.
If your job is to accelerate codec adoption, use the spreadsheet as a target list. The inputs pinpoint where real-world progress can actually pull the deployment date forward:
- Incentivize more silicon vendors to add hardware decoding to mainstream chipsets.
- Push device makers to ship TVs, streaming sticks, phones, and PCs that use those chips.
- Build faster software decoders so publishers can safely qualify older mobile devices without cooking batteries or dropping frames.
- Establish formal mobile certification benchmarks so engineering teams can deploy software playback with confidence.
- Advocate for native browser support so computer playback isn’t blocked at the media pipeline.
- Lower the financial barrier to entry so publishers don’t need a massive addressable share to justify encoding, storage, and licensing costs.
You can’t force consumers to replace their 4K TVs every three years, but you can target software efficiency, browser integration, and device qualification. Plug your own assumptions into the model to see which levers actually move the needle for your business.
Look Beyond Consumer Streaming
Beyond nudging the variables, remember that internet streaming markets aren’t the only games in town. Other markets don’t have to wait on retail device turnover or browser politics. These include:
- Managed IPTV: Operators pick the set-top box and player, meaning immediate hardware control.
- Contribution and backhaul: Broadcasters control both ends of the link and can upgrade encoders and decoders at will.
- Surveillance and industrial video: Security operators qualify their own cameras, servers, and monitoring stations.
- Digital signage: Networks dictate the playback hardware across every store, campus, or airport.
- Hospitality and IFE: Cruise lines, hotels, and airlines deploy closed playback systems with defined specs.
- Enterprise video: Internal comms and training platforms can mandate specific corporate hardware and apps.
- Specialized native apps: High-end medical imaging, remote production, and inspection tools can bundle custom decoders directly into the software.
These markets can be targeted and penetrated without the latency of waiting for a mass consumer market to develop.
One Final Caveat
Not to be a total Debbie Downer, but no one should consider passing the 30% threshold as the starting gun that triggers automatic codec deployments. VP9 and AV1 support has long passed that threshold on Smart TVs and computers, yet relatively few publishers support them.
The true hyperscalers like YouTube, Meta, Netflix, Tencent, ByteDance, and Kuaishou tend to push the envelope on codec adoption, chasing small percentage gains that at scale become millions. For whatever reason, even the next tier of publishers have been very slow to follow.
The only exception, of course, was HEVC, but that was adopted almost exclusively by premium content publishers chasing 4K and HDR deliveries they couldn’t practically perform with H.264. For whatever reason, codec adoption purely for bandwidth savings has been very slow beyond the hyperscalers. Content royalty costs and licensing uncertainty could add additional latency, particularly for publishers whose primary incentive is bandwidth savings.
Where I Can Help
The constraints that govern codec deployment aren’t optional. You can influence some, work around others, and model the rest, but wishing them away isn’t a strategy.
If you’re evaluating a new codec rollout, I help companies turn these variables into concrete decisions:
- Custom Addressability & ROI Modeling: Tailoring this framework to your actual viewer analytics, calculating whether bandwidth savings outweigh dual-encoding and edge-cache dilution costs.
- Playback & QoE Benchmarking: Testing software and hardware decode performance across real-world mobile and living-room devices to establish safe qualification thresholds.
- Closed-Ecosystem Architecture: Evaluating deployment viability for managed IPTV, corporate networks, and specialized streaming workflows.
If you want to run the numbers on your specific distribution footprint, please contact me at jan.ozer@streaminglearningcenter.com.
Author’s note: After many years of publishing spreadsheets and articles based on spreadsheets, I’ve recognized that it’s virtually impossible to ship a workbook without errors. If you still spot an error in math or logic, please contact me at jan.ozer@streaminglearningcenter.com.
For total transparency, I prototyped the logic in Perplexity and finalized the formulas, structure, and verification tabs using the Claude Excel plugin. To minimize bugs, I included two automated verification tabs: Model checks audits viewing mix sums, share bounds, and formula links across every tab, while Premium check runs an independent arithmetic recalculation of the core formulas. They act as a built-in safety net, so if a cell turns red, you’ll know immediately where the math got derailed.
Download here: Here’s the link: