 Streaming Learning Center Where Streaming Professionals Learn to Excel

Related Articles



If you’re producing solely H.264-encoded video, optimizing your encodes can save you bandwidth costs and deliver a higher quality experience to your viewers. If you’re considering adding HEVC or AV1 to the mix, you have another reason.
Before you attempt to compute the bandwidth savings and quality improvements these codecs deliver, you should know how just much quality and bitrate you can get from your current H.264 encoder. Otherwise, some of the gain you credit to the new codec is really the gain you left on the table with H.264.
To illustrate this, I produced two series of tests with x264 and FFmpeg. First was to identify the optimal encoding parameters for x264 using 1080p clips, then to apply those parameters to a full encoding ladder and compute the overall benefits. For you TL/DR afficionados, the results come first. The rest of the article explains how we got them.
Contents
The results
You’re going to have a ton of questions, but this is the TL/DR section; we’ll answer most of them below.
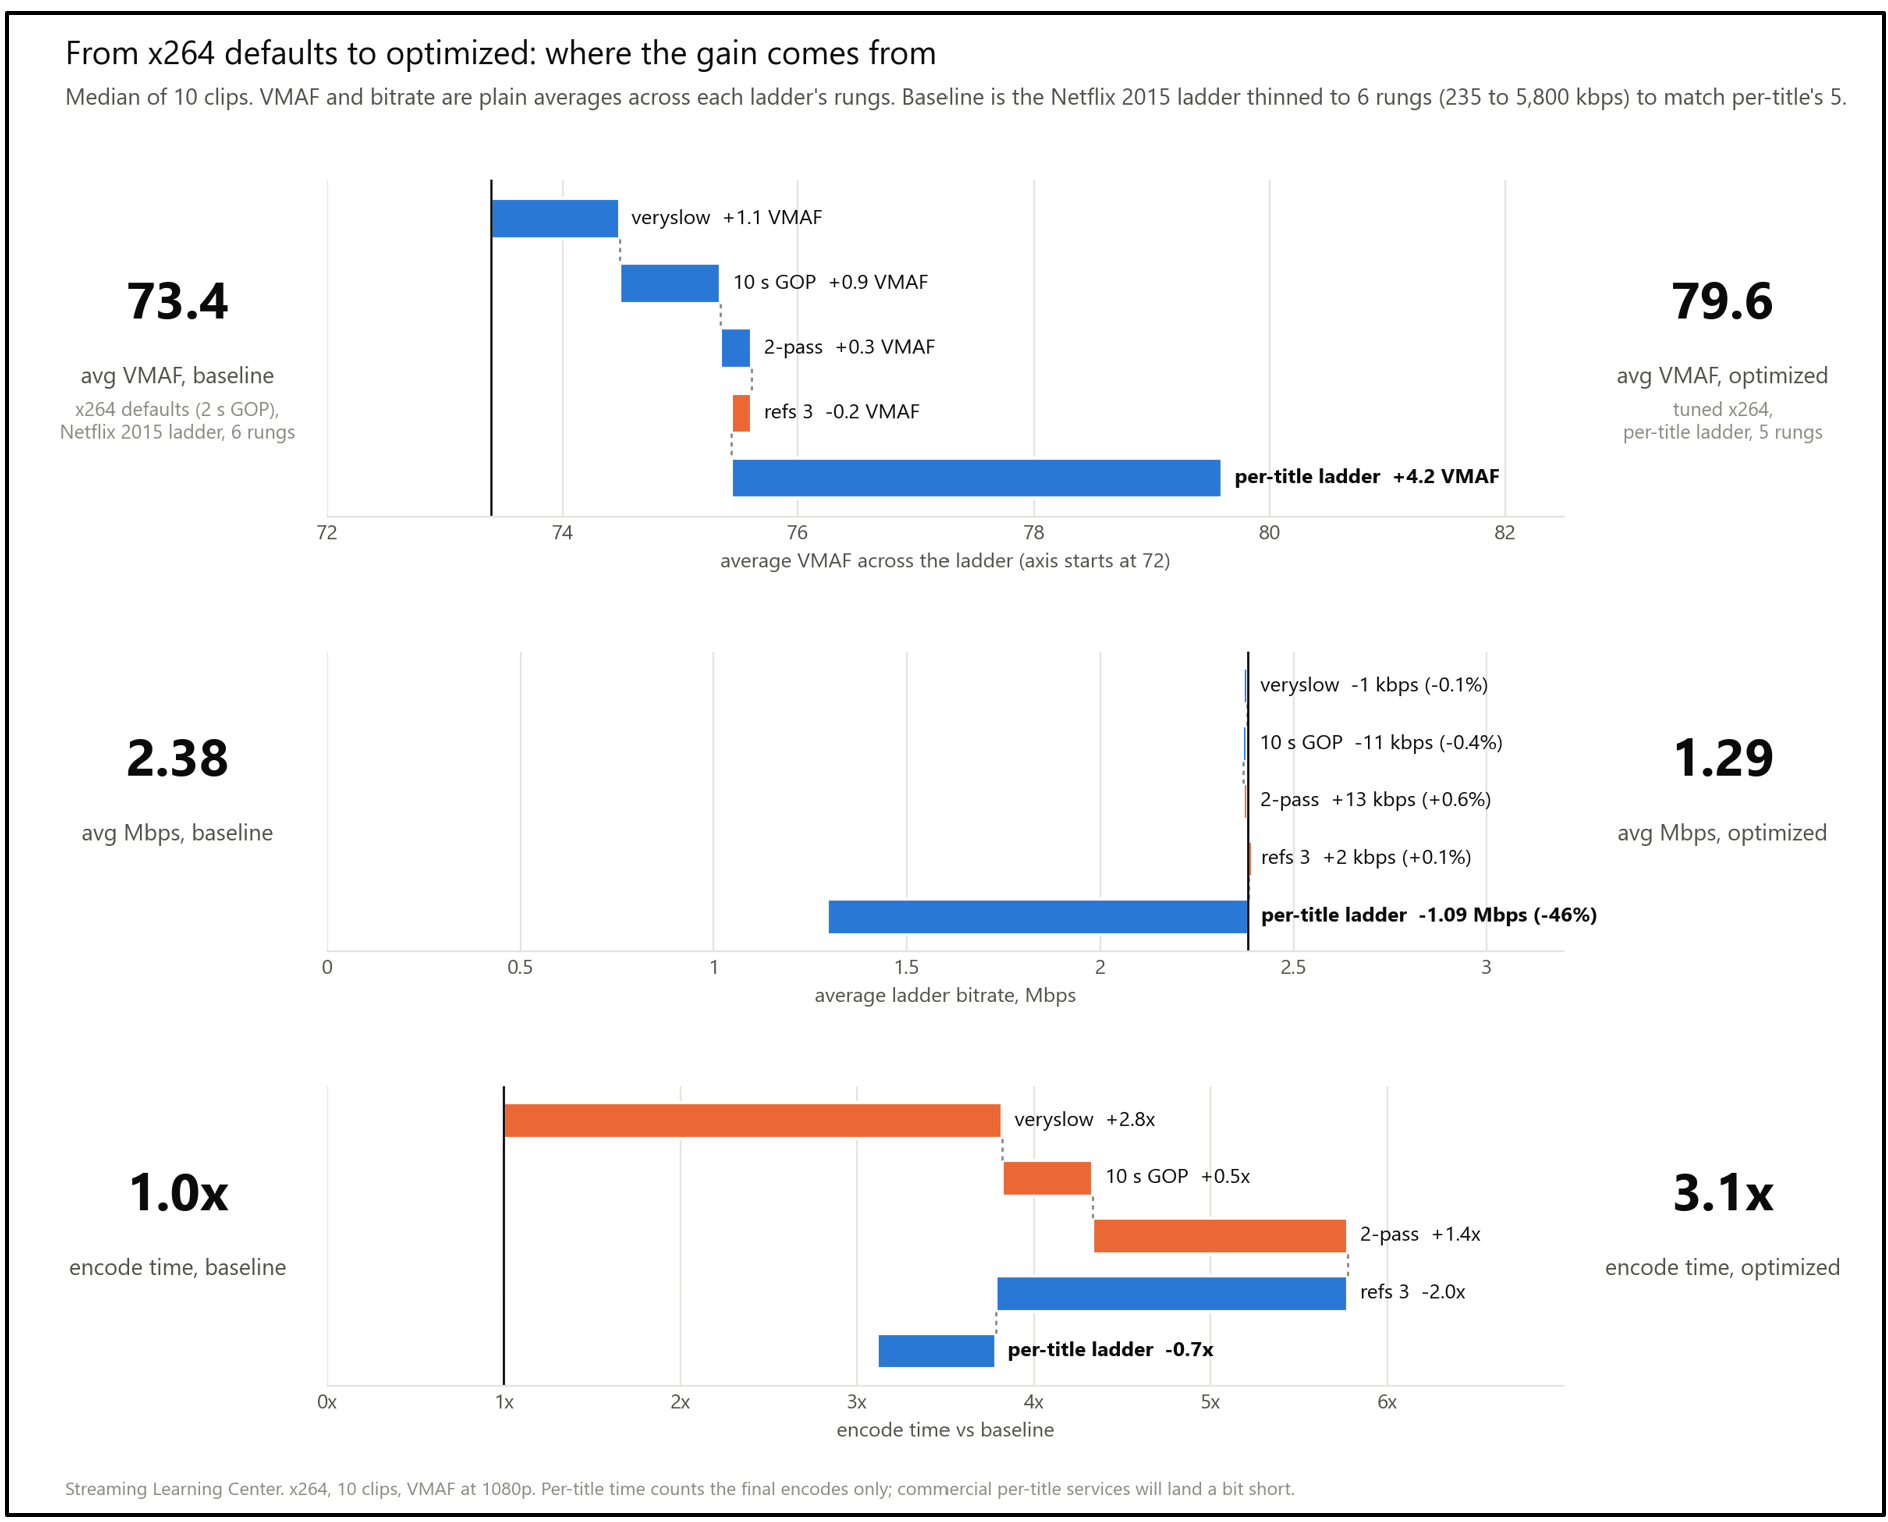
Figure 1 starts with x264 at its default settings (with a two-second GOP) using a fixed H.264 ladder, and adds one optimization at a time: the veryslow preset, a ten-second GOP, two-pass encoding, three reference frames, and finally a per-title ladder with the same settings. The numbers are the median across 10 clips. We measure the impact along three axis, VMAF quality, bitrate, and encoding time (cost).
In terms of quality, the baseline ladder averaged a VMAF score of 73.4 across its rungs at an average bitrate of 2.38 Mbps. Encoder tuning raised the average VMAF to 75.4 without substantially changing the bitrate. The per-title ladder raised the average VMAF to 79.6 and reduced the average bitrate to 1.29 Mbps, 46% lower than the baseline. The optimized configuration delivered higher quality at a lower average bitrate on all 10 clips.
In terms of encoding time, it increased to 3.1 times the baseline. To convert that to dollars, we priced the encoding on an AWS c7i.8xlarge instance at $1.428 per hour, which has the same 32 threads as our test workstation, and bandwidth at $0.02 per GB. Our times were measured on the workstation, so treat the encoding costs as estimates. Scaled from our two-minute clips, the baseline ladder cost about $1.27 to encode per hour of content, and the optimized ladder, at 3.1 times the encoding time, cost about $3.94, an extra $2.67 per hour of content.
When computing average VMAF quality in Figure 1, we treated every rung equally and simply averaged the bitrate and quality. However, in real life, most services don’t distribute rungs equally. In the US and Europe, and other regions with high speed connections, mostly the higher rungs are watched, unless the service targets mobile viewers, where the middle rungs predominate. For this reason, SBE lets you choose the audience to measure distribution cost and quality differential. There are three presets; IPTV, top-heavy, and mobile, and you can create your own.
Figure 2 compared the baseline and optimized ladder using the top-heavy distribution, which assumes primarily top rung viewing. With this distribution, the optimized ladders reduced the average delivered bitrate across the 10 clips from 4.90 Mbps to 3.09 Mbps, a 36.9% reduction. That saved about $0.016 in bandwidth for every hour viewed. At that rate, each hour of encoded content must be watched about 164 times before the bandwidth savings cover the extra encoding cost, as shown in Figure 2. Average VMAF quality also increased by .6 points. After a million hours of viewing bandwidth saved equaled $16,257.
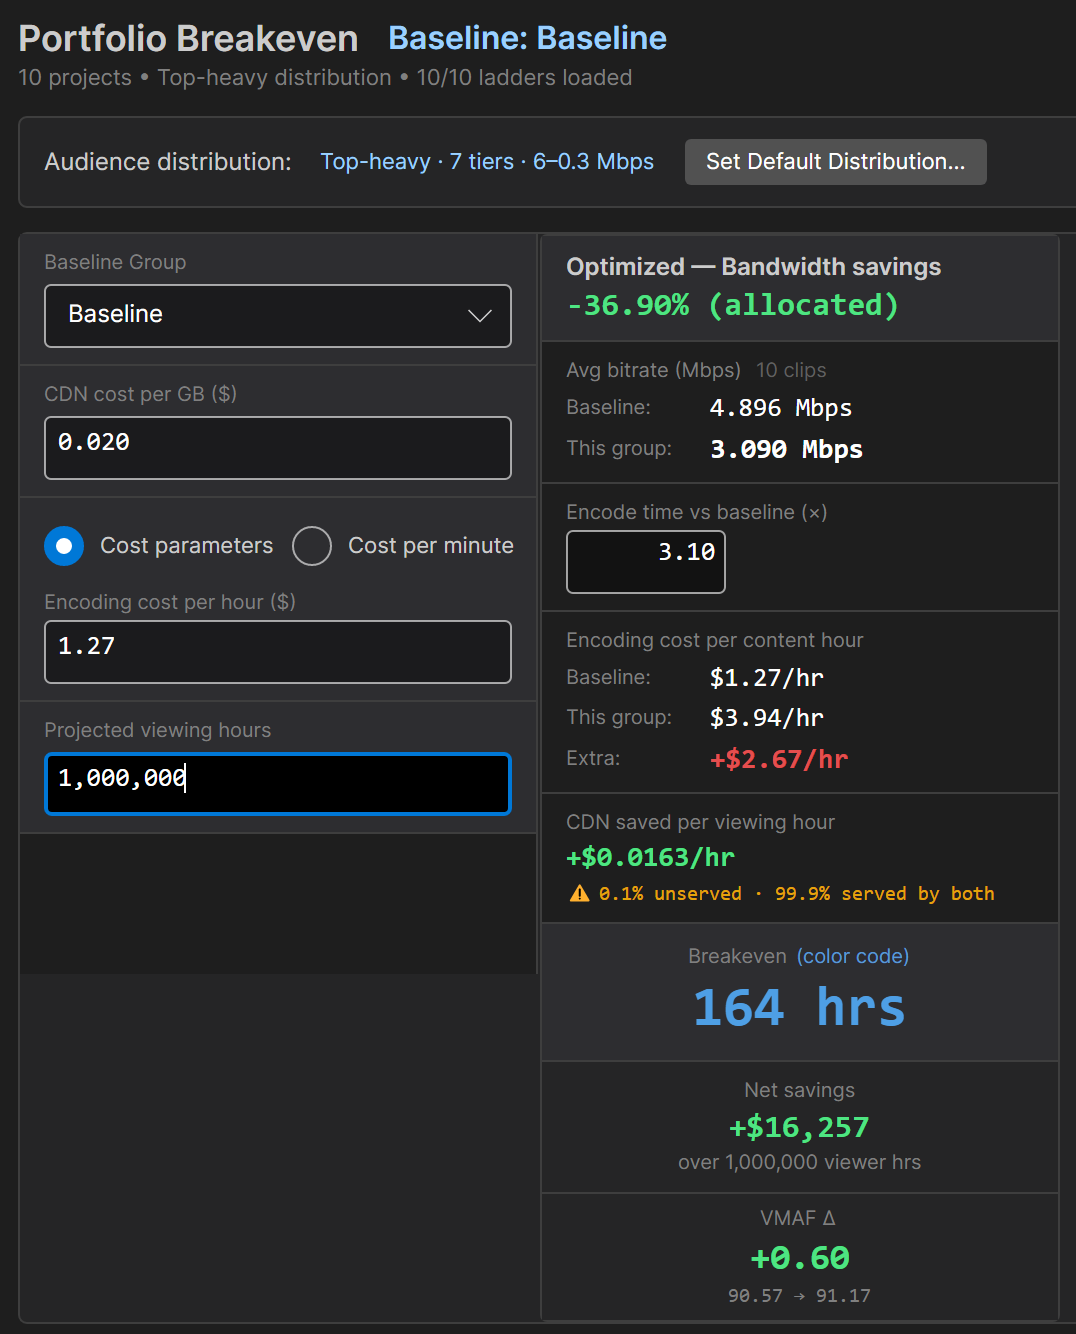
Figure 2. Breakeven between the baseline and optimized ladders in SLC Bitrate Explorer. The encoding cost is recovered in 164 hours of viewing, while overall ladder quality improved by .6 VMAF costs (at a 46% lower bandwidth).The viewer-weighted quality gain was much smaller than the gain in Figure 1. Average delivered VMAF rose from 90.57 to 91.17, less than a point. Most of the per-title ladder’s quality gain comes at the low and middle rungs, where it uses higher resolutions than the fixed ladder, and a top-heavy audience spends little time on those rungs. For that audience, the per-title ladder’s main benefit is lower bandwidth cost at about the same quality.
For an audience with more viewers on slower connections, the quality gain would be larger. If we switched the audience to the mobile preset, the average VMAF score jumped from 72.11 to 81.87, about 9 points. However, because this group retrieved much lower bitrate videos, the bandwidth savings dropped to $0.0027/hour and the breakeven increased to 993 hours.
What’s it Mean
As a codec researcher, you hate to spend weeks of testing only to reach the obvious answer; there are multiple configuration options you can adjust for some gain, but the most effective adjustment you can make is to implement some form of per-title encoding.
Now that you know how the story ends, let’s return to the beginning.
How we tested
The testing ran in two stages. The first stage encoded 13 test clips at 1080p and changed one parameter at a time to find which settings matter and what each one costs in encoding time. The second stage used those results to build full encoding ladders, starting with a fixed ladder at x264 defaults, adding the useful settings one at a time, and finishing with a per-title ladder. This is the same process we use when we work with encoding clients, except that for clients we run it on their own content.
The 13 clips cover animation, sports, primetime drama and music, news and education, and screen content. All quality scores are VMAF, measured at 1080p. All encoding times are wall-clock time on a single workstation (an Intel Core i9-14900 with 32 logical cores), and all times are reported relative to a baseline, so they transfer to other hardware better than absolute numbers would.
Stage one: finding the settings that matter
Each clip was encoded at a single bitrate, the rate at which x264 at the slow preset produces a VMAF score of 93. That keeps every clip at a realistic top-rung quality level instead of a fixed bitrate that would be too high for some clips and too low for others. The baseline configuration was the veryslow preset, two-pass encoding, and a two-second GOP. From that baseline we changed one parameter at a time and measured VMAF, the lowest-scoring frame in the clip (a proxy for transient quality problems), and encoding time.
We tested preset, GOP size, one-pass versus two-pass encoding, reference frames, B-frames, the maximum bitrate cap, the VBV buffer size, and thread count. These are the settings every encoding shop has to choose, and each one trades quality against encoding time. Reference frames, B-frames, and threads were included mainly as cost levers, to see how much encoding time they save and what that costs in quality.
We did not test the psychovisual settings: psy-rd, psy-trellis, and adaptive quantization. These settings are designed to make video look better to human viewers, and they often do that by distributing bits in ways that lower VMAF and PSNR scores. A test that measures them with VMAF will often recommend the setting that looks worse. Measuring them properly requires subjective testing, so every encoder ran at its own default psychovisual settings.
The results were consistent across most clips. Preset was the largest quality lever. The medium preset delivered 99.2% of the veryslow preset’s VMAF score in 31% of the encoding time, and ultrafast delivered 89.9% in 12% of the time. The slower presets buy small quality gains at high cost, which matters most for content that is encoded once and watched many times. Figure 3 shows the tradeoff for every preset.
[FIGURE 3: x264 preset time/quality chart (Jan’s Excel format, cycle1_x264_time_vs_quality.xlsx, preset sheet). Three lines across the nine presets, ultrafast to veryslow: encoding time, VMAF, and lowest-frame VMAF, each as a percentage of veryslow. Footnote the lowest-frame dip at slow (one corrupted frame on one screen-content clip).]
Figure 3. Encoding time, VMAF, and lowest-frame VMAF for each x264 preset, as a percentage of veryslow. Average of 13 clips at 1080p.
A ten-second GOP improved VMAF by 0.9 points over a two-second GOP, and a five-second GOP improved it by 0.7 points. A one-second GOP cost 1.5 points. Longer GOPs also took longer to encode, about 17% longer at ten seconds, because I-frames are the cheapest frames to encode. They skip motion search, so a longer GOP replaces cheap I-frames with more expensive P- and B-frames. In practice, GOP size is limited by your packaging and segment duration, so the lesson is to use the longest GOP your delivery system supports.
Two-pass encoding improved VMAF by 0.27 points over one-pass for about 13% more encoding time. Reducing reference frames from the veryslow default of 16 to 3 cut encoding time by 31% and cost 0.07 VMAF points, which makes it the most useful cost lever in the test. The veryslow default B-frame setting was already the best choice, and disabling B-frames cost 0.5 VMAF points. A VBV buffer of 100% of the target bitrate cost 0.5 VMAF points compared to a 200% buffer. Maximum bitrate caps between 150% and 400% of the target made no measurable difference.
Thread count affected encoding time but not quality. Running x264 at its default thread count was the fastest configuration. Limiting it to eight threads made encoding 1.7 times slower and improved VMAF by only 0.18 points.
The results also varied by content. Sports clips were hurt most by fast presets and by disabling B-frames, and primetime content was hurt least. One screen-content clip produced a single corrupted frame at the slow preset, which pulls down the lowest-frame line in Figure 3. It is specific to that clip. The dip is easy to see in SLC Bitrate Explorer’s per-frame VMAF plot, and its Frame Viewer shows the damaged frame next to the source, as shown in Figure 4. The average score for the file gives no sign of it.
[FIGURE 4: SBE screenshot, two parts. (a) Metrics tab with BD-Rate_x264_preset.sbe loaded (D:\Numbers_2026\sbe\BD-Rate\), per-frame VMAF plot for the slow and veryslow encodes, with the dip to 50.4 at frame 916 (about 30.5 s) visible on the slow line. (b) Frame Viewer at frame 916, slow encode beside the source, showing the corruption. Optional: veryslow at the same frame for contrast.]
Figure 4. A single corrupted frame (frame 916) in the slow-preset encode of a screen-content clip, found in SLC Bitrate Explorer’s per-frame VMAF plot and inspected in its Frame Viewer.
Stage two: building ladders
The second stage tested complete encoding ladders, because that is how video is actually delivered. The baseline ladder is the H.264 ladder Netflix published in 2015, encoded with x264 at its default settings except for a two-second GOP. We adjusted the Netflix ladder in two ways. Its lower rungs were 4:3, so we kept the widths and used 16:9 heights to match our content. We also removed four of its ten rungs, leaving six rungs from 235 kbps to 5,800 kbps, so that it has about the same number of rungs as the per-title ladders it is compared against. Without that adjustment, a simple average across the rungs would be skewed by the extra low-bitrate rungs in the fixed ladder.
We then added the settings that earned a place in stage one, one at a time and each on top of the last: the veryslow preset, a ten-second GOP, two-pass encoding, and three reference frames. The reference-frame step is a cost step. It is there to recover encoding time, not to improve quality.
The final step replaces the fixed ladder with a per-title ladder using the same encoder settings. Our per-title process works in two parts. First, it searches for the 1080p bitrate that produces a VMAF score of 93 for that clip, which becomes the top rung. Then it builds the ladder downward, reducing the bitrate to 60% of the previous rung at each step and choosing the resolution for each rung by testing which one scores higher at that bitrate. The resulting ladders had between four and seven rungs, with five on most clips.
The per-title search itself takes time, because it encodes and scores many candidates that are thrown away. We did not include that time in the results. Few companies will run a per-title search like ours. Most will use the per-title features in services like Bitmovin or AWS Elemental, which run their own analysis. The encoding times in Figure 1 count only the final ladder encodes. Commercial per-title systems will likely produce results a bit short of ours.
The ladder tests used 10 of the 13 clips. The two screen-content clips were left out because their top rungs are around 300 kbps, which leaves room for only one or two rungs in a per-title ladder. One primetime clip was left out because its per-title search reached the search’s bitrate ceiling before reaching the target quality.
What else we found
On the most difficult clip, the optimized configuration used about the same bitrate as the baseline and delivered 6.6 VMAF points more. On the others, it delivered higher quality at a lower bitrate. Figure 5 shows where the per-title gain comes from for one clip. The per-title ladder’s curve sits well above the fixed ladders at low and middle bitrates, because at each of those bitrates it uses a higher resolution than the Netflix ladder does. At the top of the ladder, where both use 1080p, the curves are much closer together.
[FIGURE 5: SBE BD-Rate tab, NASA clip, rate-quality curves (VMAF vs bitrate) for three ladders: baseline (s0, x264 defaults), tuned (s4), and per-title (s5). Use the 6-rung Netflix ladder for s0 and s4 (REBUILD the NASA ladder .sbe with ladder_to_sbe.py on rungs 235/560/1050/2350/4300/5800 first). Show the resolution labels on the points if SBE can.]
Figure 5. Rate-quality curves for the baseline, tuned, and per-title ladders on one clip (NASA), from SLC Bitrate Explorer’s BD-Rate tab.
The encoding time in Figure 1 moved in both directions. The tuning steps raised it to 5.8 times the baseline, the reference-frame step brought it back down to 3.8 times, and the per-title ladder brought it to 3.1 times, mostly because it has fewer rungs and lower bitrates.
The veryslow preset’s gain was not evenly distributed across the ladder. It improved the lowest rung by 1.8 VMAF points and the top rung by only 0.4 points. That is mostly a property of VMAF: at a score of 95, there is little room left on the scale, so real efficiency gains at the top rung show up as bitrate savings rather than higher scores. When you evaluate settings for your top rungs, measure the bitrate needed to reach a target quality, not the score at a fixed bitrate.
Two-pass encoding improved results on seven of the ten clips and slightly hurt three. Gains from every setting varied by content, which is why these tests should be run on your own content before you change a production configuration. The median is a useful guide, but the clips at the edges of the range are the ones that cause problems in production.
The encoder tuning gain is also the number to keep in mind when you evaluate a new codec. If you compare HEVC or AV1 against H.264 at default settings, the gain you measure includes the gain from tuning H.264, and you will overstate what the new codec delivers. We will look at that question directly in the next article, which compares x264 and x265 on the same ladders.
What’s in the PDF
The PDF includes the full results from both stages:
- 1080p tests: a time-versus-quality chart for each parameter, with results broken out by genre, and notes on the outliers.
- Ladder tests: Figure 1, results for each clip and genre, the ladder definitions, and the methodology.
- How we ran the analysis in SLC Bitrate Explorer, with screenshots.
You can download it at [DOWNLOAD LINK]. It includes a [DISCOUNT] coupon for SLC Bitrate Explorer, the tool we used to build and compare the ladders in this article. If you want this analysis run on your own content, contact us at [CONTACT].