 Streaming Learning Center Where Streaming Professionals Learn to Excel

Related Articles


I just completed the first of two reports on cloud-based per-title encoding features, culminating 8 months of work. The first report details H.264 output, and the next, scheduled for release by July 18, details HEVC output. This article will detail the procedures used during this analysis which will be helpful to any company seeking to perform their own analysis to choose the optimal vendor.
For the record, the services that I tested were AWS Elemental (MediaConvert), Microsoft Azure Media Services, Bitmovin, Brightcove/Zencoder, and Tencent. To test the services, I used 23 test files of between 1-8 minutes in duration in roughly four genres, movies and entertainment, sports, animation, and office.
Here’s an overview of the analysis.
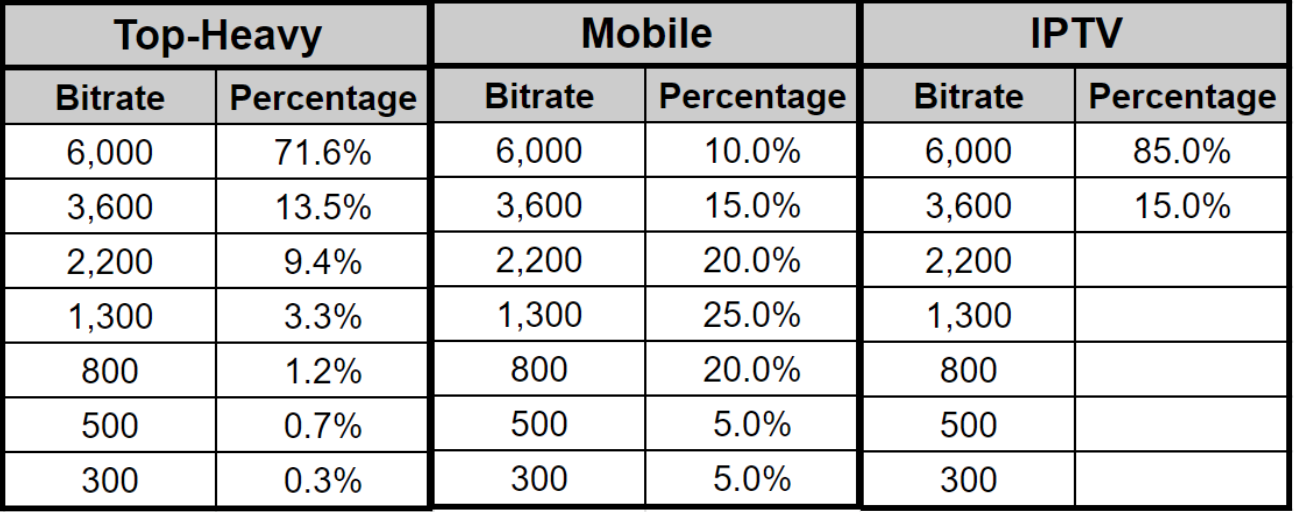
- I compared the encoding and storage cost, streaming cost, and quality differential using three distribution patterns:
- Top-heavy – where most viewers retrieved the top and middle rungs
- Mobile – where most viewers retrieved the middle rungs, and
- IPTV – where all viewers watched the top two rungs.
- I started by computing the optimal ladder for each test video using the convex hull technique popularized by Netflix.
- I encoded all 23 1080p test files with all services and compared the output to the convex hull.
- I measured encoding quality with VMAF, 99th percentile VMAF, and l0w-frame VMAF, with frequent checks of actual frame quality and other metrics like PSNR, SSIM, and MS SSIM.
- To assess pure encoding performance, I also encoded four test files to static encoding parameters and measured the quality differentials.
Contents
Measure Cost and Quality Using Different Distribution Patterns
Rating services without considering distribution pattern is like buying a car without knowing city and highway mileage. If you drive 2 miles a day in and about your home town, highway mileage probably isn’t that important. On the other hand, if you commute 75 miles each way, highway mileage is a clear differentiator. So it is with distribution pattern.
For example, a service with excellent pure encoding capabilities but a suboptimal encoding ladder might perform well distributing top rungs to high bitrate viewers but would perform poorly distributing middle rungs to mobile viewers. Conversely, a service with good encoding capabilities but a very aggressive ladder would perform poorly in top-rung-centric patterns, but very well in mobile. Here are the three distribution patterns used in the report.
To simplify decision-making, I rate each service on suitability for each pattern.
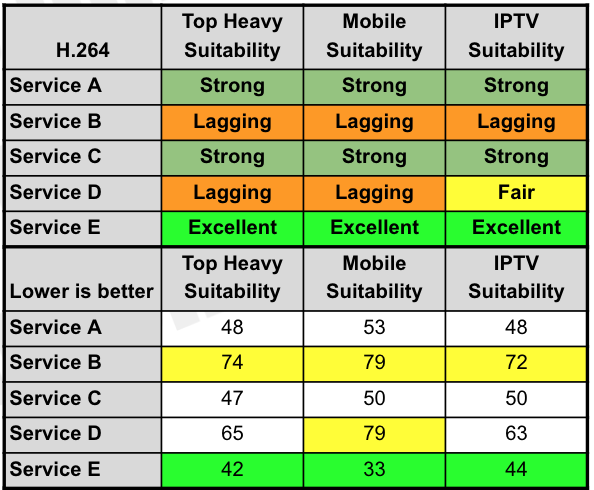
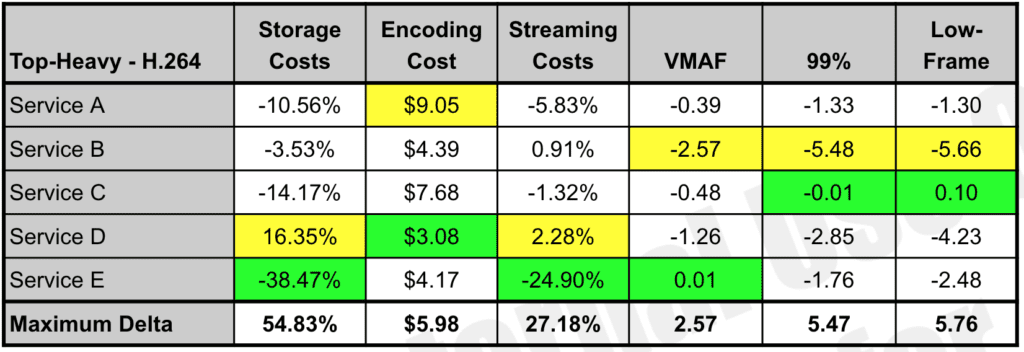
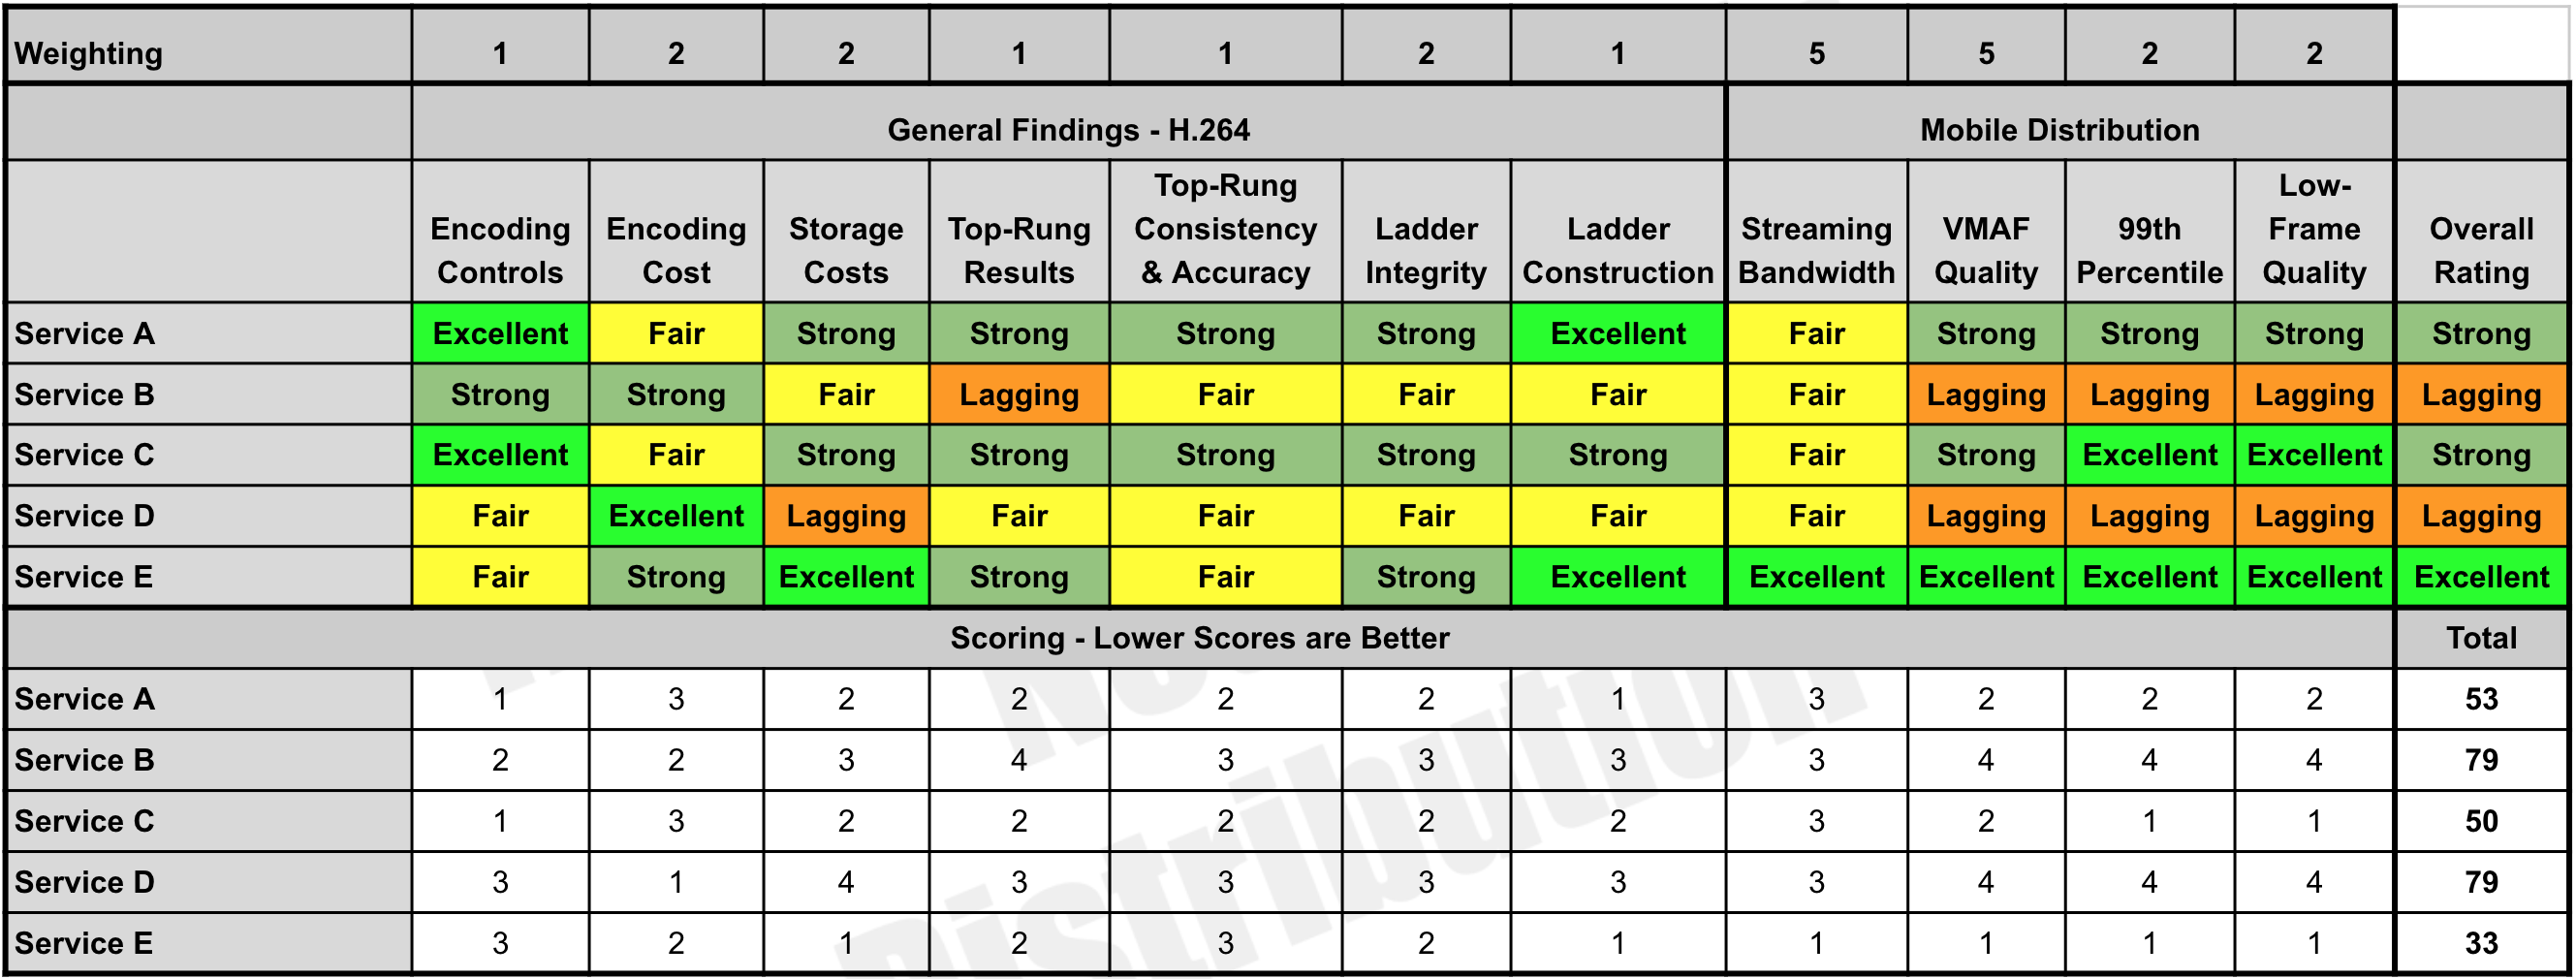
The report also presents a numbers-only analysis for each service for each distribution pattern. In the table, the best score is in green, the worst in yellow, with the maximum delta shows the maximum difference between the results.
The report also shows a full analysis of all capabilities for each service by distribution pattern. Click the table to see it at full resolution.
You can read more about the technique used to compute these numbers in the anonymized downloadable report.
That’s the summary, high-level view. Now let’s dig into the fundamentals of the analysis.
Finding the Convex Hull
It’s simple enough to collect output from the services and compare the results to rank the services. But that doesn’t tell you how the services compare to the “perfect” encoding ladder. That’s what adding the convex hull ladder to the approach delivers.
Briefly, Netflix introduced the convex hull methodology to the encoding world in a post I wrote about here. Basically, to achieve its perfect encoding ladder, Netflix encodes at multiple resolutions at each ladder data rate to find the best quality resolution for each bitrate.
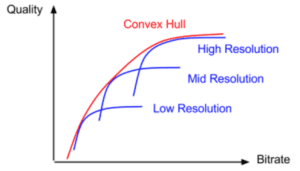
Here’s a description from the Netflix blog post.
We can see that each resolution has a bitrate region in which it outperforms other resolutions. If we collect all these regions from all the resolutions available, they collectively form a boundary called convex hull. In an economic sense, the convex hull is where the encoding point achieves Pareto efficiency.
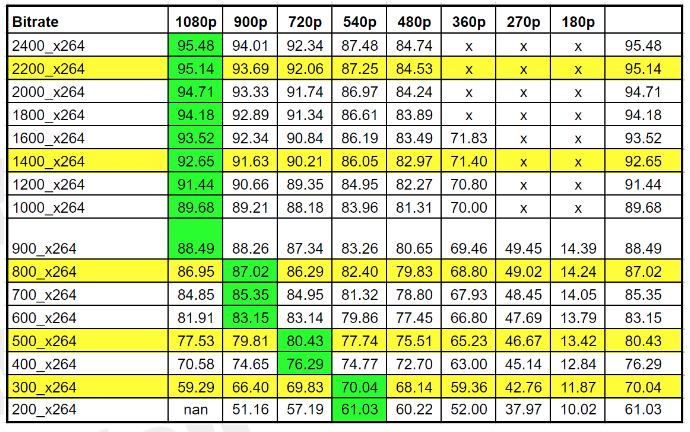
Essentially, it’s a brute-force encoding technique that encodes at multiple resolutions and bitrates and delivers the perfect ladder for each video. I implemented the technique by encoding each bitrate at multiple resolutions with FFmpeg and x264 using the VMAF metric to identify the best quality resolution. You can read about the specific technique used here and here. In the table below, rungs are spaced in the yellow rows; the best quality resolution is that shown in green.
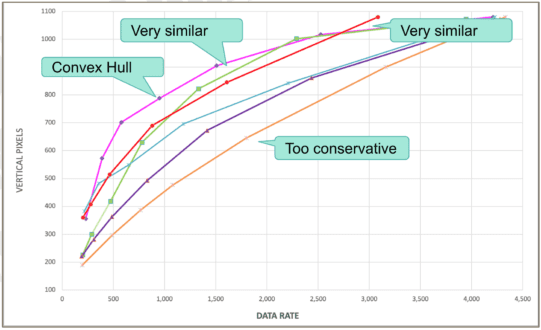
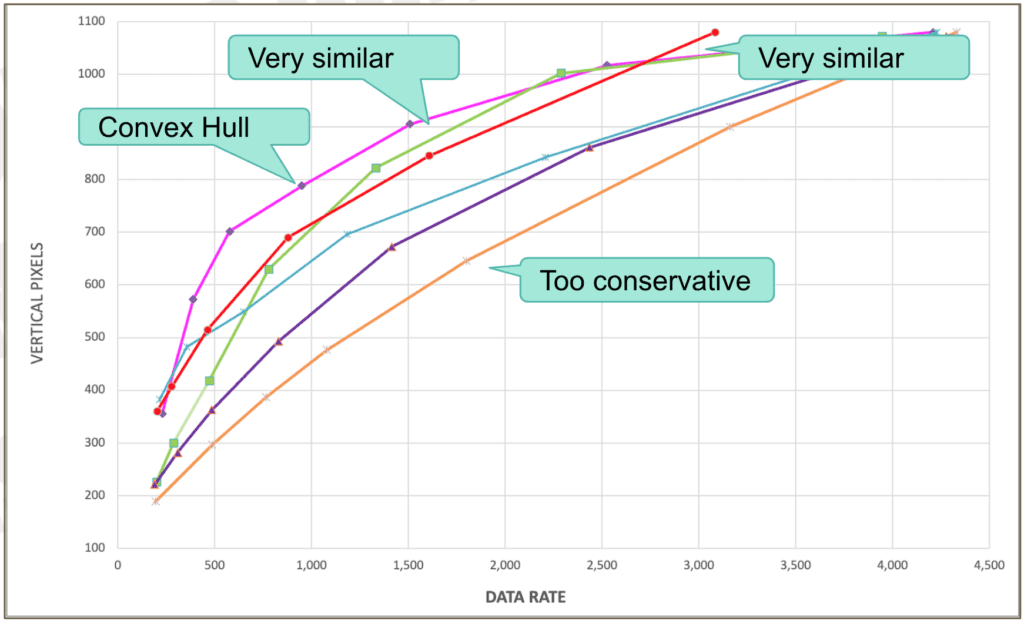
Once I had the convex hull for each file, I created a composite convex hull and compared that to the composite encoding ladders delivered by the services. You see this below, which plots the vertical pixels and data rate, with the convex hull in pink.
Most services meet at the top where their top rung file is full-resolution 1080p. But you see that the convex hull uses larger resolutions lower in the encoding ladder than any service, particularly those labeled “too conservative” on the right. Not surprisingly, in mobile distribution patterns, services with a conservative ladder performed poorly
Measuring Quality in Three Dimensions
Most codec and encoder analyses look at the overall metric scores, whether VMAF, SSIMWAVE, SSIM, PSNR, or others. While obviously important, the overall quality isn’t the only measure that impacts the quality of experience.
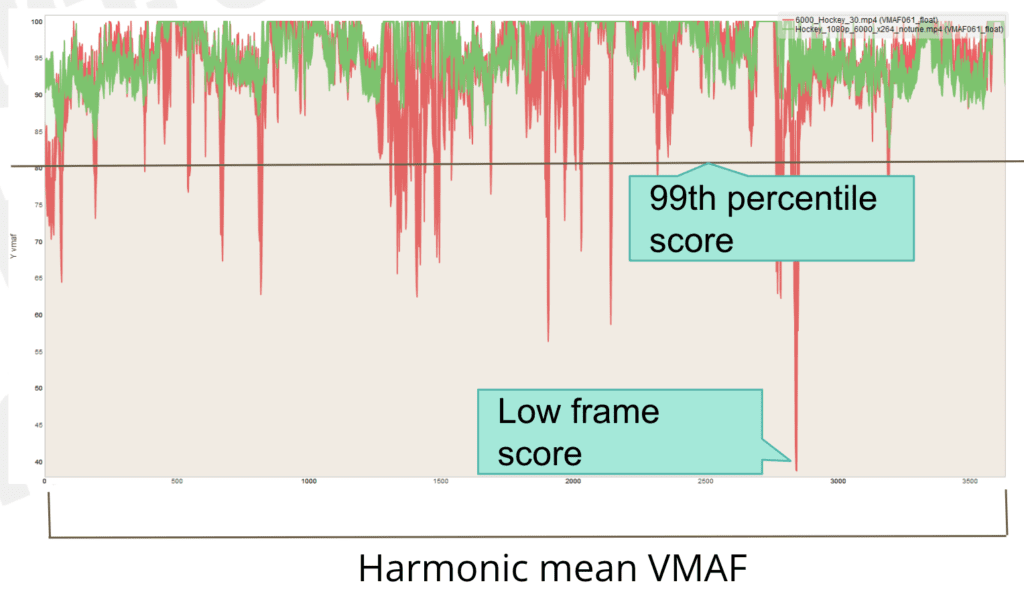
You see this in the figure below, which compares the anonymous service in red with x264 in green. The graph plots the VMAF score for each frame from start to finish for each video. While the overall score is relatively close, you see many more quality drops with the service in red, and many more severe drops. These drops often manifest in visible low-quality regions and, infrequently, in visible blocks or other artifacts in the severe drops.
This issue came to the forefront when I attempted to find the optimal bitrate for the top-rung in an encoding ladder (see here). When I first chose the top rung for the convex hull, I considered only the overall VMAF. When I compared these files to the top rungs from some of the services, which almost always were configured with higher bitrates, I noticed that some of the convex hull top rungs showed many more downward spikes.
This begged the question, “which is the optimal approach, a file with an overall VMAF of 95 but many transient quality issues, or a higher bitrate file with a VMAF of 95 but many fewer and less severe quality issues?” The correct answer felt like the latter, so I reconfigured how I computed the top rung of the encoding ladder.
Specifically, I incorporated the concept of the 99th percentile, which is the VMAF score at which 99% of all frames have that score or higher, a measure of quality variability. That is, the higher the 99th percentile score, the fewer regions of low-quality frames.
I set the quality target at 89 VMAF points, which was six points from 95, a just noticeable difference for VMAF. So, the top rung was the lowest bitrate file with:
- VMAF of 95
- 99th percentile score of 95
I also capped the top rung at 6 Mbps.
Once I started computing the 99th percentile, it made sense to track and report this for all files as a measure of quality variability. I also computed and reported the lowest VMAF score for any frame in the video, an indicator of potential transient issues that may degrade QoE.
Note that for any single video, a low-frame score can be idiosyncratic, which is why I always check the actual frame to make sure that the scoring reflects an actual perceivable difference. However, if a service consistently has poor low-frame scores, the videos that it produces may exhibit transient quality issues. The report includes many examples of low-frame issues where I display the actual frames to demonstrate where a low-frame score accurately predicted poor-quality frames, and sometimes when it didn’t.
Assessing Static Results
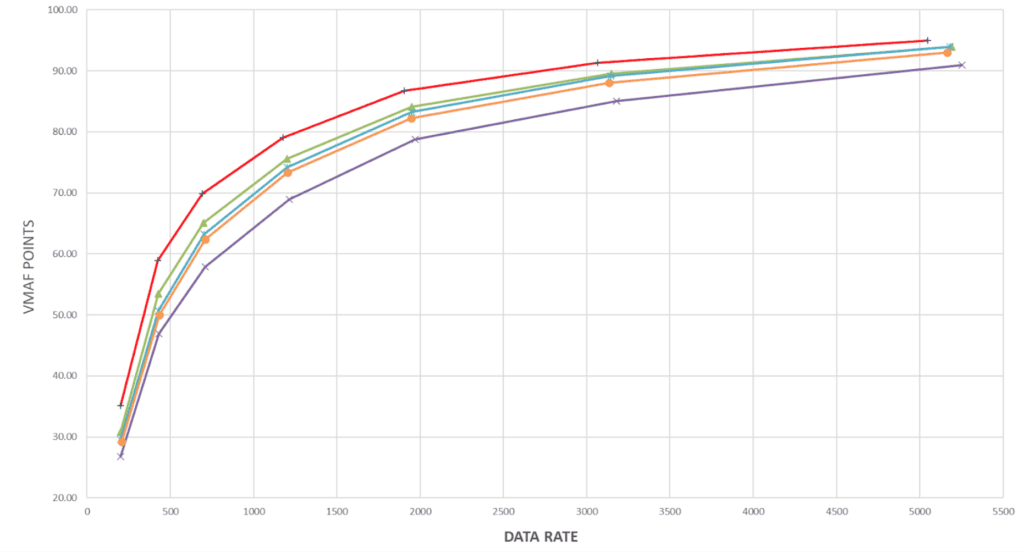
Intuitively, per-title results relate to two different and measurable factors, the efficiency of the encoding ladder and pure encoding performance. We assess the encoding ladder using the convex hull. To measure pure encoding performance, we produced the same defined ladder for four clips with each service and measured overall VMAF, 99th percentile, and low-frame score. You see the overall comparison below.
Interestingly, if you examine Figures 2 and 4, you can pretty much predict how each service will perform in each distribution pattern.
Summary – Comparing Per-Title Encoders
To summarize, when you’re assessing per-title performance:
- It’s useful to compare the services to a theoretically ideal result like the convex hull.
- Your results should incorporate which rungs are actually retrieved by your viewers.
- You should monitor average quality, quality variability, and low-frame quality irrespective of the metric that you use.
- You should run static encoding trials to assess the pure encoding performance of each service.
For more information on the H.264 report, click here. To download an anonymized sample, click here.


