 Streaming Learning Center Where Streaming Professionals Learn to Excel

Related Articles


This article discusses five common errors that can be obscured by automated video quality assessment scripts and how to avoid them.
Most video producers use some measure of automated testing in their codec or encoder comparisons or during normal production. While automated testing is essential, it’s easy to make the five following errors if you don’t spot-check your results. The ideal tool for spot checks like these is the Moscow State University Video Quality Measurement Tool. You can see a demonstration of the tool in this video, which is also presented below.
Contents
Low-Quality Sections at the Start
Many codecs and some encoders produce low-quality regions at the clip’s start. If your test clips are 10or 20 seconds long, these low-quality regions can bias the score significantly. Of course, in the context of a 2-hour live production, these low-quality regions, if limited to the front of the clip, have minimal bearing on overall quality or quality of experience.
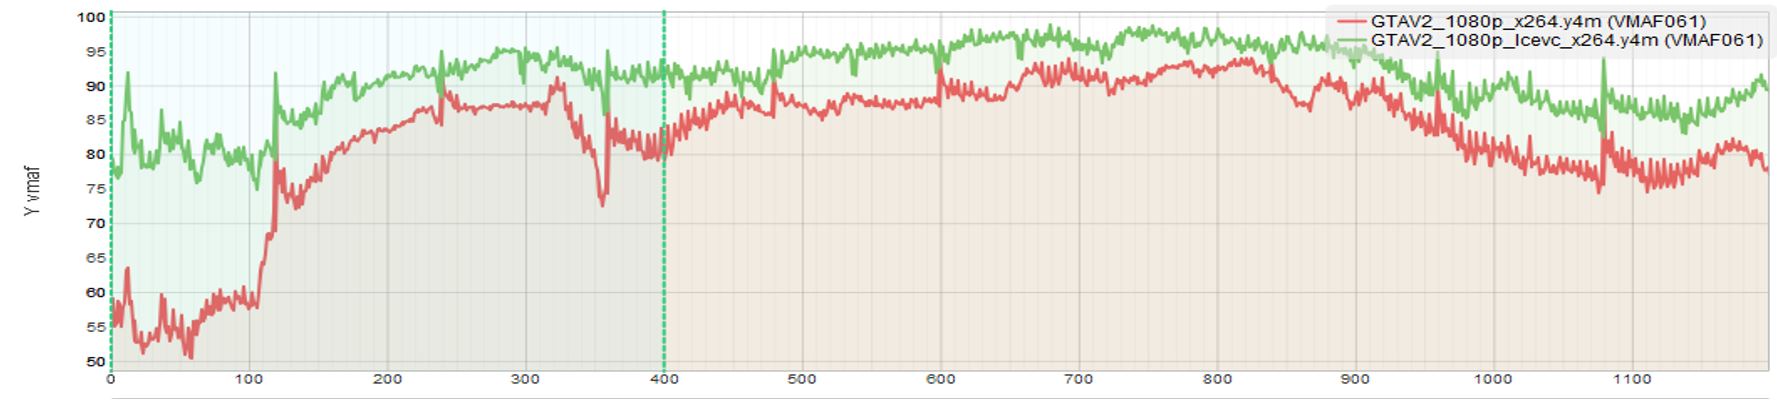
Figure 1 illustrates this point. In this case, I am comparing x264 with LCEVC using x.264 as a base layer codec. The first 120 frames of the x.264 encode are substantially below the average quality of the rest of the file and this was consistent throughout all test clips. Though LCEVC was the clear winner in this comparison, the low-quality region at the start of the clip would overstate its advantage.
There are multiple ways to correct this issue. If the clip is sufficiently long, you can start measuring the quality for all clips after the low-quality region. However, if the clip is a 10-second clip, and the low-quality region is 5 seconds long, this will dramatically impact your score. In these cases, it’s better to concatenate a short segment to the front of the test clip to ensure you can exclude the low-quality region without affecting the overall score.
Misaligned Frames
What’s the difference between the two measurements in Figure 2, one showing a consistently high score, the other showing a much lower and highly variable score? A single frame misaligns the second score.
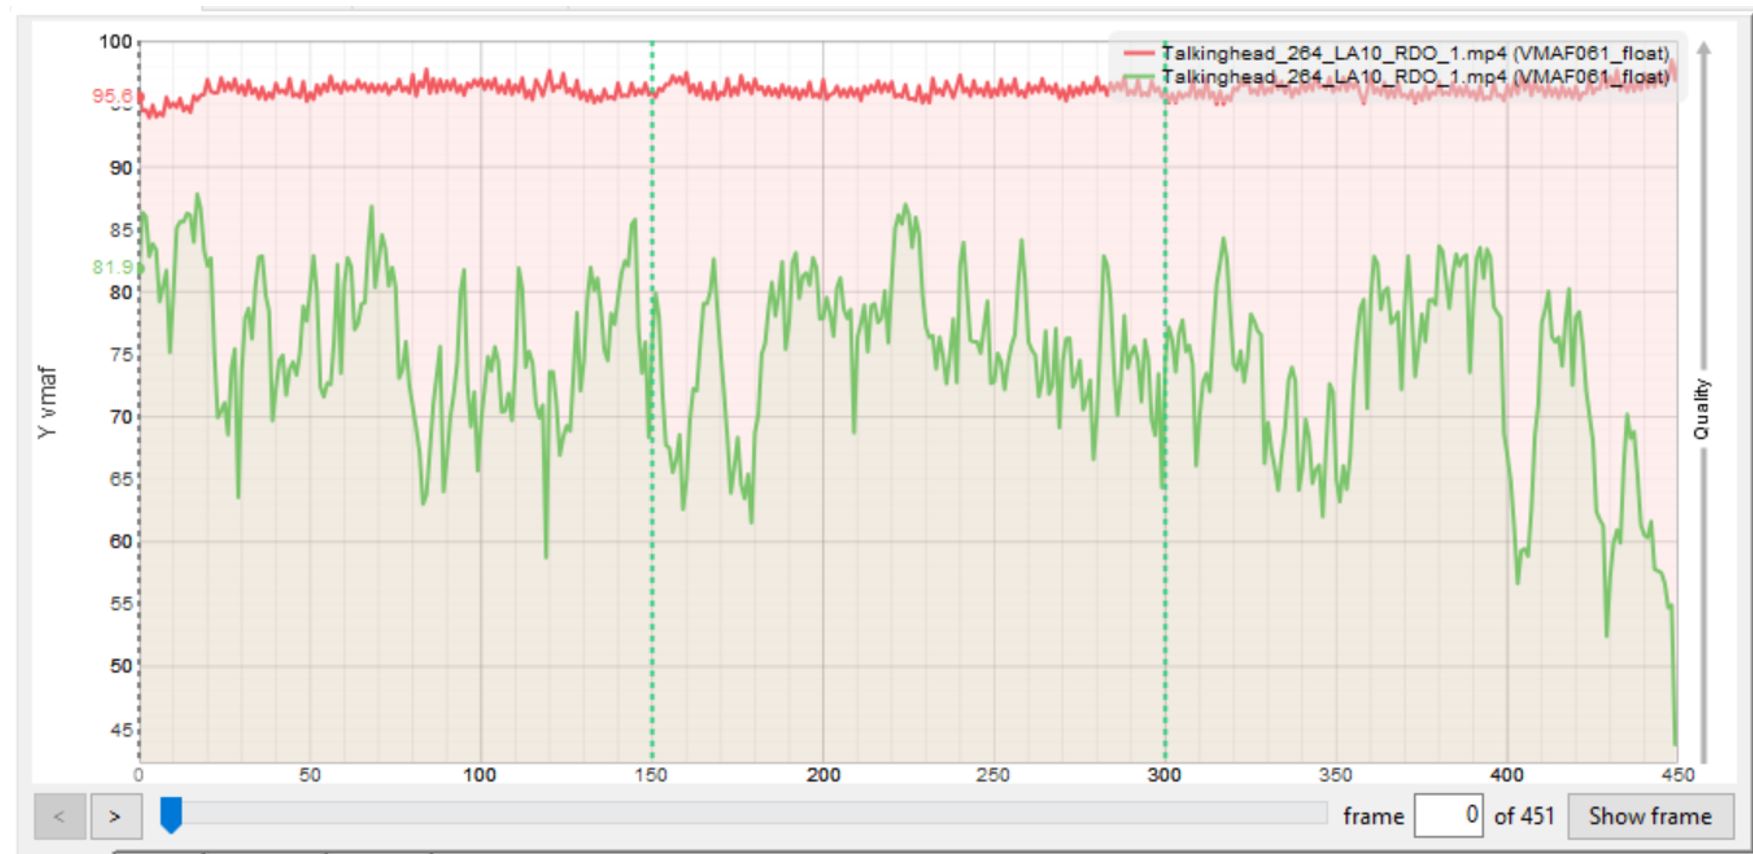
To explain, some encoders add or drop a frame at the start of the clip, creating a misalignment between the source and the encoded video that reduces the metric score, though sometimes insufficient to make the problem obvious. Obviously, a single dropped frame or added frame at the start of the clip won’t affect the quality of experience, so again, you have a metric problem that doesn’t reflect a real-world problem.
The only way to ensure this isn’t happening is to use a tool like the VQMT to display both the source and encoded frame so you can see that they align. Fortunately, if a codec or encoder has this problem, it typically impacts all files equally, so you don’t have to evaluate all of your files. However, if you don’t assess one or two files to detect this, your scores could be artificially low.
How can you resolve this problem once you find it? With VQMT, you can adjust the starting point of either the source or test clip to ensure alignment. If you’re computing scores with FFmpeg or another tool without this capability, you can extract the relevant frames with FFmpeg and test the adjusted file (see this article for instructions).
Missing Quality Variability and Low Frame Scores
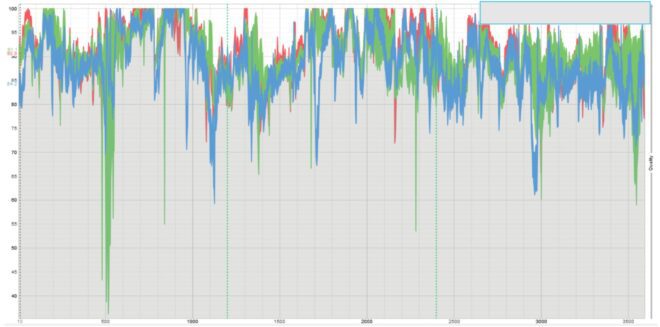
How much of a higher VMAF score does the red clip have in the figure below compared to the green clip? The red clip’s core is 90.96, the green clip, 88.95, a delta of around 2 VMAF points, below the three VMAF points it takes for the typical viewer to notice. So, the technologies are about the same?
Well, no. The lowest quality frame in the red clip has a VMAF value of 65.68, while the equivalent frame in green has a score of 36.22, which extends into VMAF’s “poor” quality range. This, of course, is the downward green spike near the clip’s start. Around 17 seconds in, the viewer will see a slightly blocky sequence of frames that likely will degrade QoE.

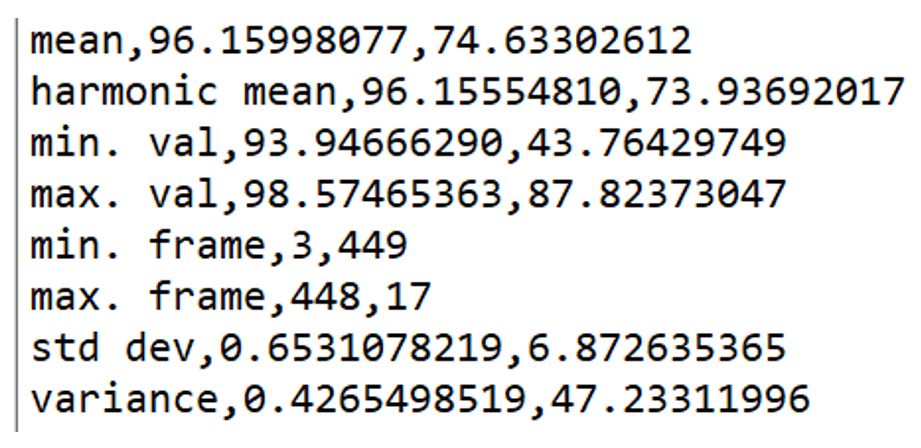
If you compute your average scores using the harmonic mean method, the scoring takes into account quality variability to some degree. You can more directly detect this problem by tracking the low frame score of your encodes or the standard deviation of the quality metric. Figure 4 shows the data that VQMT produces each time it measures file quality. I call min. frame the low-frame score, and std dev is standard deviation. This is for the two files shown in Figure 2.
Of course, a higher standard deviation indicates higher quality variability, which degrades viewer quality of experience. In the absence of data like this, you can scan your test results with a tool like VQMT to identify low-frame regions.
Either way, if the only score you track is average or mean quality, you’re missing one or two components of viewer QoE, meaning your analysis is incomplete. For the most comprehensive encoder or codec comparison, you should track average quality (either mean or preferably harmonic mean), low frame quality, and quality variability.
Low-Quality Frames That Don’t Matter
If you track low frame scores, check the actual frame quality to determine if the low frame scores translate to quality deficits the viewers will perceive. For example, I’ve seen clips where fades to black or very fast transitions created exceptionally low VMAF scores that no viewer would notice. You would want to assess this before identifying these low-frame scores as a potential problem.
One key feature of the Moscow State University VQMT tool is the ability to easily view a frame and compare it to the original using the Show frame button on the bottom right of Figure 2. The ability to easily view these frames, plus the much more detailed quality graphs, are the key differentiators from the free FFMetrics Tool.
Using the Incorrect VMAF Model
The thing about automating test procedures is that you create the scripts once, test them on multiple files, and then apply them to hundreds of files thereafter. Most of the time, this can work well. With VMAF, though, where your model needs to change based on file resolution, it’s easy to use the default model for 4K files and get a distorted score. A quick spot check with VQMT, which uses the 4K model by default with 4K files, will reveal this problem.
These are just five of the many issues manual inspection has revealed that automated testing would obscure. If you’ve done VQ testing long enough, I’m sure you have your own examples.
The bottom line is that automated testing scripts are fabulous time savers, allowing you to identify your test files and encoding parameters, press the Go button, and later gaze admiringly at your Rate-Distortion curves and BD rate comparisons. However, unless you spot-check at the back end, your gorgeous output could be hiding some very incorrect results.
Remember, the art of video encoding is in the details, and it’s through these meticulous practices that you can truly ensure a high-quality experience. Join us in our Streaming Media 101 course to delve deeper into mastering these techniques and revolutionizing your video content.
Here’s the YouTube video demonstrating VQMT.


