 Streaming Learning Center Where Streaming Professionals Learn to Excel

Related Articles


Companies attempting to formulate the ideal encoding ladder for specific videos or classes of content should incorporate both the harmonic mean VMAF score for overall quality and the percentile score to minimize transient quality issues.
I’ve spent much of the last few weeks benchmarking H.264 and HEVC cloud-based per-title encoding capabilities like those available from AWS Elemental, Microsoft Azure, Brightcove, and other services to identify which produces the optimal blend of quality and bandwidth savings. My plan is to release a report on my findings in early 2022.
The high-level plan was to define the “ideal” encoding ladder for 23 test clips using a technique derived from Netflix’s convex hull-based methodology. Then I would compare this theoretically “ideal” ladder to the ladders produced by the different per-title encoding cloud services.
Contents
Step 1: Target 95 VMAF Points
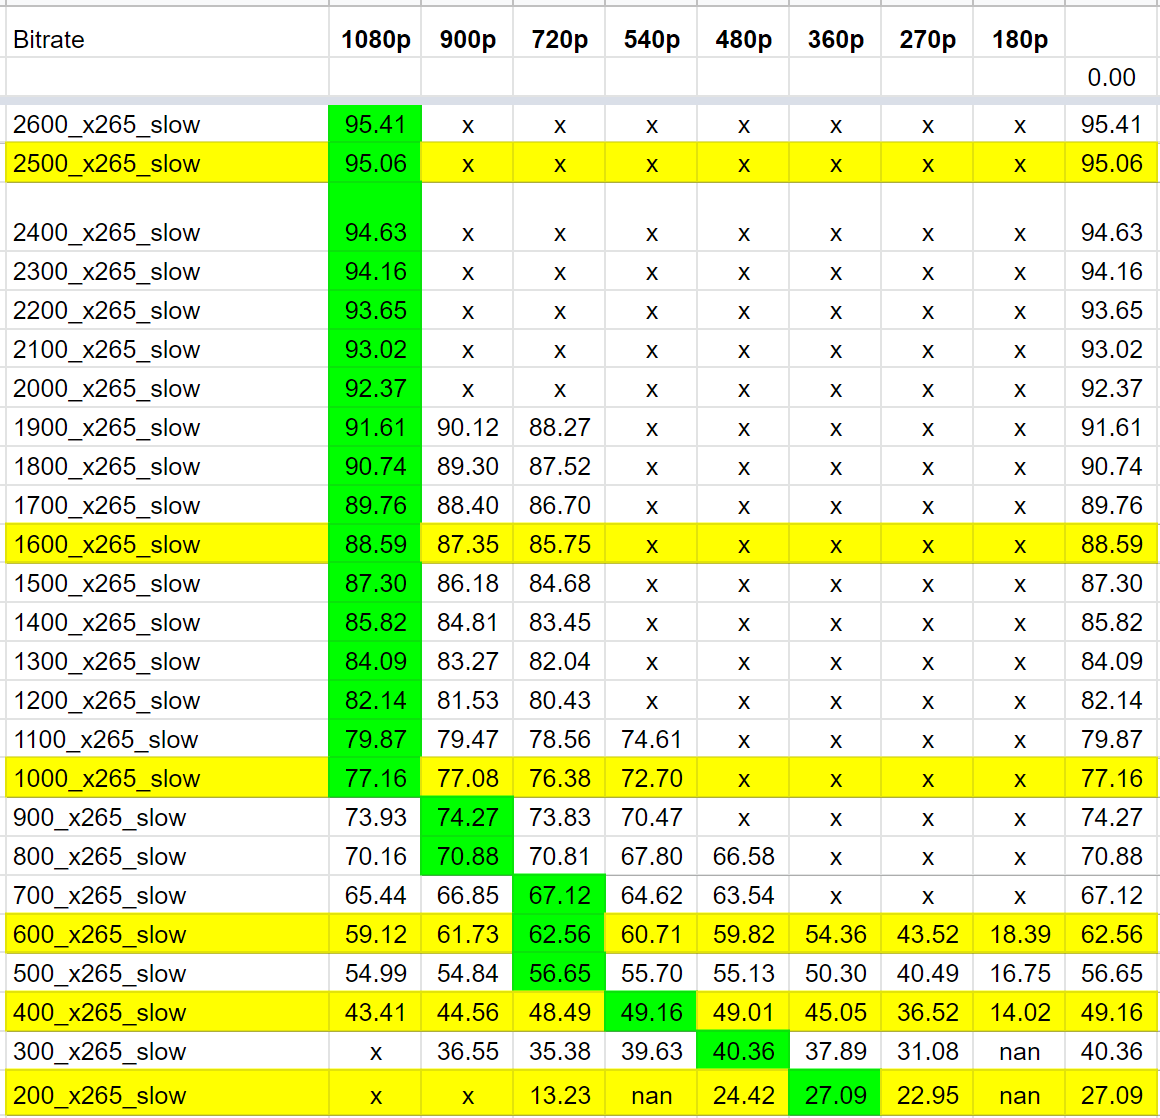
Figure 1 represents the data from the brute-force convex hull technique, with data rates in the rows and different resolutions in the columns. For this file, the top rung would be 2500 kbps because it was the first rung that topped VMAF 95 (a generous target). I multiplied this data rate by .6 to identify the data rate for the next rung (Apple: optimal spacing should be between 1.5 – 2x apart), then used the resolution that produced the highest quality at that bitrate.
So, in Table 1, which is an HEVC encode, rungs 1, 2, and 3 would all be 1080p, with the 600 kbps rung at 720p, 400 kbps at 540p, and 200 kbps at 360p. For reasons explained here, if this technique suggested a ladder with all rungs higher than 720p, I would overrule these results and manually set the bottom two rungs at 720p and 360p.
The Big Oops. What About Transient Quality Problems?
I built the “ideal” H.264 and HEVC ladders for the 23 test clips and then started comparing them to the output of the per-title services, comparing both overall (harmonic mean) and low-frame VMAF scores, the latter an indicator for the potential for transient quality issues. In many instances, the convex hull approach delivered a much lower with similar harmonic mean and low-frame scores, indicating that it was a better approach.
With other files, however, a higher data rate delivered fewer and less severe transient quality issues. You see this in Figure 2, the Results Plot from the Moscow State University Video Quality Measurement Tool showing the VMAF score for two encoded files over the file duration. The red file, encoded at 2100 kbps, exhibited more transient quality problems than the green file encoded at 3400 kbps, and more severe quality issues.
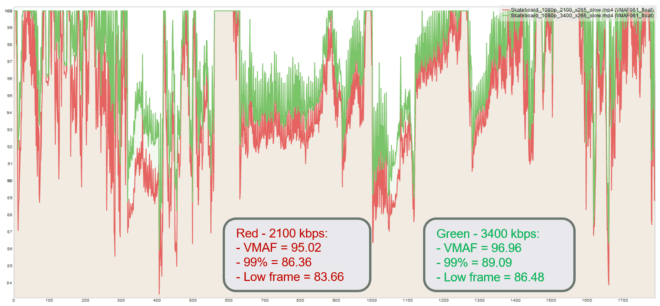
In this case, which ladder was “ideal,” the 2100 kbps file with the lower bitrate or the 3400 kbps file with fewer and less severe transient issues? My conclusion was that most producers would prefer the 3400 kbps ladder. Clearly, I had to incorporate a transient-related quality measure into the top rung selection.
Step 2: Consider the 99th Percentile
For the record, note that by using the harmonic mean method of VMAF scoring I was incorporating some measure of score variability (see here), but clearly, it wasn’t enough to account for the differences I was seeing. Fortunately, a colleague on LinkedIn suggested “perhaps is it worth to replace Low-frame VMAF with 5% percentile to eliminate an impact of outliers (or “black swan” – in statistics jargon – very rare event).” I didn’t want to eliminate the low-frame score because I thought it was relevant but wondered whether incorporating the percentile score as well might provide relevant guidance.
So, I Googled percentile score and learned:
The most common definition of a percentile is a number where a certain percentage of scores fall below that number. You might know that you scored 67 out of 90 on a test. But that figure has no real meaning unless you know what percentile you fall into. If you know that your score is in the 90th percentile, that means you scored better than 90% of people who took the test.
See here for a tutorial on how to compute the percentile score in Google Sheets and here for Excel.
To use the percentile measure, I needed two numbers, the first the score to target, the second the percentile. I chose the 89 VMAF score because it was 6 points (or one Just Noticeable Difference) from 95, the target VMAF score.
I experimented with 5% (as my colleague suggested) but almost all files that met the 95 VMAF score showed 95% of frames over 89. Then I tried 1% (or 99%) and found that boosting the top bitrate until:
a) The harmonic mean score was 95 or higher and
b) The 99 percentile score was 89 or higher
addressed most of the problems I was seeing in the HEVC encoding ladders. About 40% of the ladders needed a data rate boost upwards, while the remaining 60% were good as is. When I started comparing the newly formulated ladders with the third-party ladders I saw very few instances where either low-frame score or the 99% score convinced me that the third-party ladder produced a better result. I had found my “ideal” ladder (at least for HEVC).
I should say that for all files, the peak bitrate was 6 Mbps and that several files were unable to meet both the harmonic mean and percentile score tests. In those cases, I simply used 6 Mbps as the top rate.
Work to Come
Discussing this procedure with other colleagues resulted in two additional potential areas for improvement.
- Target a percentile for the low-frame scores to create a third measure. In essence, in addition to the harmonic mean and 99 percentile scores above, boost the data rate until a percentage of the low-frame scores exceeded a certain number (perhaps 99% exceed 83, or 12 points/2 JNDs).
- Use the percentile measure to choose the best resolution at each selected data rate.
The bottom line is that if you only consider the harmonic mean metric score (irrespective of metric), you’re ignoring quality variability factors that could negatively impact QoE. Adding the percentile score goes a long way towards minimizing those issues.


