Streaming Learning Center Where Streaming Professionals Learn to Excel

Related Articles


Moscow State University’s Video Quality Measurement Tool (VQMT, $999 with volume discounts available) is my go-to desktop tool for computing metrics like VMAF, PSNR, and SSIM. The program is easy to use, has great visualization tools, and lets me inspect videos on a frame-by-frame basis. MSU recently released version 12 which has three great enhancements.This article covers these plus this video.
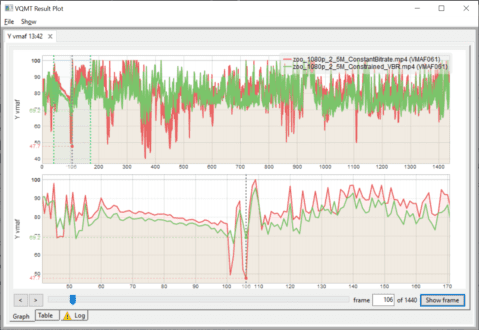
VQMT’s key visualization tool is shown in the image above, which is the VQMT Results Plot that tracks the per-frame metric scores of the two videos analyzed, one encoded via CBR (in red) the other 200% constrained VBR (in green). The top plot shows the entire file, the bottom plot shows the highlighted region from the top. In both plots, the downward drops in the CBR file are potential problem areas that I can easily check by clicking Show Frame on the bottom right, which opens another view that lets me toggle through the original and both encoded frames at that location (see image below).
All this was in place in previous versions; here are my three favorite improvements in version 12. First, analysis performance has been increased, particularly with VMAF. On my HP ZBook notebook, version 12 computed VMAF about 33% faster than version 11.2. Since VMAF incorporates four separate metrics, it’s always much slower than other metrics and a 33% speed boost is significant.
Second, as shown in the figure below, you can now see the metric frame scores for both compressed videos on the upper right of the frames. If you click to see the image in full screen you’ll spot the scores and the visual difference between the frames. In addition to the side-by-side view, you can also toggle between the source and compressed video frames via hotkeys, which I find more useful in practice for visualizing subtle frame differences.

The third new feature is the expanded data that you get back from the file analysis. In previous versions, you received only the metric scores for the one or two files analyzed. As you can see in the figure below, you now get multiple additional data points, including:
- Harmonic mean, which gives more weight to lower frame scores
- Lowest frame score (and location)
- Highest frame score (and location)
- Standard deviation, which measures the variations in the frame scores
- Variance, which is another measure of the variations in the frame scores

I’m most excited about the harmonic mean, which gives weight to the negative frames in the video. Here’s an explanation from my contact at MSU.
For metrics where higher scores are better, such as SSIM, PSNR, VMAF, the viewer might be dissatisfied, for example, if during a 50-second video, 5 seconds had PSNR of 20 and 35 seconds had a PSNR of 50. The arithmetic mean will be (50*35 + 20*15)/50 = 41 which is quite good, because the higher scores last for longer than the poorer scores. The harmonic mean will be 50/(35/50 + 15/20) = 34.5 which closer to reality, because low values have higher priority.
The two files analyzed in the CSV file are the two files shown in the image atop this article. You can see that the CBR file has serious transient quality issues, but the CBR file actually had a higher mean VMAF score, 80.26 to 79.75. However, the scores flipped for the harmonic mean, which VBR won 79.03 to 78.83. If you consider the standard deviation (CBR=10.05, VBR=7.7) and the low frame scores (CBR=40.27, VBR=61.38), you get a clear feeling that the CBR file has some major problems. Throw in the ability to actually view the low-quality frames that carried through from previous versions and you get a really complete picture of the quality delta between the two bitrate control techniques.
You shouldn’t make metric-based decisions on a single number, particularly an average score. VQMT always had the ability to visualize the results plot and frames, but the added numbers are marvelous data points for anyone using video quality metrics to make encoding-related decisions.
Want to Learn More?
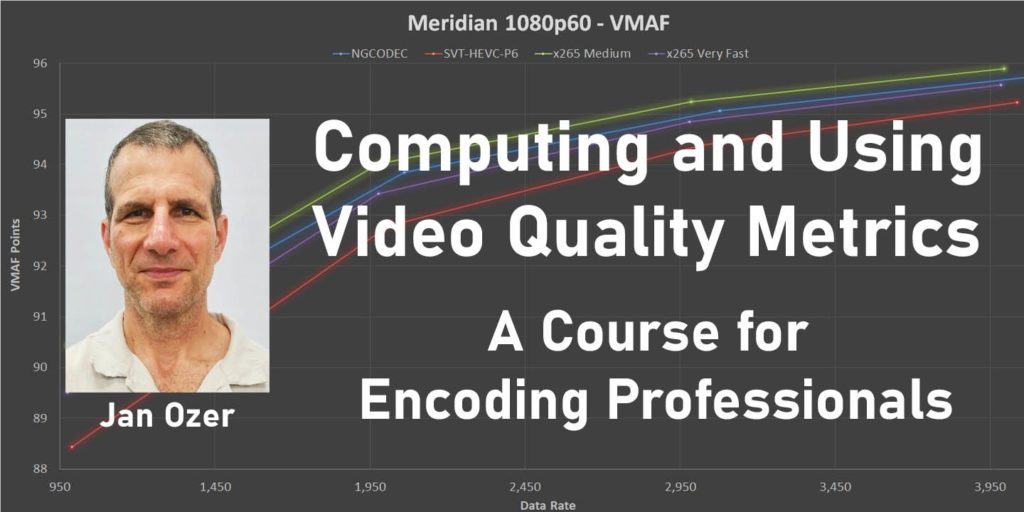
For more information on computing and using video quality metrics, I have a video course with over 3 hours of video instruction. For more on the course, click the course image below, or click here.