 Streaming Learning Center Where Streaming Professionals Learn to Excel

Related Articles


While standards-based video codecs like H.264 and HEVC tend to dominate, standards-based video quality metrics have never risen to the same usage or attention level. With two innovative and highly accurate metrics now available from the ITU-T, this may change in the near term. Briefly, these models are:
- ITU-T Rec. P.1203, which calculates the quality of HTTP Adaptive Streaming (HAS) sessions, taking into account video quality and QoS factors like latency and stalling. It is the first standardized metric of its kind.
- ITU-T Rec. P.1204, which computes the quality for H.264, H.265 and VP9 video files, producing better-than-VMAF accuracy while the standard family’s 1204.3 operates as a “bitstream-based no reference model.” This means that you don’t need the source file to compare to the encoded file so you can compute P.1204.3 anywhere in the delivery ecosystem.
I pulled the information in this article from a technical report entitled “ITU-T Standardized Bitstream-based Video Quality Models” that’s publicly available here. The authors of that document answered questions and reviewed this document for accuracy.
After briefly discussing the parties involved in creating these standards, I’ll describe how they’re different, how they work, and their respective accuracy.
Contents
About the Video Quality Experts Group (VQEG)
The ITU Telecommunication Standardization Sector (ITU-T) coordinates standards for telecommunications and Information Communication Technology. When setting quality-related standards, the ITU-T often coordinates with the Video Quality Experts Group (VQEG), an independent group that “provides a forum, via email lists and face-to-face meetings for video quality assessment experts to exchange information and work together on common goals.” As the VQEG About Page states, “[s]everal VQEG studies have resulted in ITU Recommendations.”
ITU-T’s Study Group 12, Question 14 develops standards independently from VQEG, primarily focusing on bitstream-based, parametric video quality models that do not require access to any video signals or the reference video (more in the following section), and are therefore comparatively lightweight and usable within a network context, or directly at the client device.
Finally, the Technical University of Ilmenau (TU Ilmenau) Audiovisual Technology Group, is actively involved in the standardization of video quality models within Question 14. I mention TU Ilmenau because they are a source for reference software for both standards described here.
With this as background, let’s examine perhaps one of the most important characteristics of both P.1203 and P.1204.3.
Bitstream-Based Metrics In General
Most quality metrics like PSNR, SSIM, and VMAF are full-reference metrics, which means they compare the encoded file to the source to compute the score. This is time-consuming and means that the metric can only be applied where the source file is available.
In contrast, the new ITU-T recommendations addressed here largely use bitstream-based metrics that analyze the bitstream but don’t actually decode the file or compare it to the original. Here’s a blurb about how they work in P.1204.3 from the TU Ilmenau report:
The model itself operates on features extracted from the video bitstream, and it combines classical approaches for determining video quality with machine learning in order to improve its prediction accuracy. The bitstream is parsed, and features about its quantization parameters, motion vectors, frame sizes, etc. are extracted. The P.1204.3 model then integrates those features into a final MOS per video sequence.
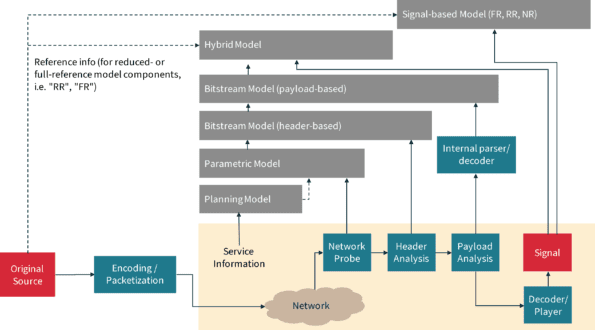
Bitstream-based metrics are much less CPU-intensive to apply than full reference metrics and can be deployed anywhere in the delivery ecosystem (the featured image at the top of this article illustrates the difference, and identifies other types of metrics). Of course, to steal a phrase from the real-estate industry, the three most important things about quality metrics are accuracy, accuracy, and accuracy, or more specifically how accurately they predict human subjective scores. Hold that thought, which we’ll return to for both models.[/vc_column_text][/vc_column][/vc_row]

ITU-T Rec. P.1203
Let’s take a closer look at P.1203. As mentioned, the ITU-T Recommendation P.1203 predicts the Quality of Experience (QoE) for HTTP adaptive streaming (HAS) services. It consists of one main and three sub-recommendations:
- ITU-T P.1203 – Parametric bitstream-based quality assessment of progressive download and adaptive audiovisual streaming services over reliable transport
- ITU-T P.1203.1: Video quality estimation module (short-term, providing per-one-second output information)
- ITU-T P.1203.2: Audio quality estimation module (short-term, providing per-one-second output information)
- ITU-T P.1203.3: Audiovisual integration and integration of final score, reflecting remembered quality for viewing sessions between 30 s and 5 min duration
Like many other quality models, P.1203 outputs quality in terms of Mean Opinion Scores (MOS) on a scale from 1–5, where 1 refers to bad quality, and 5 to excellent.
Figure 1 shows how the model works in operation. The audio and video modules use information obtained from parsing the bitstream and deliver MOS data to the third module, which incorporates initial loading delays, stalling, and other delivery-related data, and outputs a final score. Note that this score also factors in the device used for viewing in the overall MOS, so the same stream delivered to a mobile phone might have a higher score than a stream viewed on a much more discriminating TV.
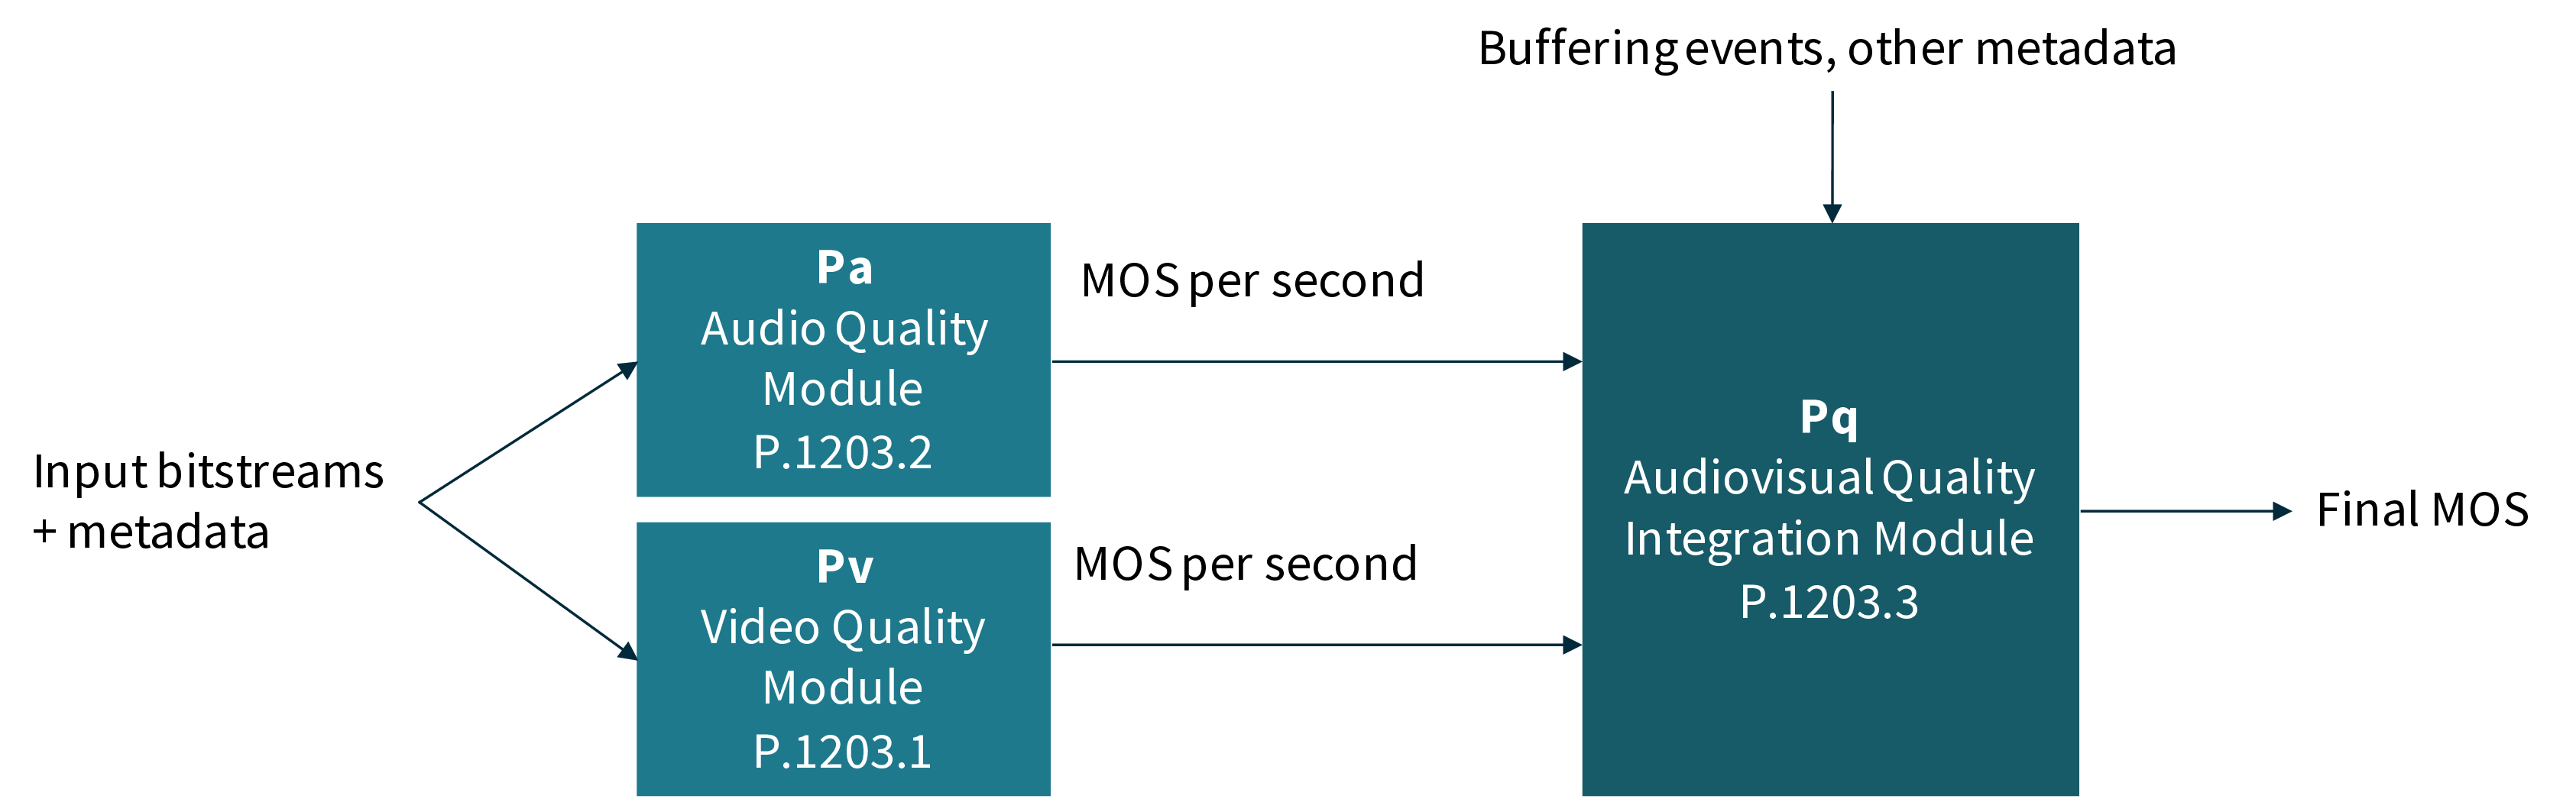
Figure 1. P.1203 in operation.
You can compute P.1203 on video streamed to mobile devices or shown on laptops, PCs or TVs, for sequences up to 5 minutes length, with resolutions of up to 1080p HD and frame rates of up to 30 fps. Video must be coded with the H.264 codec; various audio codecs (including AAC) are supported. For other video codecs, an extension developed by TU Ilmenau is available.
Operationally, you can run the P.1203 model live or after the event. Both for live measurements or calculations after a streaming session, you need to have access to at least the codecs used for transmission, bitrates, frame rates and resolutions, as well as any buffering happening at the client side. The video/audio-related data can be collected from the segments produced at the server or the DASH/HLS manifest, and buffering is usually logged by the player itself.
P.1203 Operating Modes
Before addressing P.1203 accuracy, understand that P.1203.1, the video quality estimation module, offers four modes of operation, depending on the available information from the audiovisual stream and the required/available computational resources, shown in Figure 2.
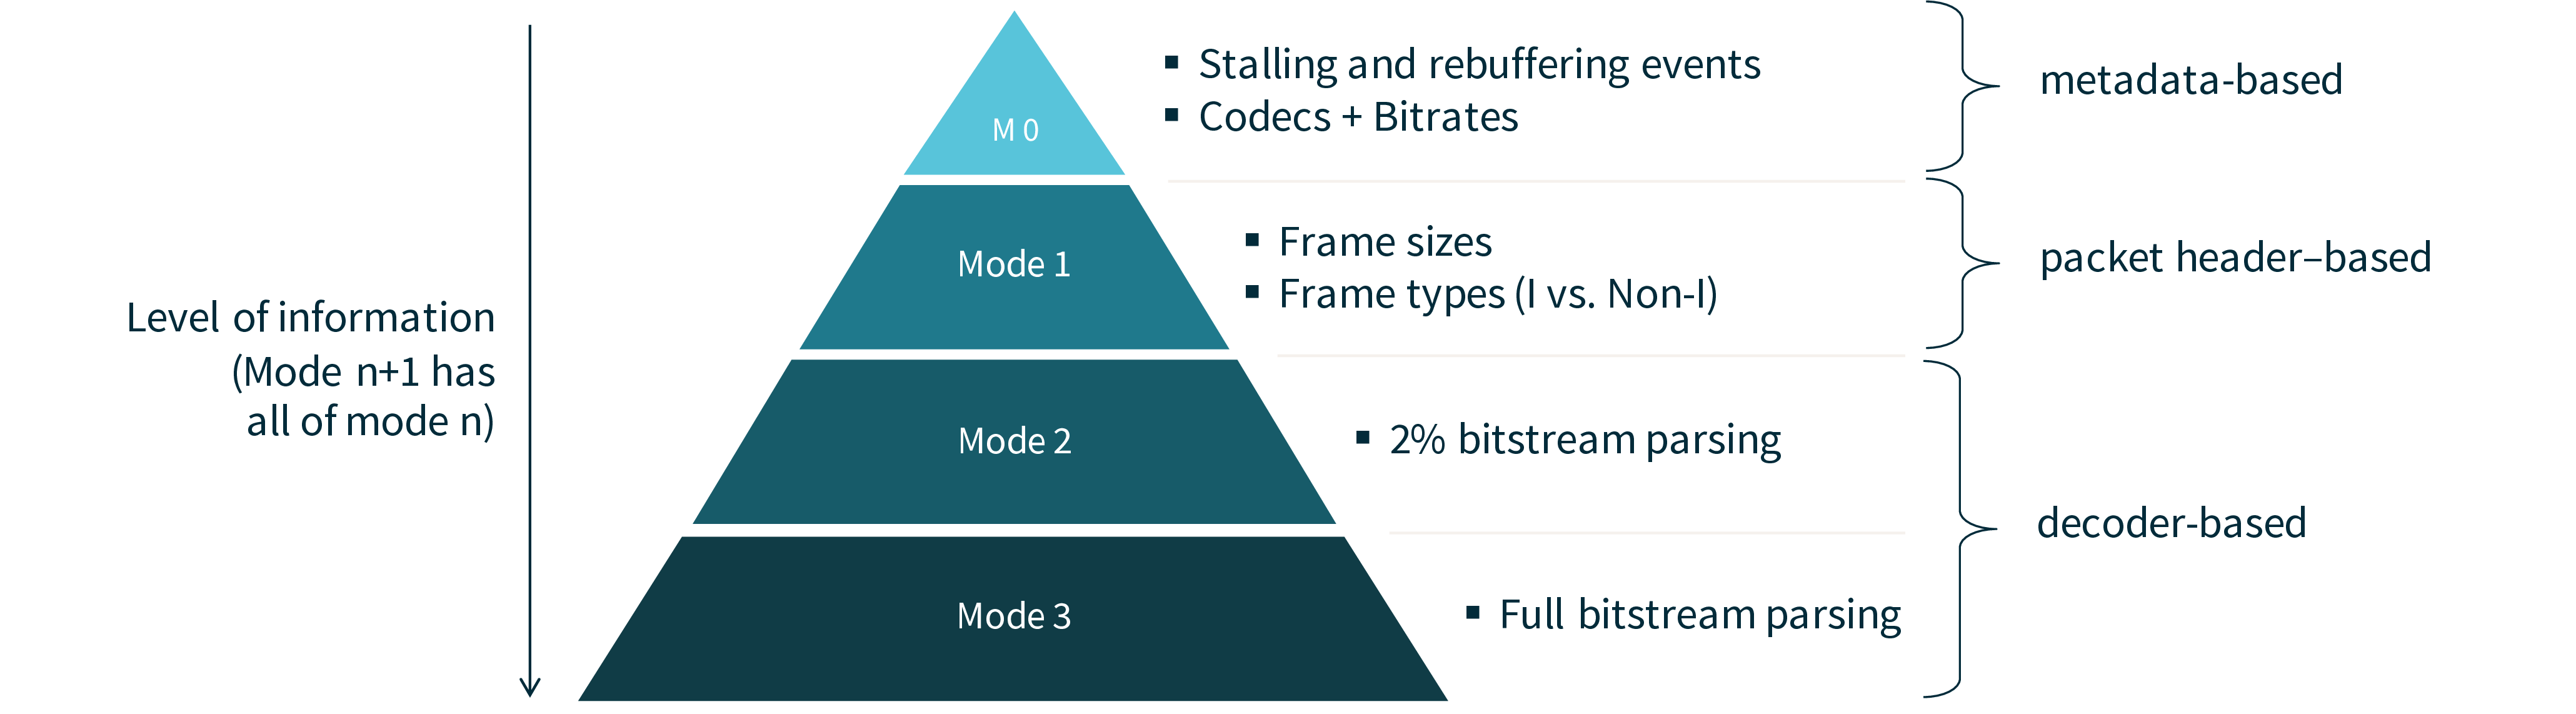
Figure 2. Different modes for estimating video quality.
P.1203’s simplest mode of operation (mode 0) incorporates codecs, bitrates, resolution, and frames per second. In addition to the Mode 0 data, Mode 1 can inspect the packet headers of the transmitted stream to obtain frame sizes and types. Modes 2 and 3 have access to the bitstream itself, where mode 2 only accesses 2% of the stream to reduce computing efforts.
Mode 0 can be used with the information that is available in HAS manifests, as these include the required information for each rung in the encoding ladder. Mode 3 can be used with the information available in the transmitted bitstream; it can be extracted from the streams before they are transmitted (e.g. on the origin or the CDN), during transmission (e.g. via probes deployed in the network itself), or at the client device itself.
All models also need player-related data like loading delays, stalling, and quality switches.
P.1203 Accuracy
To gauge the accuracy of video quality metrics, you gather subjective Mean Opinion Score (MOS) ratings from a number of actual viewers, run the metric and compare the MOS scores. There are numerical and visual representations of how closely the metric matches the subjective data.
One numerical measure is the Pearson Correlation Coefficient (PCC), which “measures the strength and direction of linear relationships between pairs of continuous variables.” According to the same source, scores range from between +1 and −1. A value of +1 is total positive linear correlation, 0 is no linear correlation, and −1 is total negative linear correlation. According to another source, “[i]f the coefficient value lies between ± 0.50 and ± 1, then it is said to be a strong correlation.”
With this as prologue, according to the official ITU-T document, P.1203 offers a Pearson Correlation of 0.81 to 0.89 depending on the mode used. Obviously, this means a strong correlation for all modes.
The visual representation of accuracy is shown in Figure 3, with the top four graphs showing performance in mobile trials and the bottom four in computer trials. All graphs track the accuracy of the subjective metric on the vertical plane and the objective metric on the horizontal. If the scores were identical in every case the result would be a solid line from the lower left to the upper right.
Of course, no metric is ever 100% correct, so the closer the pattern is to that solid line, the better the performance. Scanning the graphs, all are fairly accurate with the pattern slowly growing more condensed around the midline in models 2 and 3, particularly in the PC tests. To see what inaccurate looks like, check out the PSNR graph later in this document.
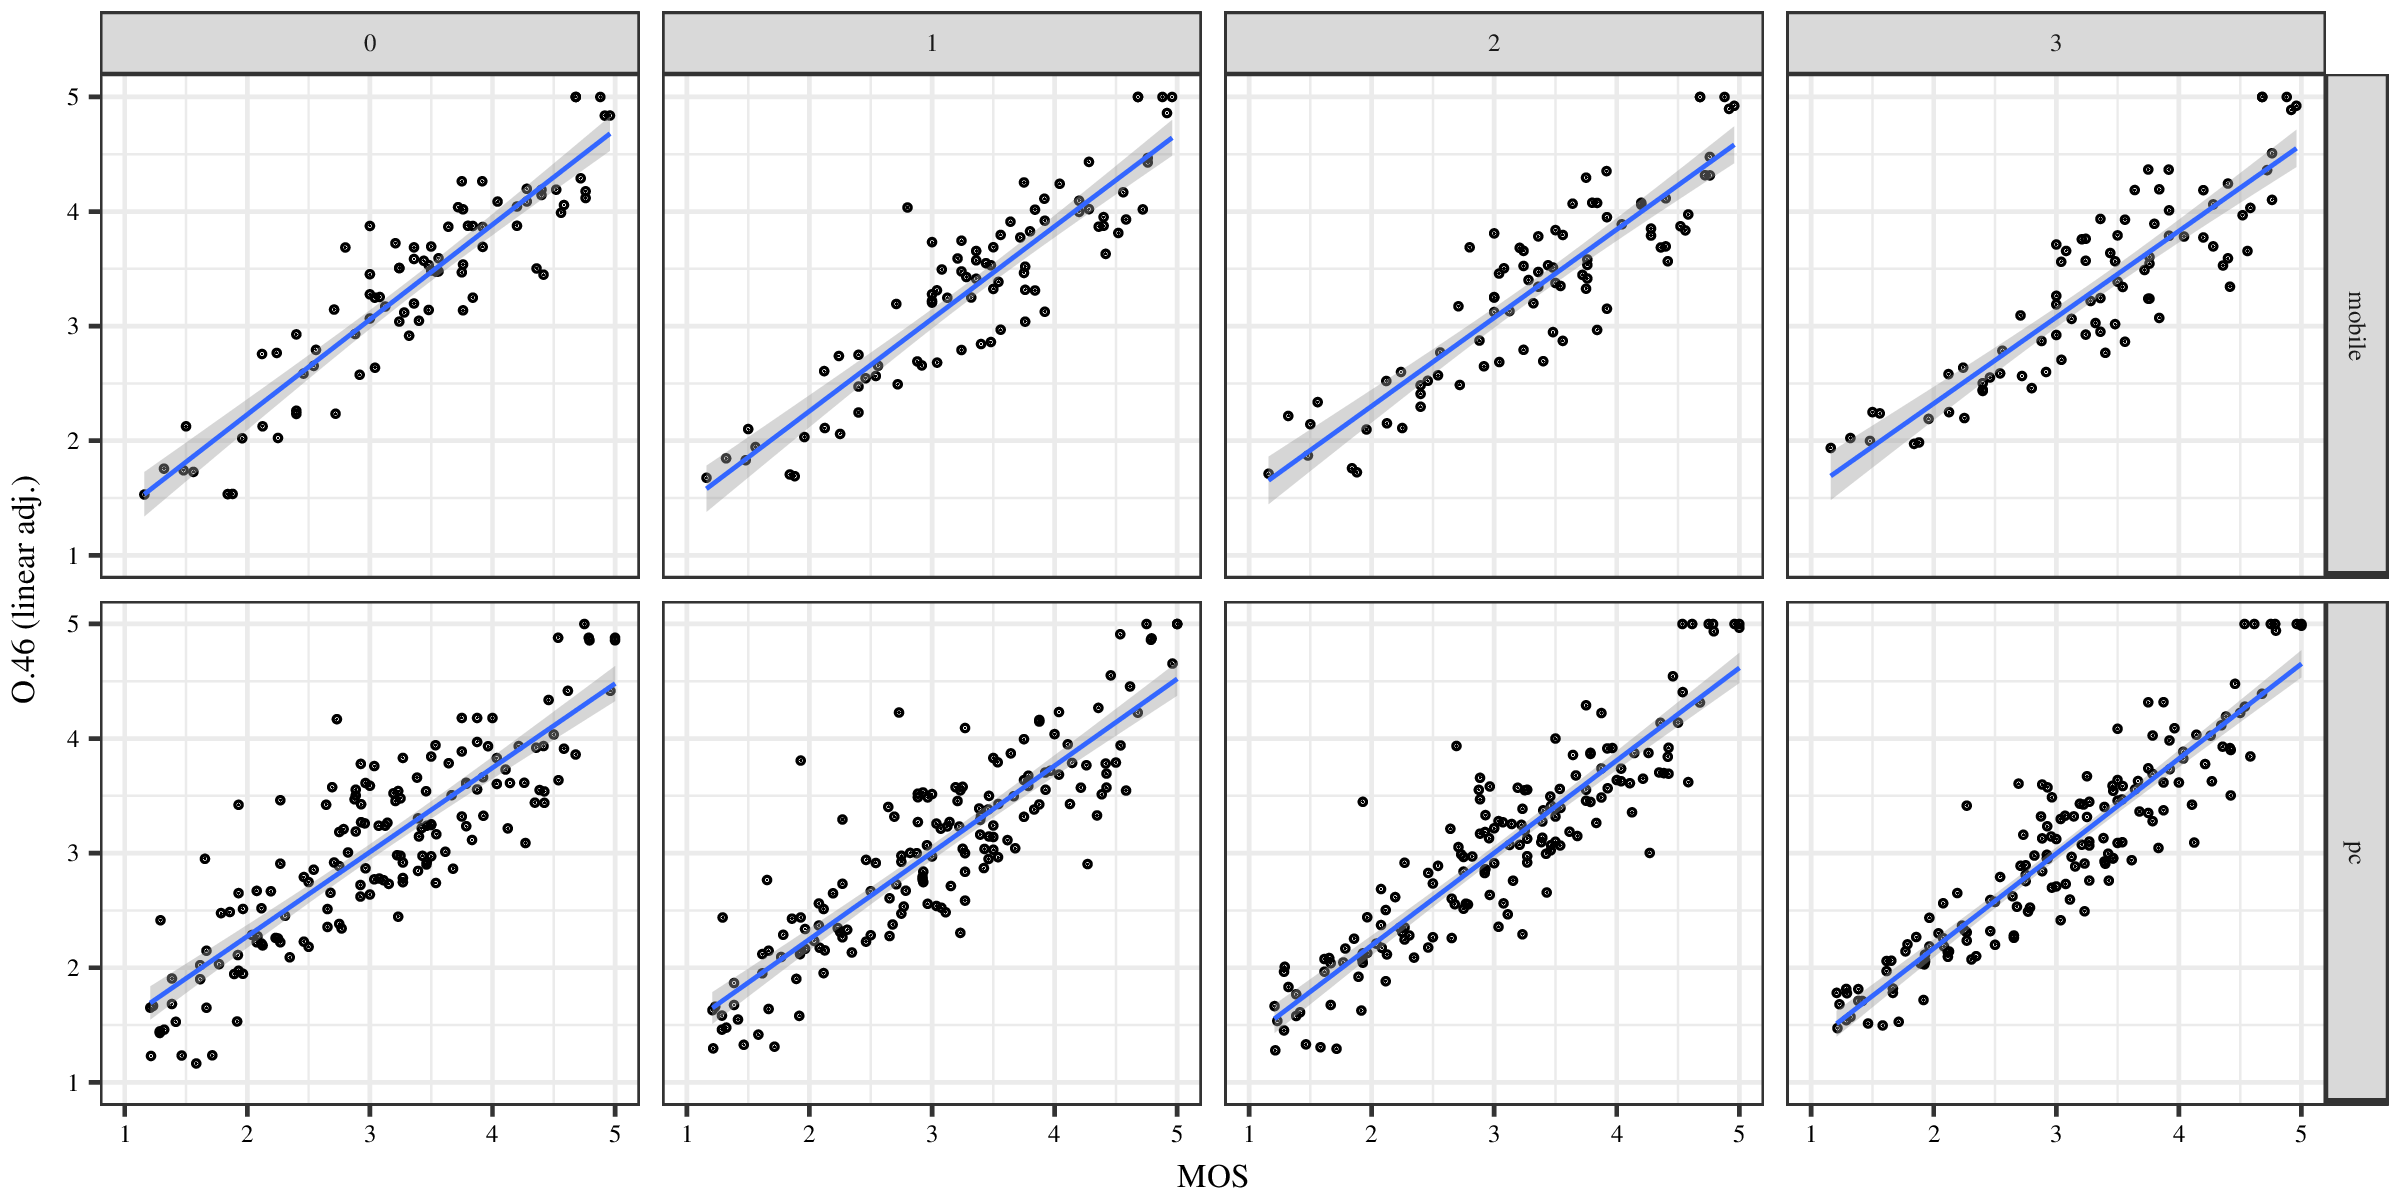
Figure 3. P.1203 performance. Click the figure to view it at full resolution.
Note that the databases used for this comparison are available publicly and have been published in a conference paper. They are part of the official training/validation databases from the P.1203 standardization process.
To summarize, P.1203 is the first metric that attempts to measure QoE by incorporating both visual quality and QoS performance and uses a bitstream-based model that can be efficiently applied anywhere in the delivery ecosystem. This could make it tremendously valuable to all streaming producers once available in commercial tools.
As of today, however, there do not seem to be any commercial tools available integrating the model. However, a reference software for ITU-T P.1203 is available at https://github.com/itu-p1203/itu-p1203/ and can be used freely for research purposes. The model has been used successfully in various academic publications, including an evaluation conducted by Susanna Schwarzmann et al., which won the DASH-IF’s Excellence in DASH Award 2020.
Now let’s have a look at P.1204.
ITU-T Rec. P.1204
P.1204 has three models published in collaboration with the Video Quality Experts Group (VQEG).
- ITU-T P.1204.3: Bitstream-based model
- ITU-T P.1204.4: Pixel-based (Reduced Reference, similar in design and equivalent in performance to Full Reference)
- ITU-T P.1204.5: Hybrid model
This post focuses on the bitstream-based model, which can work with up to 4K video resolution, frame rates up to 60 fps, and up to 10-bit bit depths encoded with the H.264, H.265, and VP9 codecs.
P.1204 Accuracy
As a brand-new metric for sequences of up to 5 min duration, P.1203 had no metrics to compare to and few publicly available datasets to test against. In contrast, though, P.1204.3 is for short-term video, bitstream-based, and competes against full-reference metrics like PSNR, VMAF, and SSIM.
In their report, TU Ilmenau provided comparisons with PSNR, SSIM, MS-SSIM, and VMAF using the publicly available dataset AVT-VQDB-UHD1 that was not part of the ITU-T training and validation datasets used during P.1204’s development. This data set consists of four different subjective tests with a total of 756 evaluated sequences, resulting in 19,620 human ratings.
The P.1204.3 model was run on all sequences from the four databases. In addition, PSNR, SSIM, MS-SSIM and VMAF were calculated for the same sequences.
Figure 4 shows the comparison of the predictions from each of these metrics and the actual subjective ratings for all the tested sequences, where each point corresponds to one sequence in the dataset. As you can see from the graphs, P.1204.3 presents the tightest cluster, meaning the most accurate prediction of subjective scores.
The PCC (Pearson Correlation Coefficient) ratings atop each graph also show P.1204.3 to be the most accurate, with a startlingly high rating of 0.942, with VMAF second at 0.873. Though the results for MSSIM, PSNR, and SSIM are all above the .5 threshold previously identified as proving a strong PCC correlation, the graphs present a discouraging picture for anyone seeking to predict actual subjective quality with these metrics.
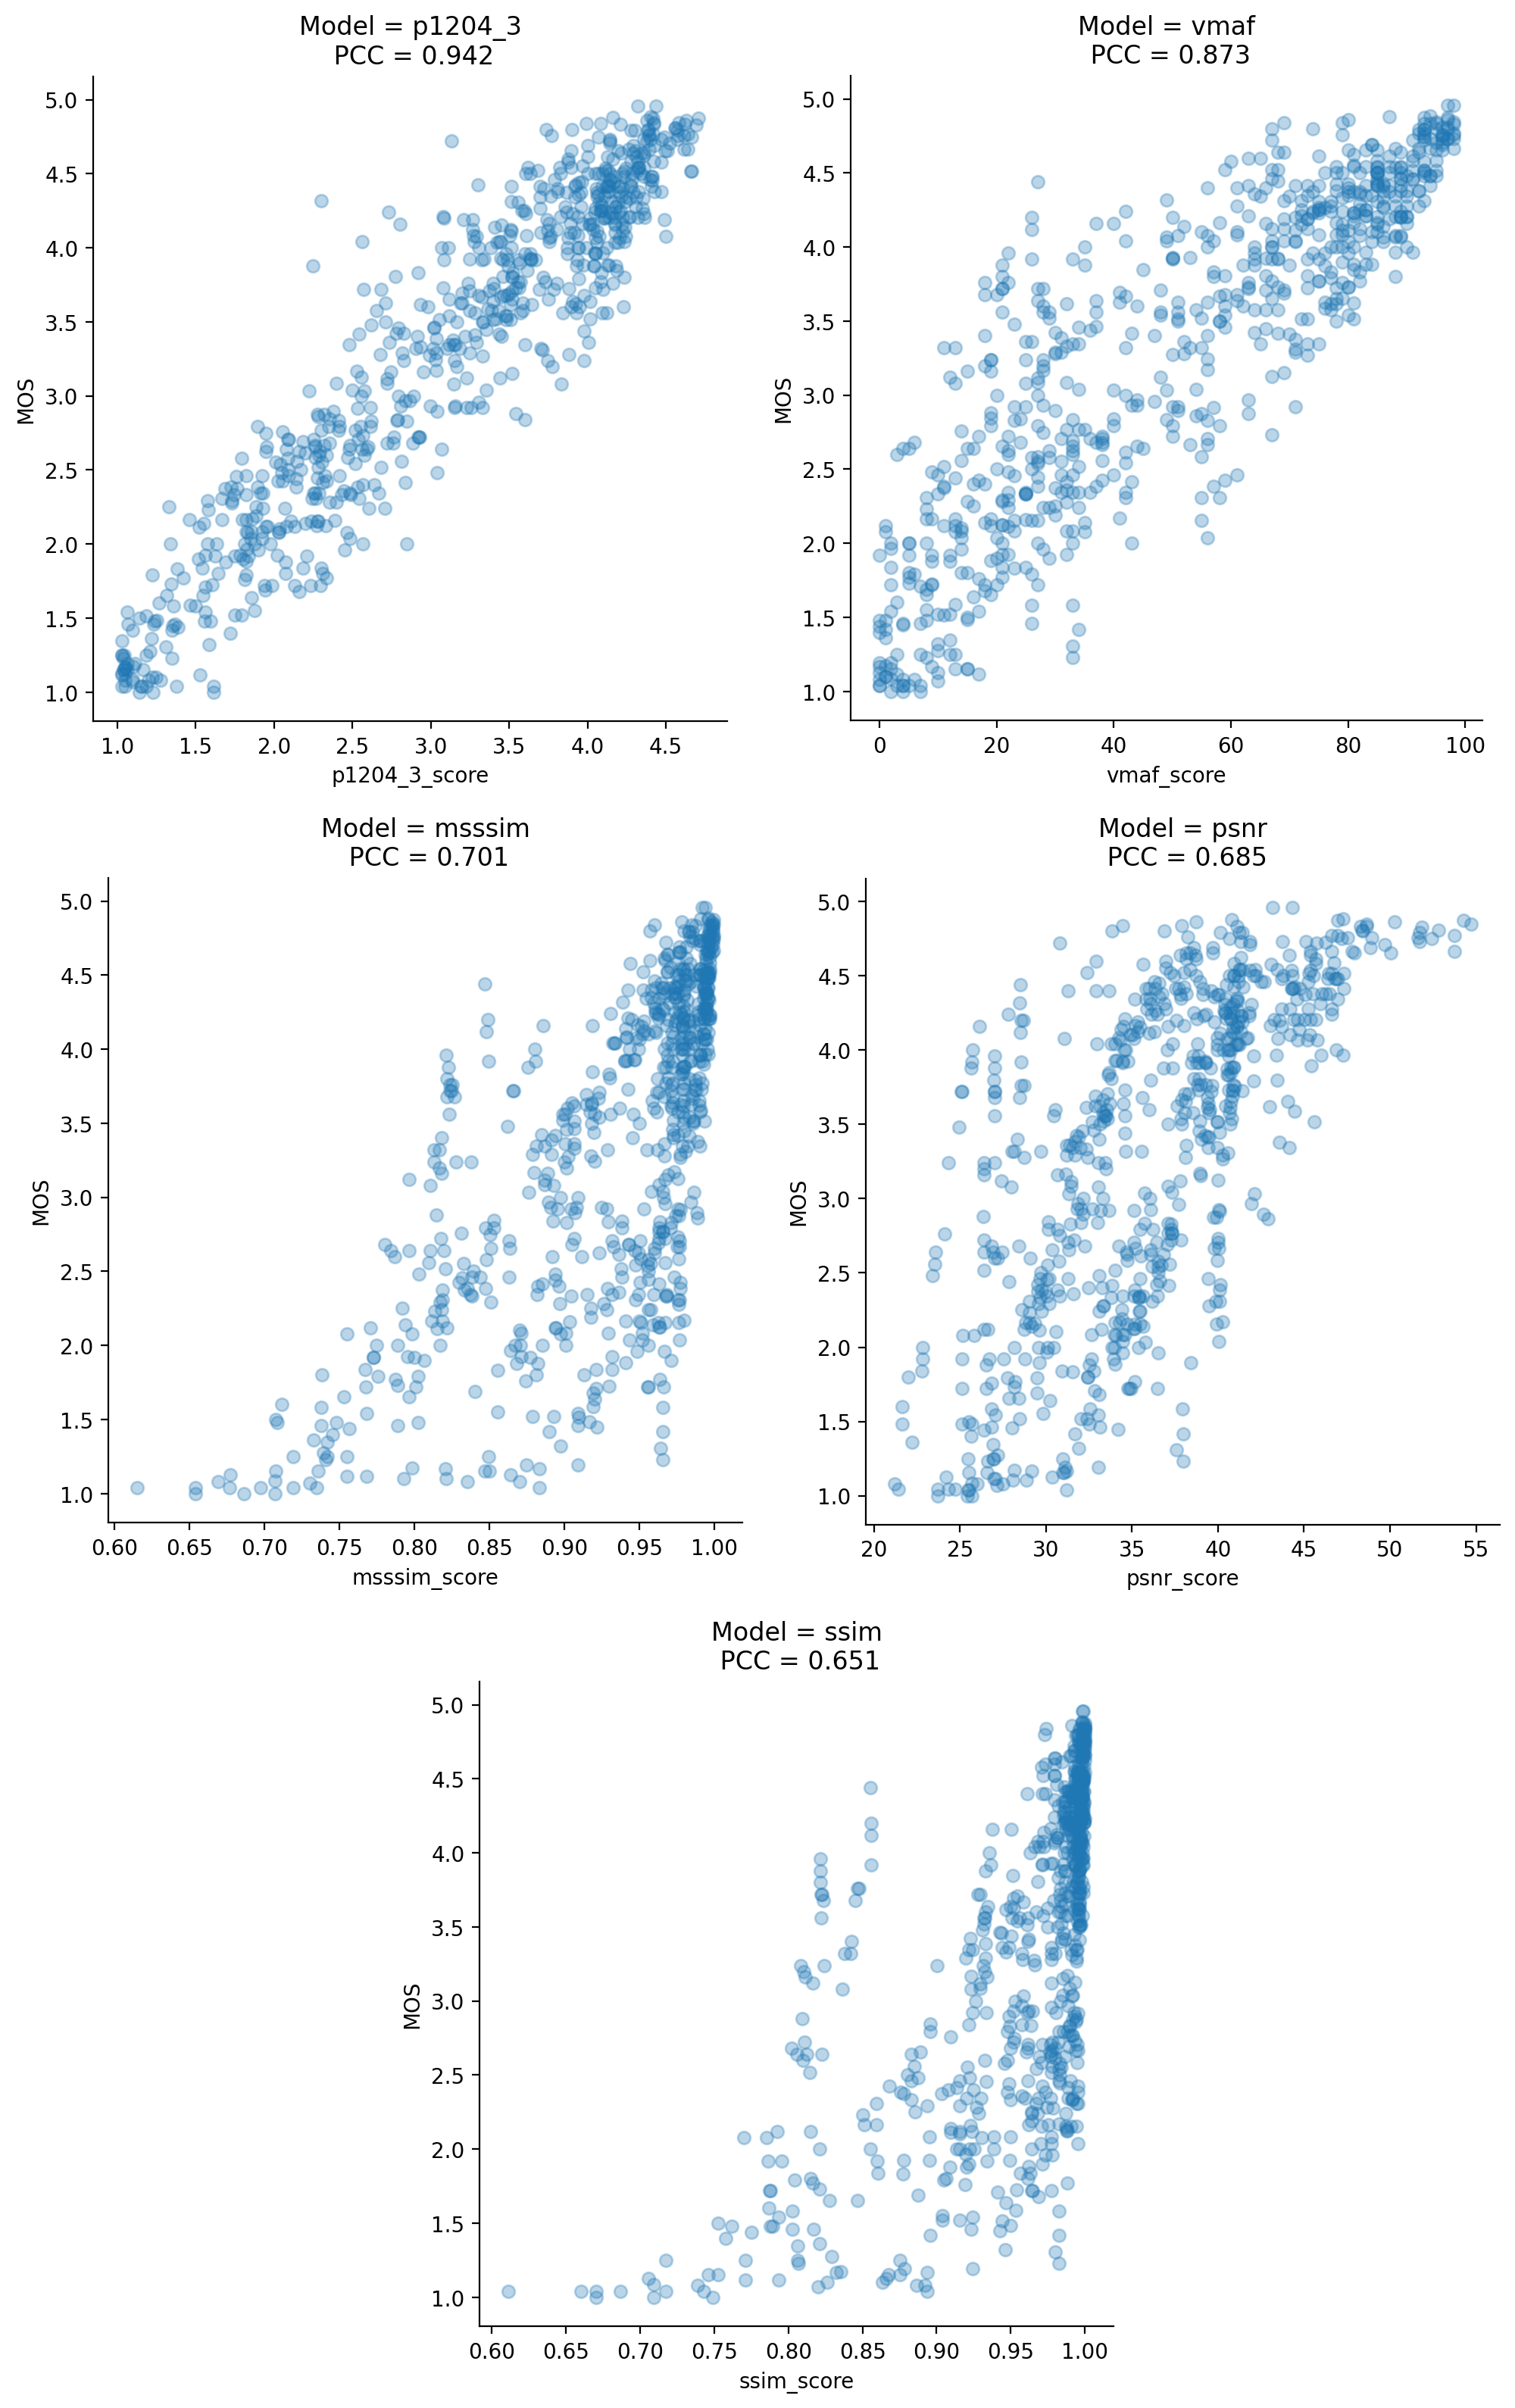
Figure 4. P.1204.3 performance. Click the figure to view it at full resolution.
What makes the P.1204.3 results so impressive is that they are bitstream-based, where the other metrics are full reference. This should make P.1204.3 faster to apply and allows its use anywhere within the delivery ecosystem.
As with P.1203, as of today, no commercially available tools implement this metric. You can download reference software for ITU-T Rec. P.1204.3 from TU Ilmenau here, which you can freely use for non-commercial research purposes.
Summary
ITU-T has recently published video quality models in the context of HTTP Adaptive Streaming, namely ITU-T Rec. P.1203, which integrates video quality and audio quality scores into a score for an (up to) 5-minute video session, including initial loading and stalling effects, and ITU-T Rec. P.1204, which is a set of high-performance models for UHD/4K 60 fps sequences coded with H.264/HEVC or VP9.
TU Ilmenau and partners have developed several tools in the context of the standardized models, which are ready to use and freely available for research purposes. There is:
- A reference implementation of the ITU-T Rec. P.1203 model
- A reference implementation of the ITU-T Rec. P.1204.3 bitstream model
- A bitstream parser for H.264, H.265 and VP9
All of these tools are available from the overview website, including additional links to databases and software.


