 Streaming Learning Center Where Streaming Professionals Learn to Excel

Related Articles


Choosing the wrong per-title encoding service can boost streaming costs by up to 64% and storage costs by 76%. It can also reduce the average video quality delivered to your viewers by up to 9.28 VMAF points. These reports identify the OPEX and quality leaders and save months of testing.
Contents
Overview:
Per-Title encoding is the most efficient and effective technology for delivering streaming video and it’s now offered by most cloud encoding services and cloud platforms. However, the quality, feature set, useability, and cost of each service vary significantly, and testing and ascertaining these details is expensive and time-consuming. Choosing and using the wrong cloud platform can cost you significantly in OPEX and viewer quality of experience.
These two reports compare the H.264 and HEVC per-title output of five cloud platforms and detail comparative costs, output quality, and encoding feature set to enable report buyers to select the service that delivers the best blend of quality and affordability.
Who these reports are for:
These reports are for companies who are seeking to choose a cloud-based per-title encoding provider, or companies who are currently using per-title encoding services from one of the services and want to better understand its comparative performance.
Why buy these reports:
Several reasons:
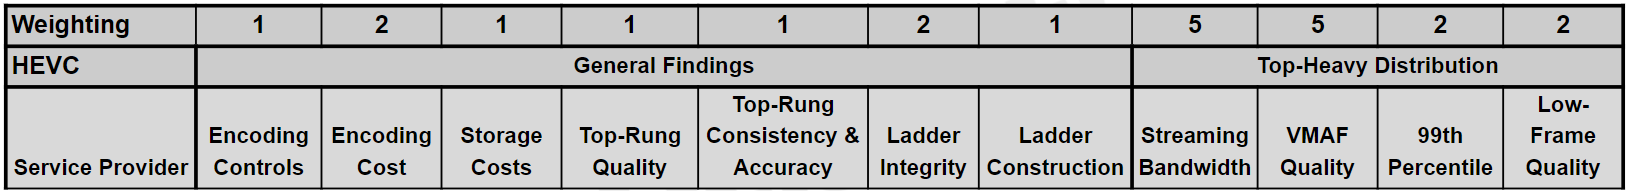
- Comprehensive analysis of the services. These reports take a holistic view of per-title encoding and grade the services on a broad spectrum of features and performance indicia (see Table 2), including three measures of encoding quality, comparative costs for encoding, storage, and streaming, and encoding features. This allows report buyers to fully understand how the services compare.
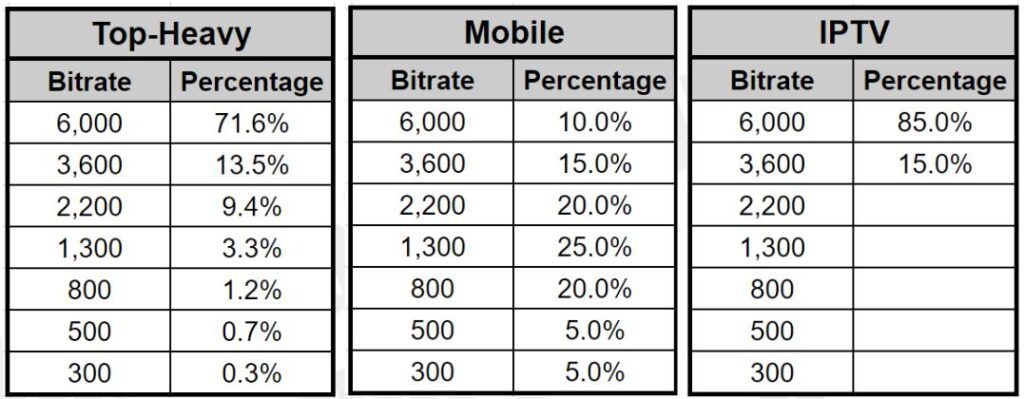
- Hard data to assist decision-making. These reports provide hard cost and quality numbers for three different distribution scenarios (see Table 4) that allow report buyers to understand how each service performs for each pattern. This is critical because services that perform well in one scenario, like IPTV, may not perform equally well when streaming to mobile viewers. This segmentation allows report buyers to understand how each service will perform in the distribution pattern that most closely matches their own.
- Incorporates all factors that impact QoE. This report incorporates overall VMAF, 99th Percentile VMAF scores, and low-frame VMAF scores (see Figure 1), which all impact QoE. It also considers encoding ladder integrity, which can also impact QoE. Report buyers get a complete picture of the QoE delivered by each service, not just the top line metric score.
- Thorough vetting of per-title-related features. Services are rated on the encoding feature set, which impacts usability and performance. If you’ve only worked with a single cloud vendor, you probably don’t know what features other services offer and why they may be important. Report buyers will understand the full spectrum of encoding features and can choose the best service for their needs.
Cloud services included:
This report compares services provided by five cloud platforms; AWS Elemental MediaConvert, Bitmovin, Brightcove/Zencoder, Microsoft Azure Media Services, and Tencent Media Processing.
Results included:
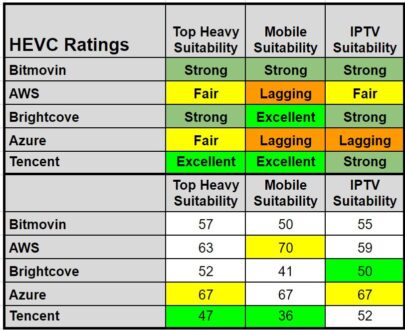
The reports rate each service on a scale from Excellent to Red Flag using three distribution patterns. Table 1 shows the HEVC overall ratings.
To compute the scores, we ranked each service from excellent (1 point) to red flag (five points) on the 11 criteria shown in Table 2, with the weightings for each factor in the Weighting row. So, streaming bandwidth and VMAF quality were rated 5x, encoding cost, ladder integrity, 99th percentile, low-frame quality 2x, and the other criteria 1x. General findings applied to all three distribution patterns, while the last four were unique for each distribution pattern.
Each report contains three tables ranking each service for each distribution pattern, showing the rankings for each criterion and computing the numerical score shown at the bottom of Table 1. This allows report buyers to very specifically identify the strengths and weaknesses of the respective services.
Testing methodology:
To produce the report, we processed 23 test files in four genres, entertainment, sports, animation, and office, through each system. In addition to the more detailed results discussed next, these raw results are presented in rate-distortion curves within the reports.
To produce comparative cost and quality results, we simulated streaming delivery using three distribution patterns, top-heavy (concentrated in the top few rungs), mobile (middle rung concentration), and IPTV (top two rungs only) to allow report buyers to compare the service using the distribution pattern that most closely matches their own (Table 3). This is critical because services that perform well in one pattern may perform poorly in another.
The H.264 report produced and compared H.264/high profile 8-bit output. The HEVC report produced and compared HEVC/8-bit SDR output.
Reported OPEX details:
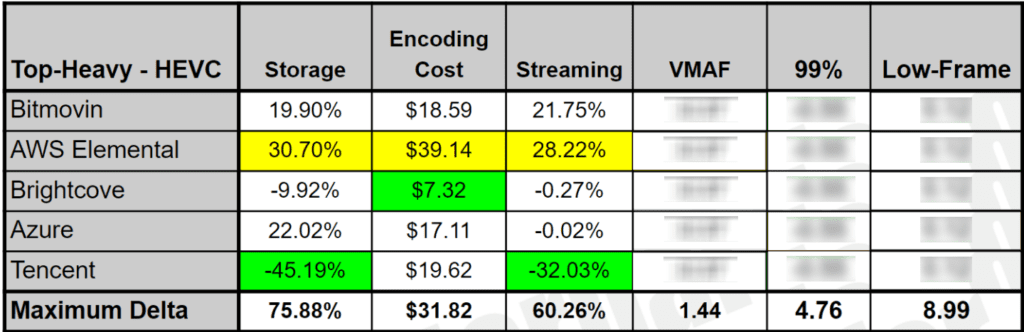
- Encoding cost for 23 test files (varied from $7.32 – $39.14 for HEVC/$3.09 to $9.05 for HEVC).
- Storage cost (varied by 75.88% for HEVC and 54.83% for H.264).
- Bandwidth cost for each distribution pattern (varied by up to 64.31% for HEVC and 28.32% for H.264).
Reported output quality (for each distribution pattern):
- Overall VMAF (varied by up to 8.92 for HEVC/9.28 for H.264).
- 99th percentile, or the VMAF value over which 99% of all frames (a measure of quality variability) (varied by up to 8.68 for HEVC/9.91 for H.264).
- Low-frame VMAF – the lowest quality frame from each file, a predictor of transient quality (varied by up to 9.94 for HEVC/8.68 for H.264).
Why three quality measures?
We track three quality measures because all affect viewer QoE. All three are shown in the Results Plot in Figure 1. This graph compares two files to the same source, charting the VMAF score for each individual frame over the duration of the video file and is produced by the Moscow State University Video Quality Measurement Tool. We computed overall VMAF scores using the harmonic mean method. These scores were relatively close in this comparison.
However, you see that the encoder represented by the red plot shows many more low-quality regions than the encoder represented in the green plot. These often represent noticeable regions of reduced quality which reduce the 99th percentile score and can impact QoE.
The encoder represented by the red plot also shows several very transient severe quality drops. The lowest of these is the low-frame score. Sometimes these drops represent a noticeable loss of quality, sometimes not. Either way, tracking overall VMAF, 99th percentile, and low-frame VMAF provides a complete picture of overall quality, quality variability within the file, and the potential for transient quality problems, all of which impact QoE.
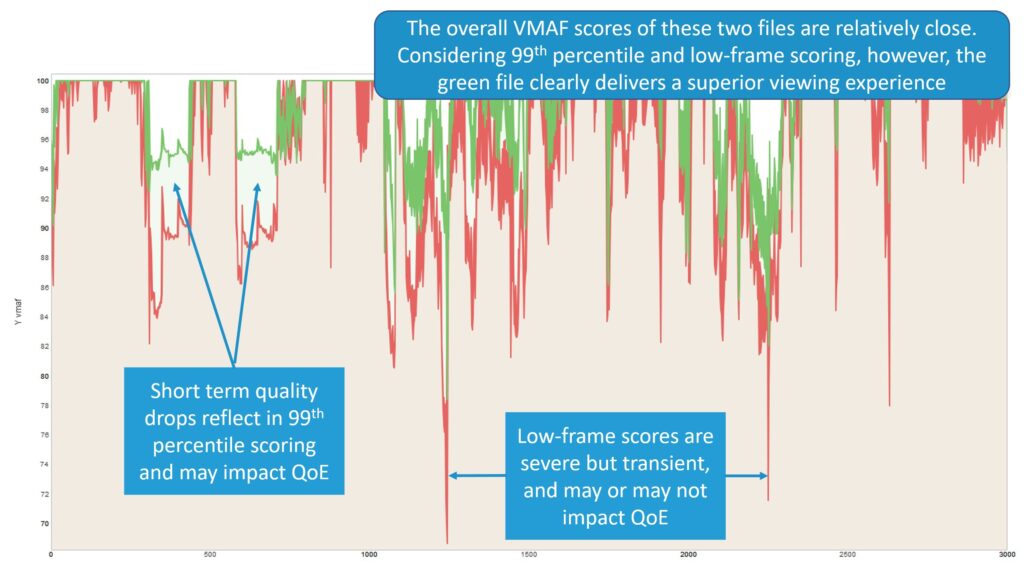
Figure 2 shows an example of where low-frame scores represent visual differences that viewers might notice. Both reports provide many similar comparisons to demonstrate and verify the impact of the VMAF scoring reported.

Why VMAF?
VMAF has been shown (see Figure 1 in the article) to have the closest correlation with subjective scores of all metrics, making it the best predictor of how humans will actually rate the videos. Note that in many cases, we verified VMAF findings by examining the results plots (Figure 1) and comparing actual frame quality (Figure 2), and in other cases verified our findings by checking the PSNR, SSIM, and MS SSIM metrics.
Why aren’t you reporting BD-Rate results?
BD-Rate results are ineffective when different services deliver encoding ladders that start and end at different bitrates. At best, you could compute BD-Rate for the regions where all services overlap, but the results would be incomplete and inaccurate. See also, Why BD-Rate is a Poor Predictor of Real-World Bandwidth Savings
Instead, this report used a weighted average bandwidth and quality computations originally developed for this paper published for V-Nova. These weighted average computations are more accurate and applicable than BD-Rate computations, which are typically based upon four 1080p files that have assumed equal distribution.
Obviously, no producer ships an encoding ladder with four 1080p rungs, and few, if any, ladders have equal consumption of all rungs. The weighted average approach used in these reports uses full encoding ladders and clearly defined distribution patterns to more closely predict the actual economic and qualitative impact of the encoding ladders produced by the services.
What did Tencent do well?
During the testing period, Tencent debuted a new per-title encoding technique that very efficiently identifies an encoding ladder very close to the ideal ladder as created using a technique adopted from the Netflix Convex Hull method (see Figure 4). In addition, Tencent proved to be the most efficient encoder in the static trials we conducted as part of the study.
To explain, in addition to the per-title tests, we encoded four test files to the same exact encoding ladder with both HEVC and H.264 and measured overall VMAF, 99th percentile, and low-frame VMAF. Figure 3 shows the overall VMAF results for H.264. To be totally clear, with all other results in the report, the services created a unique per-title encoding ladder for each file. For these static tests, we encoded the same four files to the same exact ladder, in rungs, resolution, and bitrate, for all the services.
We did this to assess the pure encoding efficiency of each service, outside of its per-title encoding technologies. The report contains rate-distortion curves and BD-Rate stats for these static results for all three quality metrics; you can see in the rate-distortion curve in Figure 3 that Tencent has a significant advantage when producing H.264, followed by Bitmovin, Brightcove, and Azure, with AWS Elemental well behind.
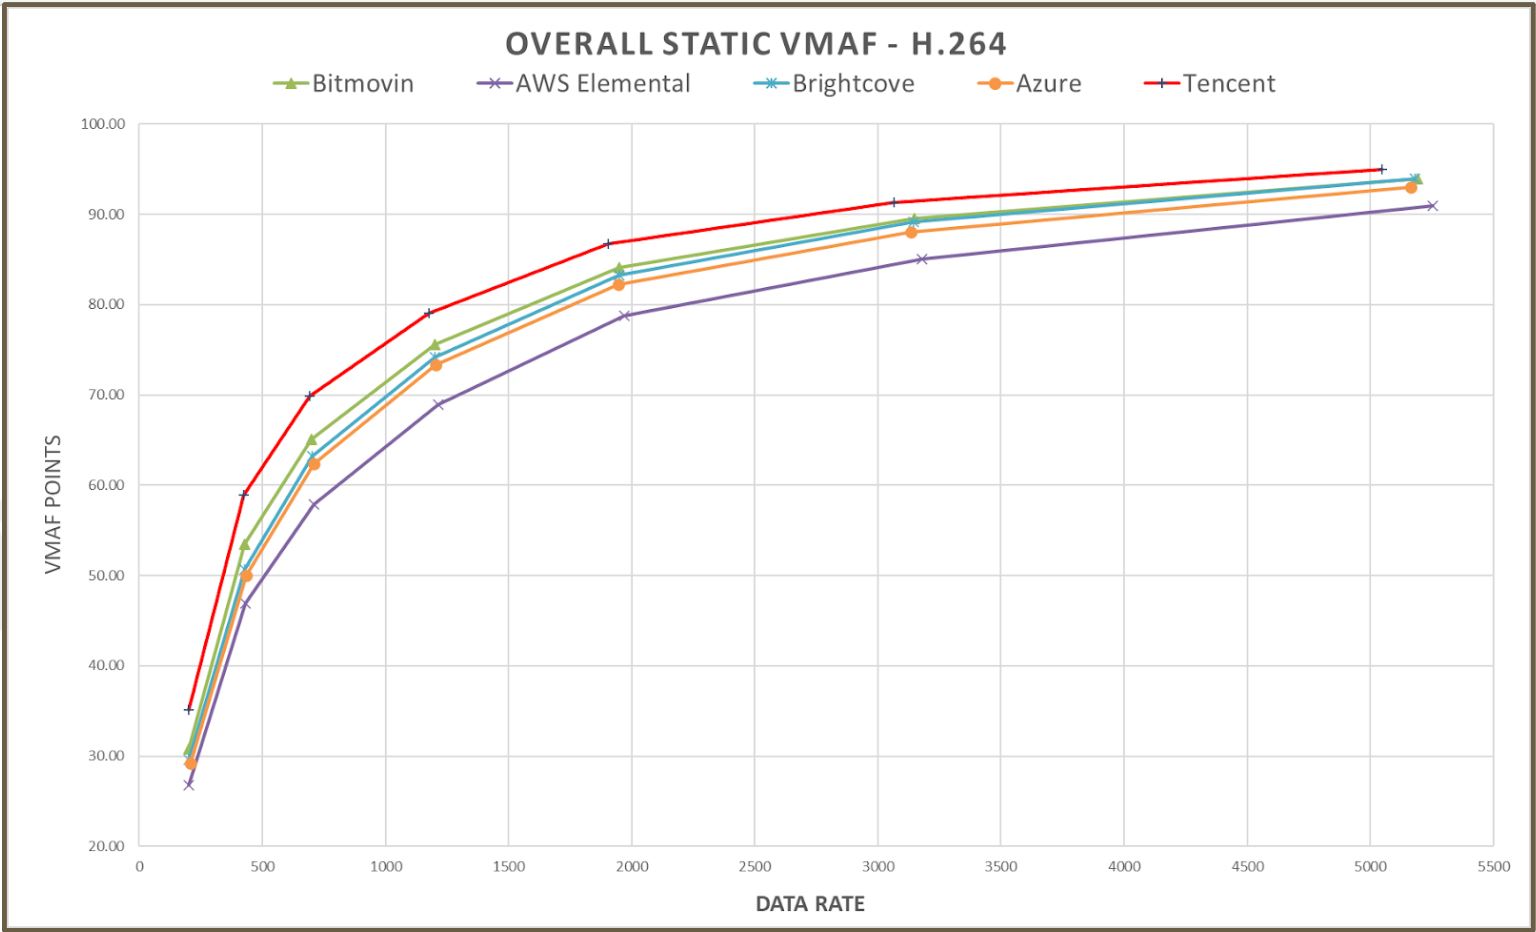
Interestingly, if you look through 2020 and 2021 reports from Moscow State University, which report static results like Figure 3, you’ll find that its VMAF results are similar to ours for the three services included in their reports, Tencent, AWS, and Brightcove/Zencoder. Though MSU doesn’t measure quality variability or low-frame in the 2021 report, or per-title performance, they do include many other metrics besides VMAF which tend to confirm the findings in Figure 3 for the included services.
Returning to the narrative, Tencent’s ladder very closely matched the convex hull, and its encoding efficiency, at least as it relates to overall VMAF, was the highest in both studies. For this reason, it’s no surprise that Tencent performed well in both studies.
What About Brightcove and Bitmovin?
These mature services produced very efficient encoding ladders and demonstrated very competent encoding capabilities, though behind Tencent. Both provided excellent encoding controls; for example, Brightcove and Bitmovin were the only two services that enable users to assign different H.264 profiles to different rungs. They also allow users to choose the quality level for their encoding ladders to customize quality and bandwidth costs. They are both very strong choices for all distribution patterns.
What were the major concerns with AWS and Azure?
Both Azure and AWS are highly polished and competent services with many satisfied customers. However, based on our test clips and VMAF-based testing methodology, with both H.264 and HEVC, other services delivered higher quality video at lower encoding and bandwidth costs, along with more flexible encoding features.
In terms of quality, our static H.264 tests placed Azure and AWS placed fourth and fifth in our five-service comparison, and third-party results tend to confirm the findings as they relate to AWS. Azure was not included in the MSU trials or any others that we found. Note that Azure performed much better in HEVC static tests for overall quality, but otherwise, the ordering was the same.
Overly conservative ladders
Our results indicate that both services lost quality due to overly conservative encoding ladders. For each video file, we formulated the ideal ladder using an adaptation of the Netflix Convex Hull method and then compared all ladders to this ideal. Figure 4 shows the comparison. You see Bitmovin and Tencent very close to the convex hull, with AWS and Azure the most conservative on the far right.
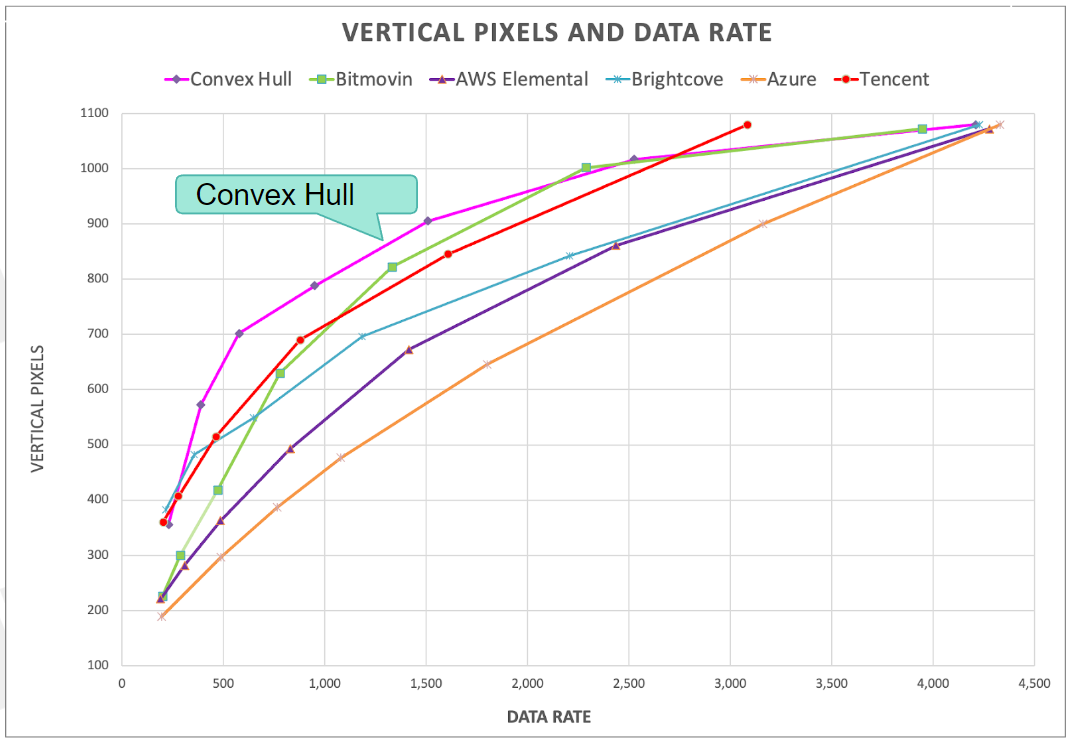
All ladders peaked at 1080p; no surprise there for 1080p content. So, the impact of the conservative approach was more relevant to the mobile distribution pattern where middle and lower rungs were heavily delivered.
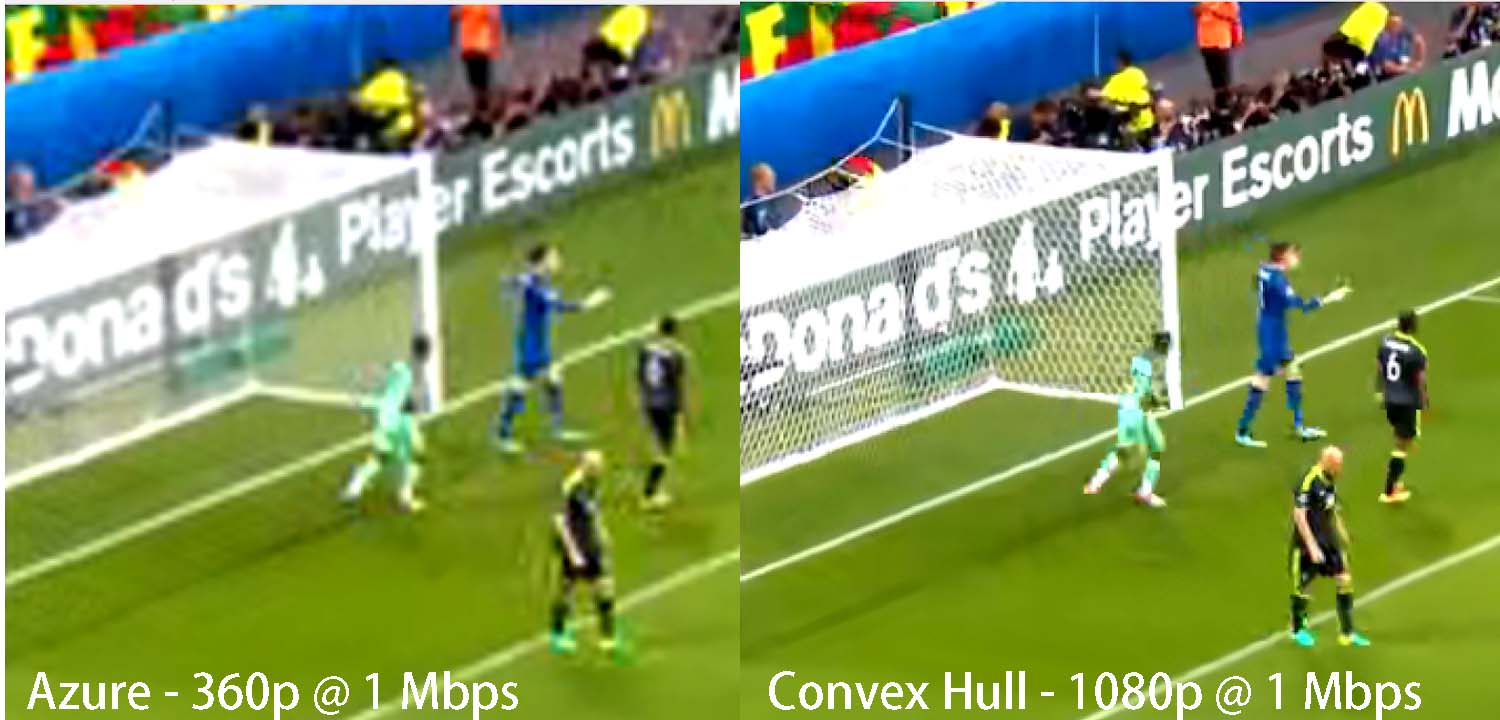
You see this in Figure 5. At 1 Mbps for this soccer clip, the convex hull analysis yielded an optimal resolution of 1080p. In contrast, Azure encoded this rung at 360p. To be fair, VMAF seems to favor higher-resolution videos over lower-resolution videos, but most viewers would probably agree that the convex hull delivers every bit of the 19 additional VMAF points computed (77 to 58).
AWS and Azure OPEX premium
Table 4 shows that AWS is the most expensive service for HEVC when considering encoding cost, storage, and bandwidth cost. As with our quality findings, other reports confirm at least the pricing element. Specifically, in this 2021 report, we noted that AWS charged over 2X more for HEVC encoding than any other service, though H264 encoding costs were very reasonable. The H.264 and HEVC reports also show that, on average, AWS produced either the first or second highest top rung bitrate, so you can see why bandwidth and storage costs are also comparatively high.
In our discussions with Microsoft, we learned that the Azure ladder deliberately prioritizes the upper end of the ladder, and “spread the layers/bitrates more uniformly in the high bitrate area.” This had the obvious effect of increasing overall storage costs for both codecs. Note that Azure was the cheapest service for encoding H.264 and was the second least expensive for HEVC.
Feature deficits
Finally, AWS and Azure lacked critical encoding-related features provided by other services. For example, they were the only two services that didn’t let you choose a quality level for encoding ladders. So, if you wanted to drop the quality level to save bandwidth costs, or to deliver UGC videos as opposed to premium content, you can’t.
Though Azure offers three quality levels (speed, quality, balanced) these don’t correspond with bitrates. In contrast, you can set CRF levels with Bitmovin and Brightcove enables a quality switch, both of which allow you to accurately control the bitrate and quality level. Other usability issues are included in the reports.
Caveats
There are several caveats relating to these findings. These include:
VMAF – if you don’t feel that VMAF accurately predicts subjective findings, then you should ignore this post and both reports. Though we attempt to visually verify many key report details, and use other metrics in the analysis, if you think VMAF is inaccurate, you won’t find the reports useful.
Lack of subjective metrics – subjective metrics are clearly the gold standard, but they come with several limitations. First, gathering them is expensive and time-consuming; when you consider that we produced all files in this report at least two and often three times, this makes subjective ratings even more cumbersome. Second, most subjective ratings require video files that are 20 seconds in duration or shorter. We don’t feel that you can accurately gauge VBR performance on files of this duration. Again, however, if you feel subjective comparisons are the only effective metric, you won’t find these results useful.
Test file selection – The 23 test files used for these reports included movies and movie-like content, music videos and other entertainment, sports, animations, and office content. Though selected to represent a broad selection of genres, testing results will vary by the test files used. Readers should use these reports as a guide and to help focus their own testing but should perform their own testing and analysis using their own test files before choosing a service.
Have the services seen these findings?
We provided both reports to all services prior to publication. We didn’t share (or offer to share) spreadsheets or encoded files; we were seeking verification of pricing and encoding features and hoping to identify any obvious errors or omissions in the report.
Brightcove, Bitmovin, Tencent, and Microsoft all provided substantive input, which led to scoring and reporting changes, particularly respecting Microsoft’s comments as detailed in both reports. AWS responded to one inquiry identifying an issue that turned out to be our error but did not comment on the reports.
What are your qualifications for producing this report?
Jan Ozer has reported on and compared per-title encoding systems since they became available in early 2016. Here’s a sampling of articles and presentations. Note that the methodology used in these reports originated with the 2019 Streaming Media East presentation, and was formalized for this Bitmovin white paper.
Articles and white papers
Buyers’ Guide: Per-Title Encoding, Streaming Media Magazine, March 24, 2002.
The Past, Present, and Future of Per-Title Encoding, Streaming Media Magazine, June 29, 2021
Choosing the Best Per-Title Encoding Technology, White Paper for Bitmovin, August 2019.
Buyers’ Guide to Per-Title Encoding, Streaming Media Magazine, March 20, 2019
One Title at a Time: Comparing Per-Title Video Encoding Options, Streaming Media Magazine, November 1, 2017.
How Netflix Pioneered Per-Title Video Encoding Optimization, Streaming Media Magazine, January 2016.
Presentations
How to Compare Cloud-Based Per-Title Encoding Capabilities, YouTube, November 28, 2021.
Lesson of the Week: Per-Title Encoding in 6.2 Dimensions, Streaming Learning Center, March 2, 2021.
How Per-Title Encoding Works, Vimeo, May 2019.
A Survey Of Per-Title Encoding Technologies, Streaming Media East, May 2019.
Report table of contents
Table of Contents – HEVC – 159 pages (here)
Table of Contents – H.264 – 142 pages (here)
Other report details
H264:
142 pages
Tables ~ 70
Graphs ~ 63
Figures ~ 23
Frame grabs – 25 (8 comparisons, 3 each, one with 4).
HEVC:
142 pages
Tables ~ 60
Graphs ~ 51
Figures ~ 20
Frame grabs ~ 39 (13 comparisons, 3 each)
Buy reports
There are two versions of each report; one for 1-5 readers, for $995, the other a site license, for $3,500.
You can buy the 1-5 reader version of both reports for $1,490. You can buy the site license for both reports for $5,990.
H.264
1-5 readers ($995) – buy now
Site license ($3,500) – buy now
HEVC
1-5 readers ($995) – buy now
Site license ($3,500) – buy now
Both Reports
1-5 readers ($1,490) – buy now
Site license ($5,990) – buy now


