Streaming Learning Center Where Streaming Professionals Learn to Excel

Related Articles


(Note: This article was amended to show the comparative results at 6 mbps)
Contents
Summary (The MPD)
As more and more producers move their encoding to the cloud, or distributing via OVPs or other service providers, the data rate for the mezzanine files is significant factor for upload time and bandwidth and storage costs. The big question is, how much extra output quality do higher quality formats and higher data rates really deliver. As you’ll learn below, not that much.
Note that I refer only to 1080p Standard Dynamic Range uploads in this article, not 2K or 4K, or HDR. I’m guessing the result will be the same for those formats, but wanted to focus on the most common scenario.
Segment I: My Experience
In my experience working with OTT clients, I’ve seen mezzanine files provided to them from the content owners ranging from about 10 – 30 mbps for H.264, and up to 50 mbps for MPEG-2. I’ve yet to see a file in ProRes or any similar intermediate format that might be used as a mezzanine file for delivery to on-premise encoders or for archiving.
Segment II: Industry Recommendations/Requirements
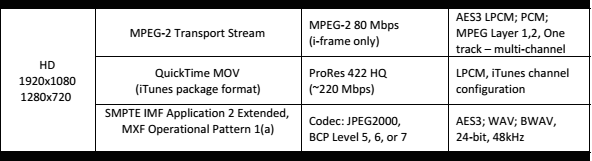
Netflix tops the charts with the recommendations shown below, which are eight 80 Mbps I-frame only MPEG-2, 220 Mbps ProRes 422 HQ, and JPEG2000.

Figure 1. Netflix encoding specifications for HD video.
Beyond Netflix, here are some other recommended data rates for 1080p.
Brightcove – “A talking head can safely go as low as about 6000 kbps, but 8024 kbps should cover most cases.”
YouTube – 12 mbps for 1080p.
Kaltura – 6-8 mbps.
Vimeo – 10 – 20 mbps
Hulu advertisements (couldn’t find content) – 15-30 mbps ()
So, Netflix is clearly on the outer edge here in terms of file format and bandwidth. Does this translate to extra quality after re-encoding for distribution? Let’s see.
Segment III: My Tests – First Round
I’m the objective video quality measurement guy, so I decided to run some tests. Here’s a brief description.
1.Source footage. Was originally shot with Red camera and stored using the RED R3D Raw codec. The footage contained a mix of low and high motion and was used for stress testing for a consulting job.
2. Master test file. Was 96 seconds long, originally output in YUV format (1080p@29.97 fps) from Premiere Pro. This YUV file served as our test master for comparison purposes. This means that I compared all encoded files to this file for the tests described below.
3. Other mezzanine files. To create the other alternatives, I re-input the YUV file into Premiere Pro, and output the file in the following formats and data rates.
a.ProRes 422
b.H.264@100 Mbps
c.H.264@50 Mbps
d.H.264@40 Mbps
e.H.264@30 Mbps
f.H.264@20 Mbps
h.H.264@10 Mbps
4. File encodings. I then encoded all test files, including the YUV master, to 2.5 Mbps at 1080p (29.97) using the Capella Systems Cambria FTC Encoder to stress the H.264 codec. This is a bit lower than the typical data rate used by most OTT producers for challenging footage.
5. PSNR comparisons. I then computed the PSNR value of all encoded files compared to the YUV master with the Moscow University Video Quality Measurement Tool. Table 1 shows these results (click the table to view it at full resolution in a separate window).
Table 1. PSNR values for output from different mezzanine file formats and bitrates at 2.5 Mbps output.
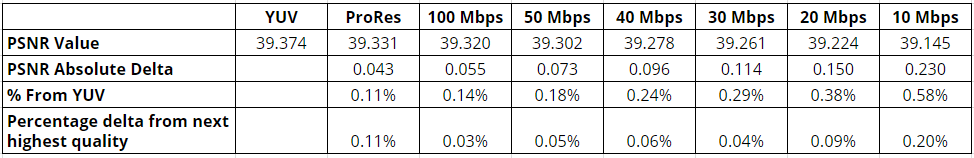
The first line shows the absolute PSNR scores. For reference, this is mid-range quality based upon Netflix’s observations that viewers can’t discern the additional quality provided by ratings above 45 dB, while ratings below 35 dB may exhibit noticeable quality deficits.
Line two shows the absolute difference in PSNR value between the output file from each mezzanine format and the YUV output file. So, where the file generated from the YUV source had a PSNR value of 39.374, the file generated from the 10 Mbps H.264 file had a PSNR value of 39.145, for a total difference of .23 of a decibel. In my experience, it takes a difference of 1-2 dB for even a golden-eyed viewer to notice the difference.
The Delta % from YUV line shows the percentage difference in PSNR value from the YUV generated encoded file, which strays to a value of .58% (less than 1%).
The final line shows the % quality difference between each mezzanine alternative, which shows insignificant differences pretty much all the way through, though the deltas increase at the lower data rates.
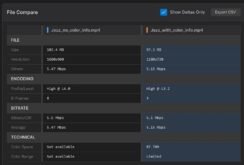
Overall relative parity is nice, but were there any outlier regions in the file? Figure 2, the results visualization screen from the MSU tool, seems to indicate that there weren’t. Here, the red line represents the PSNR value for the file produced from the 10 Mbps mezzanine file, while blue is the output from the YUV file (both compared to the YUV master). The top graph represents the entire file, while the bottom shows the darkened region from the top graph.
Figure 2. PSNR values for 10 mbps mezz (in red) vs. YUV mezz in 1080p file @ 2500.
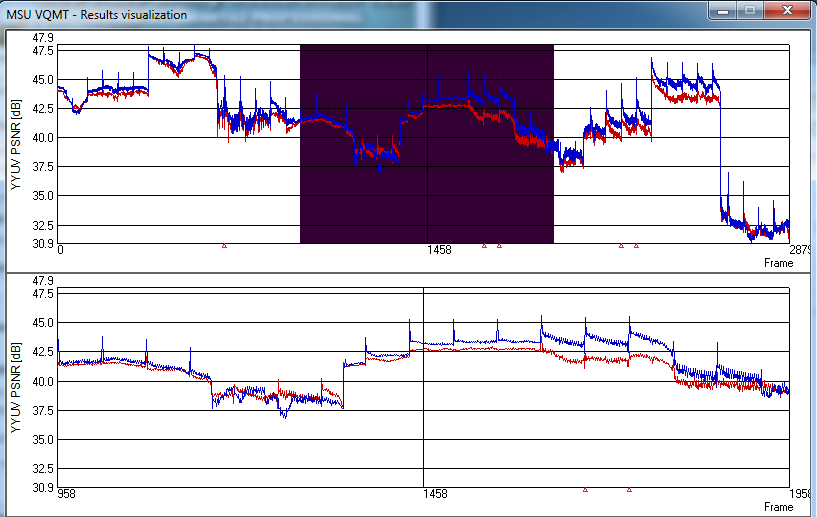
While there were some regions when the difference ranged over a point or two, these tended to be in the sections with higher PSNR values, like the highest region on the upper right. This makes it highly unlikely that any viewer would notice the difference. In challenging regions on the extreme right where the scores are lowest, the scores were very close, which I confirmed by looking at the actual frames in the MSU tool.
6. SSIMplus comparisons. I also measured the SSIMplus scores for all files using the SSIMWave Quality of Experience Monitor (SQM). In addition to SSIMplus having a higher correlation to human subjective scores than PSNR, SQM can also perform device specific ratings, and the ratings correspond with expected subjective results.
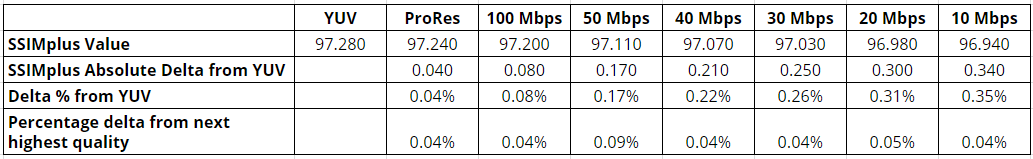
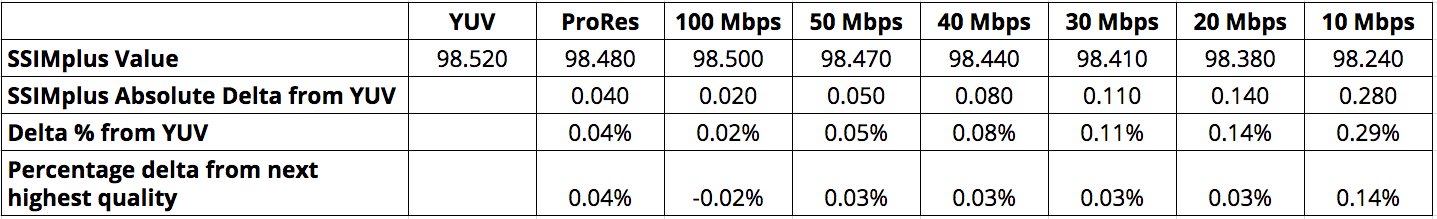
For the ratings shown in Table 2 (click to view in a separate window), I rated the files using a device preset for a 65” 4K TV in what’s called expert mode, which simulates the subjective rating of a golden-eye compression expert standing inches from the screen. SQM rates videos on a scale from 1-100, with scores from 80 -100 predicting an expected rating of excellent from subjective viewers. Output from the different mezzanine files barely moved the needle, with only about a third of a point (.34) differentiating the YUV from 10 Mbps.
Table 2. SSIMplus ratings for output from different mezzanine file formats and bitrates at 2.5 Mbps output.
Segment III: My Tests – Second Round
I added these tests after a comment on LinkedIn questioned whether encoding at 2.5 Mbps was a fair test, given the overall low quality in all files. So, I encoded at 6 Mbps and retested PSNR and SSIMplus. Here’s what I found.
Table 3. PSNR values for output from different mezzanine file formats and bitrates at 2.5 Mbps output.
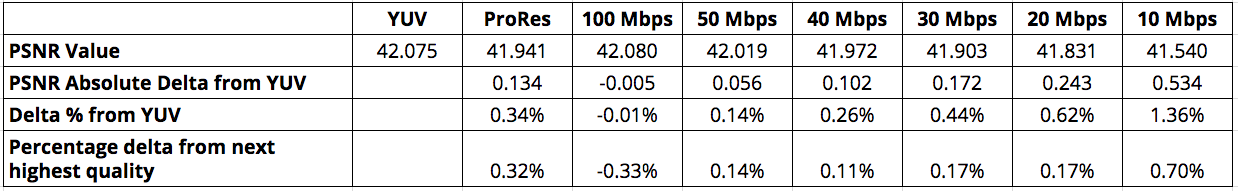
Higher quality file input actually produced a greater change at 6 Mbps than at 2.5 Mpbs, as the LinkedIn comment predicted. That is the absolute difference in PSNR value between the output from a YUV file and a 10 Mbps H.264 file was .534 (over 50% of a decibel) compared to .230 (about 25% of a decibel). Interestingly, the file encoded from the Pro Res source had lower quality than the 100 Mbps H.264 file, a result that SSIMplus duplicated below.
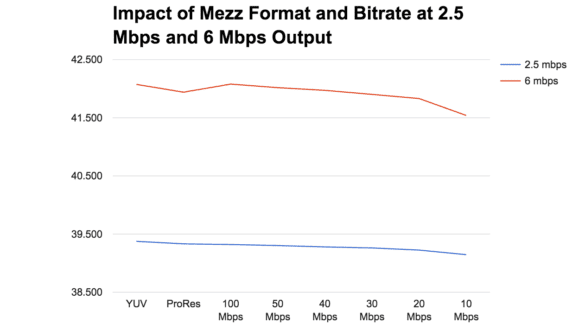
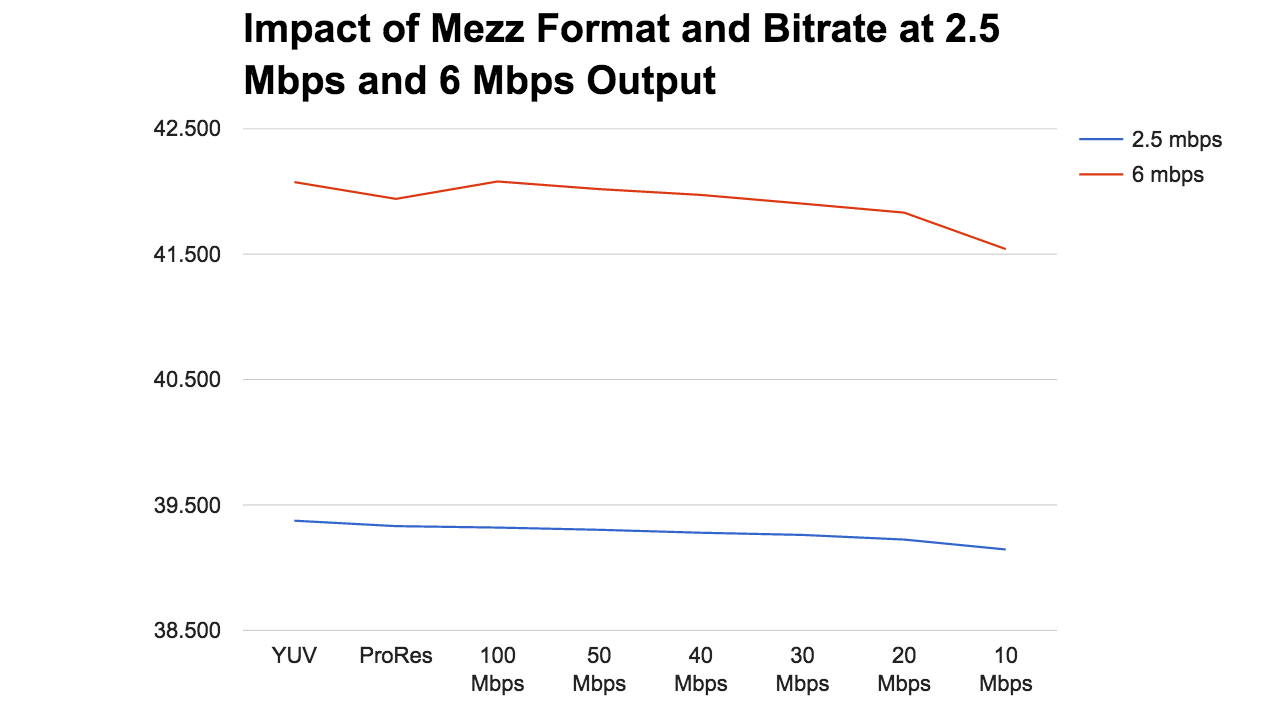
Figure 3 shows the PSNR value of 2.5 and 6 Mbps output from the various mezzanine files. As you can see, the impact is greater for the higher quality file. Still, this falls far short of any difference that even a golden-eyed viewer would notice.
Figure 3. PSNR scores of output from these mezz files at 2.5 and 6 Mbps.
SSIMplus scores also show that higher quality mezz inputs make a greater difference at 6 Mbps than 2.5 Mbps, but that the quality difference is insignificant. No viewer would notice the difference between 98.52 and 98.24 when all scores 80 and above predict an excellent subjective rating. As mentioned above, this test also shows that files encoded from ProRes input had a lower quality than files encoded from 100 Mbps H.264 input.
Table 4. SSIMplus ratings for output from different mezzanine file formats and bitrates at 6 Mbps output.
Here’s the table at 2.5 Mbps output.
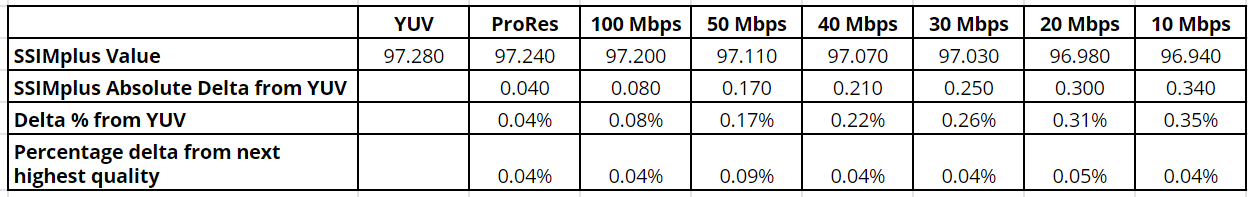
Table 5. SSIMplus ratings for output from different mezzanine file formats and bitrates at 2.5 Mbps output.
Here’s the chart that brings them both together.
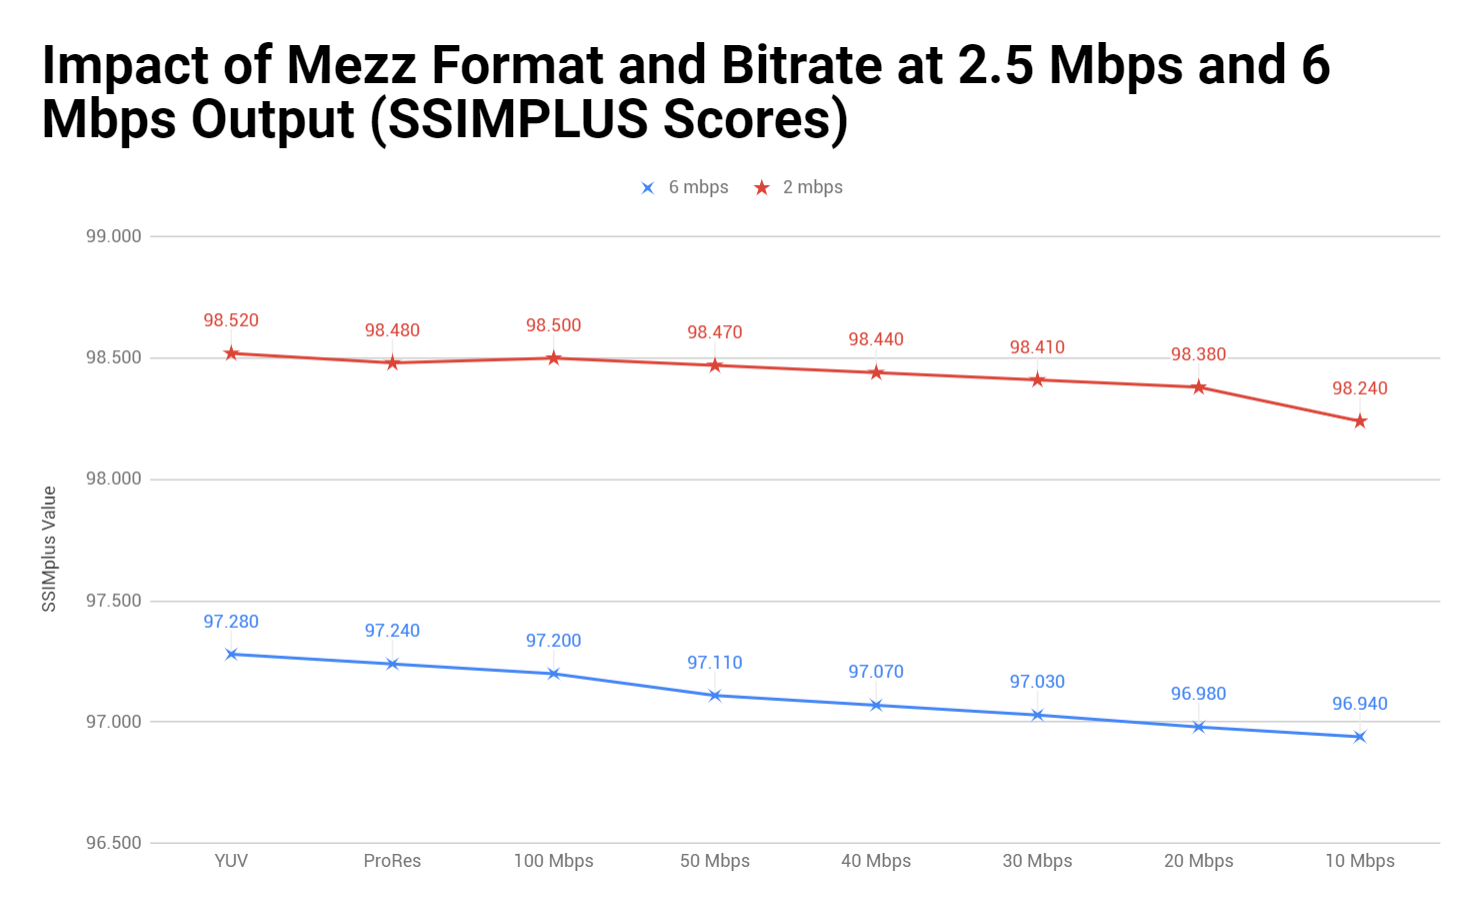
Figure 4. PSNR scores of output from these mezz files at 2.5 and 6 Mbps.
Segment IV: Conclusion
Note that the commenter at LinkedIn mentioned that higher quality formats deliver significantly higher quality when the video is pre-processed before encoding, but didn’t submit any test results to verify this. If you are preprocessing your video before encoding, you should run your own tests to determine if higher quality formats/data rates pay more dividends than shown here.
Otherwise, while higher quality formats and data rates deliver higher quality output, the difference is almost certainly less than you think. If you’re currently delivering (or accepting) mezzanine files in MP4 format at 10-30 Mbps, and not preprocessing, you’ll gain very little additional quality by upping the data rate or moving to a higher quality format.
You’re better off focusing your efforts on other ways to improve quality, and here I can help. To learn more about how to use and interpret video quality metrics like those described above, check out my new book entitled Encoding by the Numbers, Eliminate the Guesswork from Your Streaming Video, which does just that. The book is available in both PDF format ($39.99) and in full color paperback ($49.99).
Buy the book on Amazon ($49.95).