NETINT Quadra vs. NVIDIA T4 – Benchmarking Hardware Encoding Performance
FIGURE 6. QUALITY COMPARISONS, NETINT QUADRA ON THE LEFT, T4 ON THE RIGHT.

NETINT Quadra vs. NVIDIA T4 – Benchmarking Hardware Encoding Performance

This article is the second in a series about benchmarking hardware encoding performance. In the first article, available here, I delineated a procedure for testing hardware encoders. Specifically, I recommended this three-step procedure:

  1. Identify the most critical quality and throughput-related options for the encoder.
  2. Test across a range of configurations from high quality/low throughput to low quality/high throughput to identify the operating point that delivers the optimum blend of quality and throughput for your application.
  3. Compute quality, cost per stream, and watts per stream at the operating point to compare against other technologies.

After laying out this procedure, I applied it to the NETINT Quadra Video Processing Unit (VPU) to find the optimum operating point and the associated quality, cost per stream, and watts per stream. In this article, we perform the same analysis on the NVIDIA T4 GPU-based encoder.

About The NVIDIA T4

The NVIDIA T4 is powered by NVIDIA Turing Tensor Cores and draws 70 watts in operation. Pricing varies by the reseller, with $2,299 around the median price, which puts it slightly higher than the $1,500 quoted for the NETINT Quadra T1  VPU in the previous article.

In creating the command line for the NVIDIA encodes, I checked multiple NVIDIA documents, including a document entitled Video Benchmark Assumptions, this blog post entitled Turing H.264 Video Encoding Speed and Quality, and a document entitled Using FFmpeg with NVIDIA GPU Hardware acceleration that requires a login. I readily admit that I am not an expert on NVIDIA encoding, but the point of this exercise is not absolute quality as much as the range of quality and throughput that all hardware enables. You should check these documents yourself and create your own version of the optimized command string.

While there are many configuration options that impact quality and throughput, we focused our attention on two, lookahead and presets. As discussed in the previous article, the lookahead buffer allows the encoder to look at frames ahead of the frame being encoded, so it knows what is coming and can make more intelligent decisions. This improves encoding quality, particularly at and around scene changes, and it can improve bitrate efficiency. But lookahead adds latency equal to the lookahead duration, and it can decrease throughput.

Note that while the NVIDIA documentation recommends a lookahead buffer of twenty frames, I use 15 in my tests because, at 20, the hardware decoder kept crashing. I tested a 20-frame lookahead using software decoding, and the quality differential between 15 and 20 was inconsequential, so this shouldn’t impact the comparative results.

I also tested using various NVIDIA presets, which like all encoding presets, trade off quality vs. throughput. To measure quality, I computed the VMAF harmonic mean and low-frame scores, the latter a measure of transient quality. For throughput, I tested the number of simultaneous 1080p30 files the hardware could process at 30 fps. I divided the stream count into price and watts/hour to determine cost/stream and watts/stream.

As you can see in Table 1, I tested with a lookahead value of 15 for selected presets 1-9, and then with a 0 lookahead for preset 9. Line two shows the closest x264 equivalent score for perspective.

In terms of operating point for comparing to  Quadra, I choose the lookahead 15/preset 4 configuration, which yielded twice the throughput of preset 2 with only a minor reduction in VMAF Harmonic mean. We will consider low-frame scores in the final comparisons.

In general, the presets worked as they should, with higher quality and lower throughput at the left end, and the reverse at the right end, though LA15/P4 performance was an anomaly since it produced lower quality and higher throughput than LA15/P6. In addition, dropping the lookahead buffer did not produce the performance increase that we saw with Quadra, though it also did not produce a significant quality decrease.

 NETINT Quadra vs. NVIDIA T4 – Benchmarking Hardware Encoding Performance
TABLE 1. H.264 OPTIONS AND RESULTS.

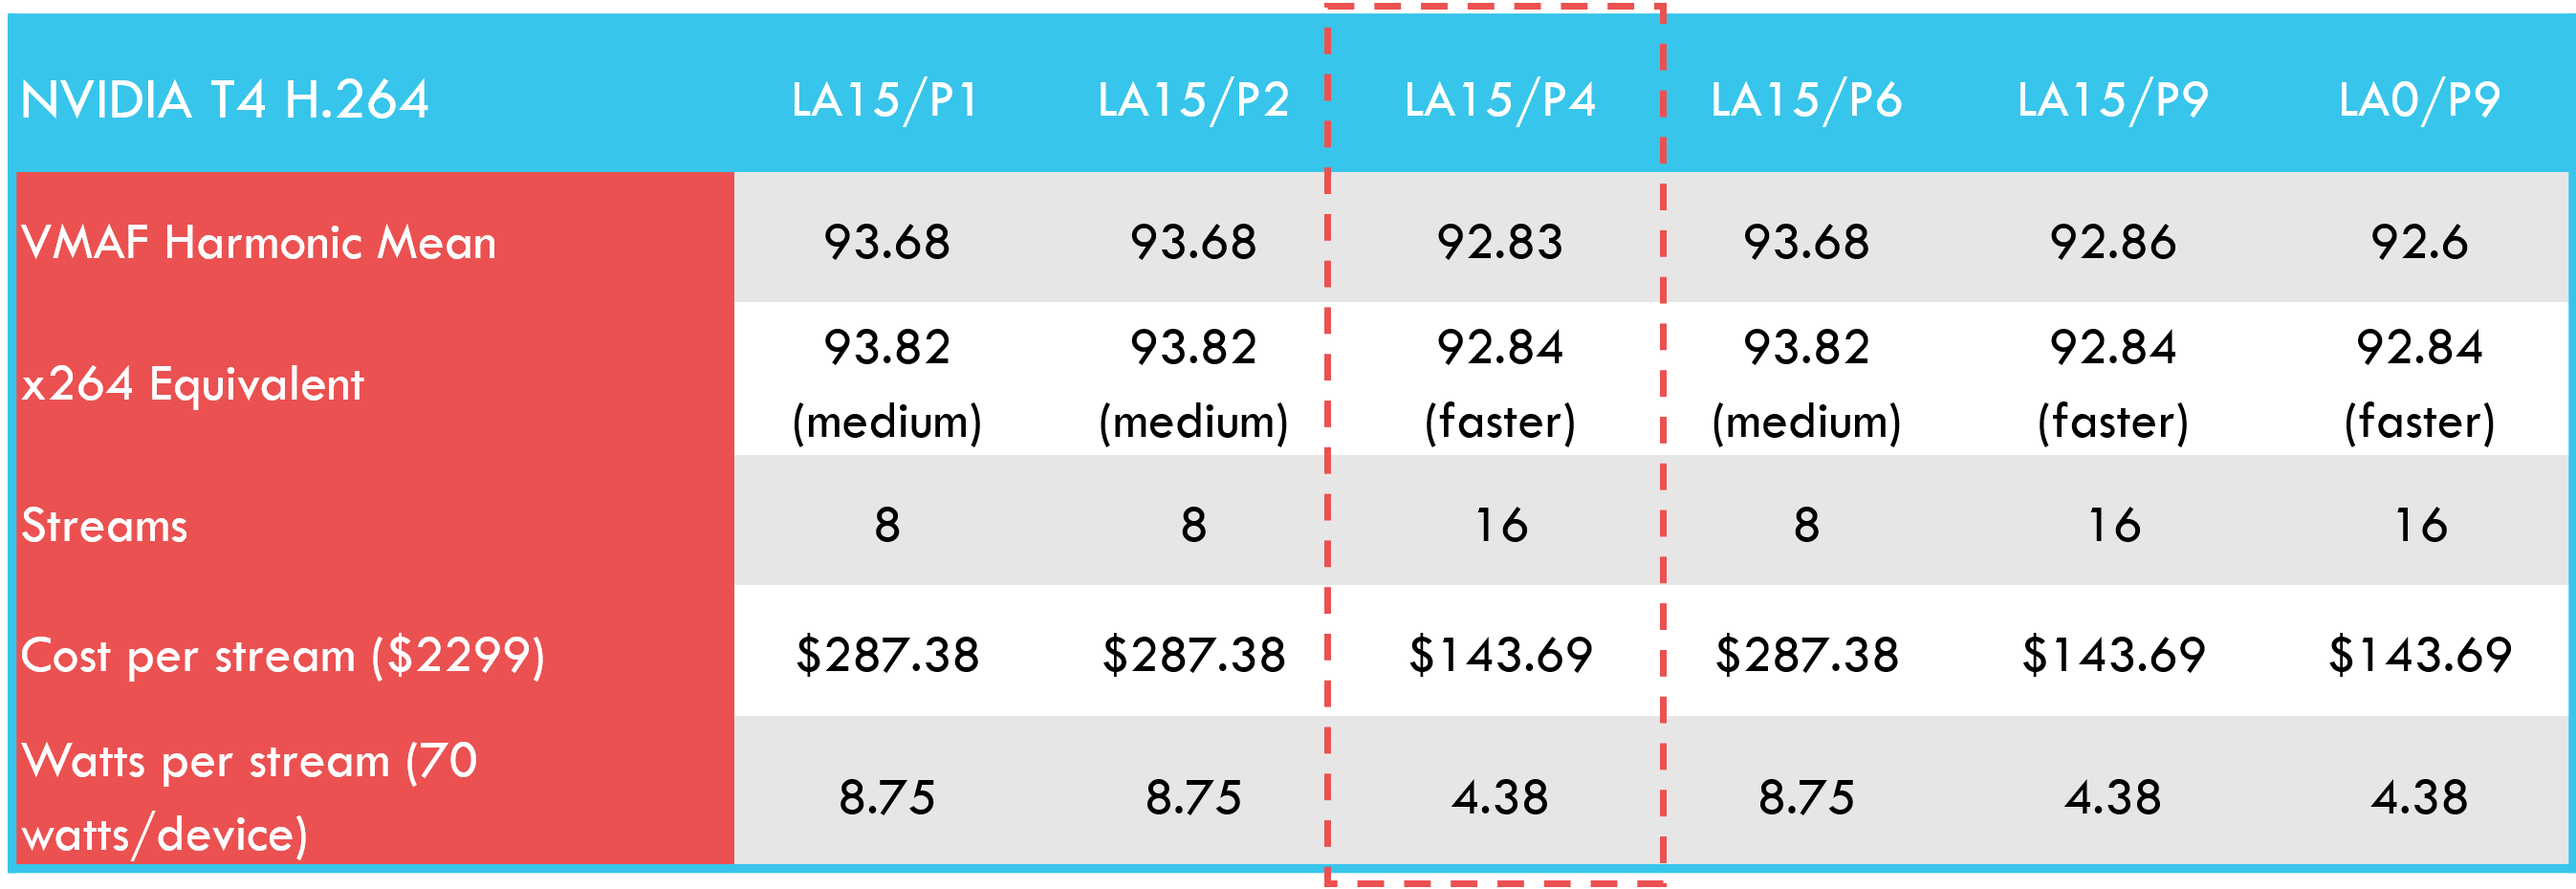
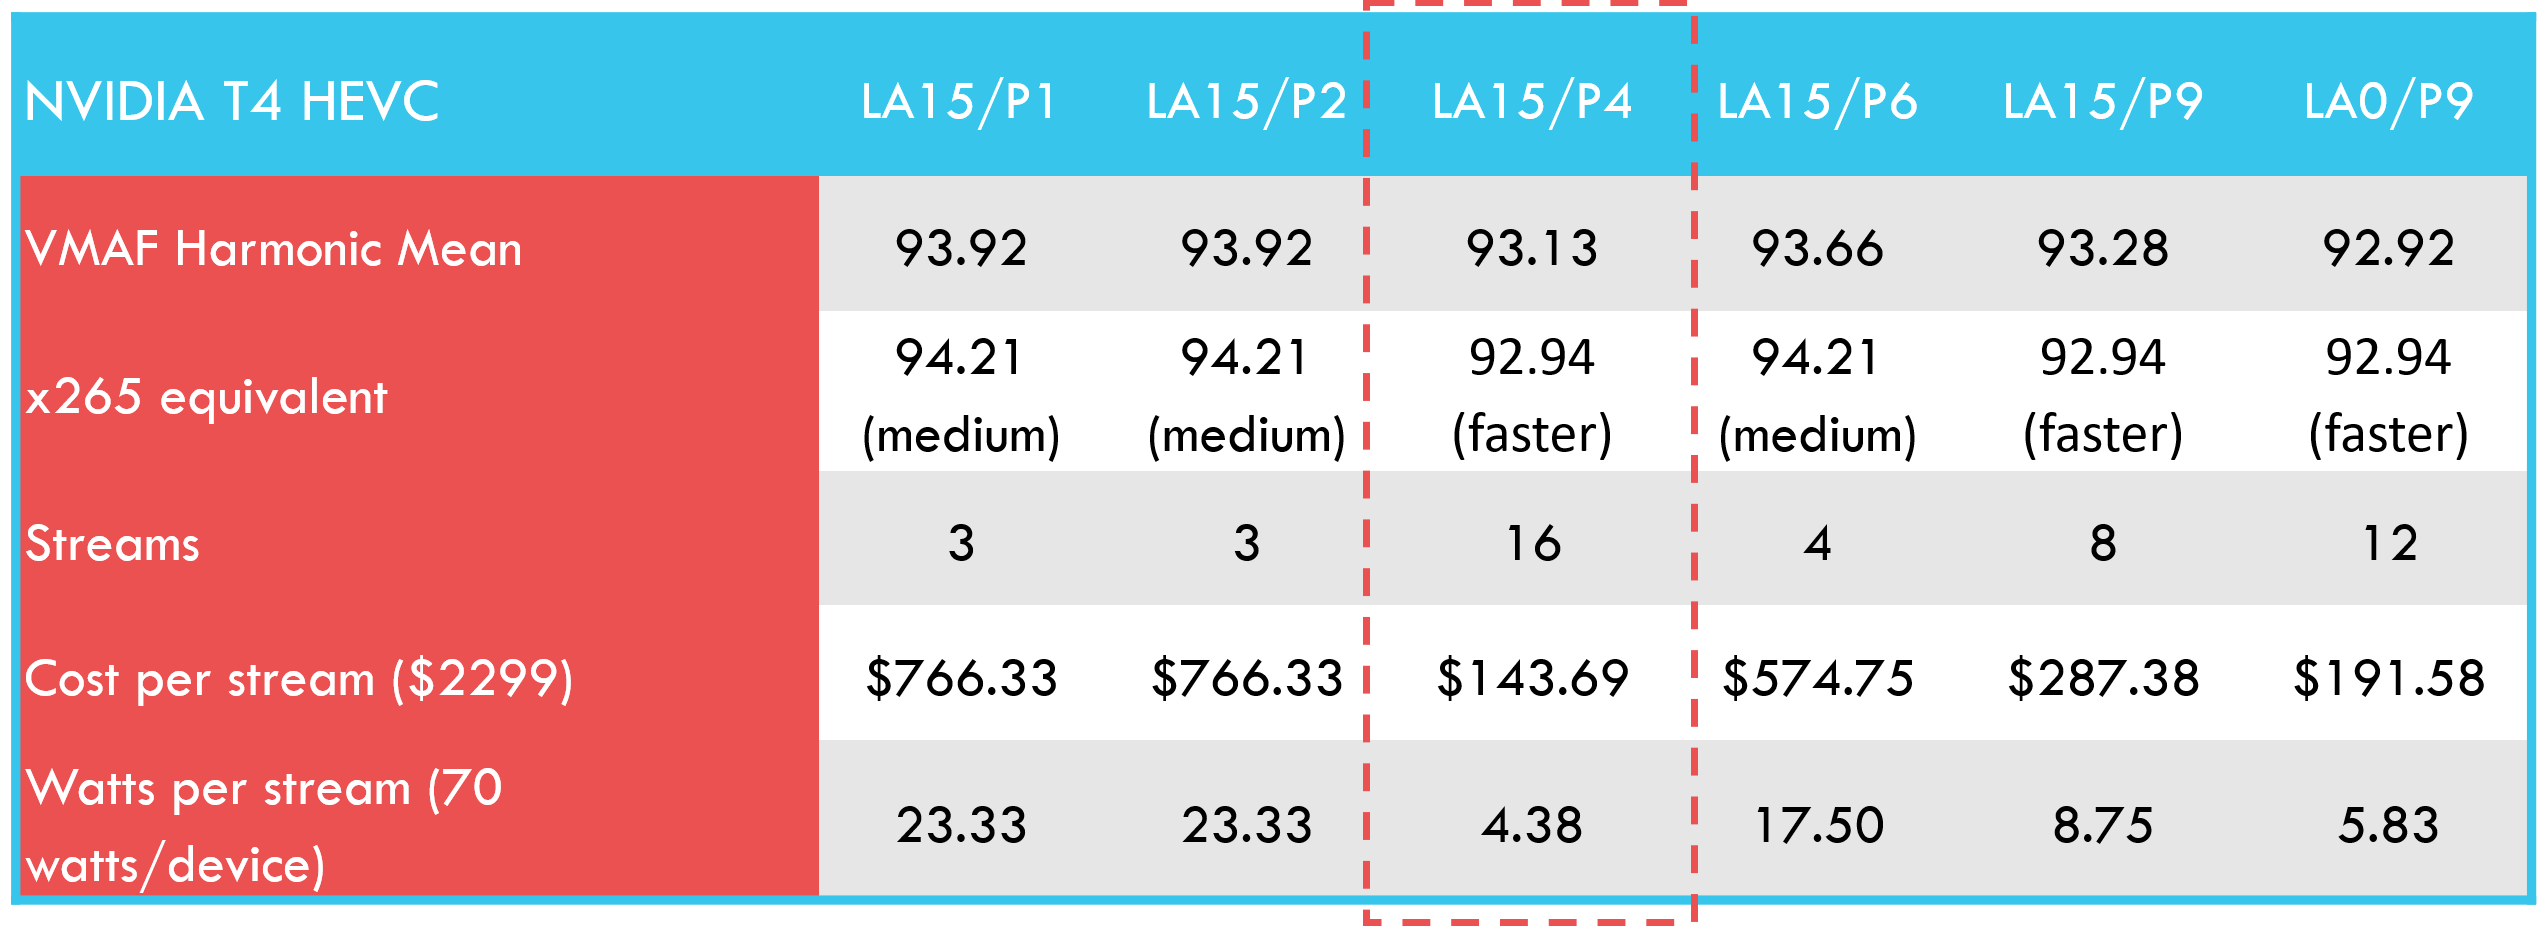
Table 2 shows the T4’s HEVC results. Though quality was again near the medium x265 preset with several combinations, throughput was very modest at 3 or 4 streams at that quality level. For HEVC, LA15/P4 stands out as the optimal configuration, with four times or better throughput than other combinations with higher-quality output.

In terms of expected preset behavior, LA15/P4 was again quite the anomaly, producing the highest throughput in the test suite with slightly lower quality than LA15/P6, which should deliver lower quality. Again, switching from LA 15 to LA 0 produced neither the expected spike in throughput nor a drop in quality, as we saw with the Quadra for both HEVC and H.264.

 NETINT Quadra vs. NVIDIA T4 – Benchmarking Hardware Encoding Performance
TABLE 2. HEVC OPTIONS AND RESULTS.

Quadra vs. T4

Now that we have identified the operating points for Quadra and the T4, let us compare quality, throughput, CAPEX, and OPEX. You see the data for H.264 in Table 3.

Here, the stream count was the same, so Quadra’s advantage in cost per stream and watts per stream related to its lower cost and more efficient operation. At their respective operating points, the Quadra’s VMAF harmonic mean quality was slightly higher, with a more significant advantage in the low-frame score, a predictor of transient quality problems.

 NETINT Quadra vs. NVIDIA T4 – Benchmarking Hardware Encoding Performance
TABLE 3. COMPARING QUADRA AND T4 AT H.264 OPERATING POINTS.

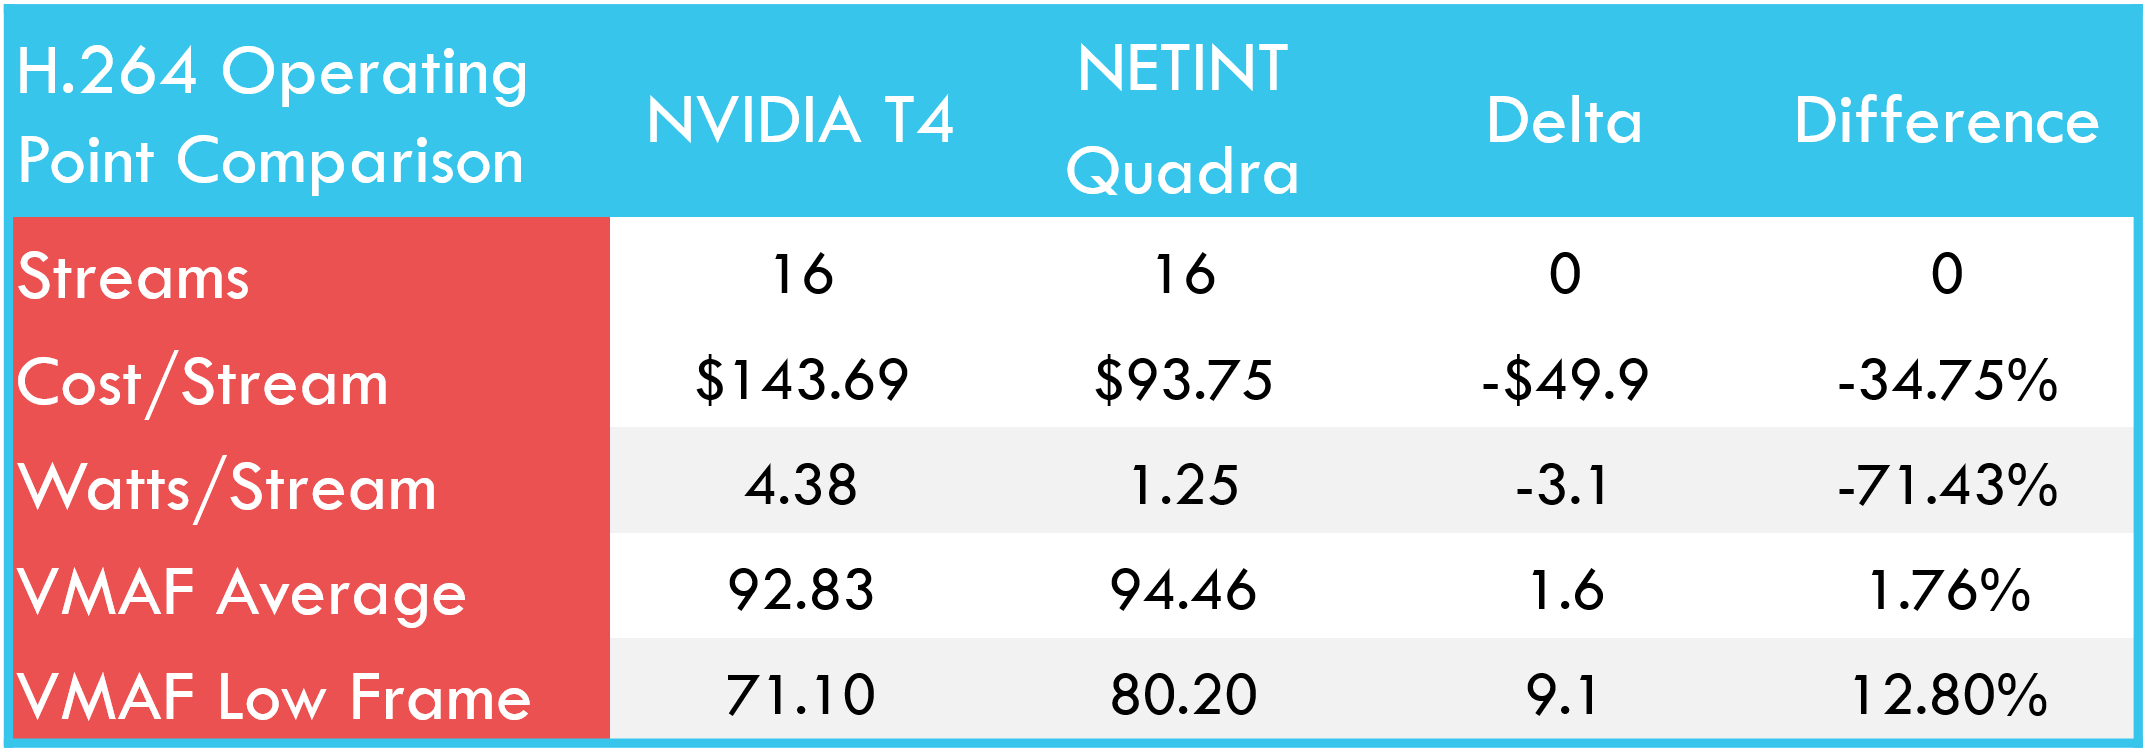
Table 4 shows the same comparison for HEVC. Here, Quadra output 75% more streams than the T4, which increases the cost per stream and watts per stream advantages. VMAF harmonic means scores were again very similar, though the T4’s low frame score was substantially lower.

 NETINT Quadra vs. NVIDIA T4 – Benchmarking Hardware Encoding Performance
TABLE 4. COMPARING QUADRA AND T4 AT HEVC OPERATING POINTS.

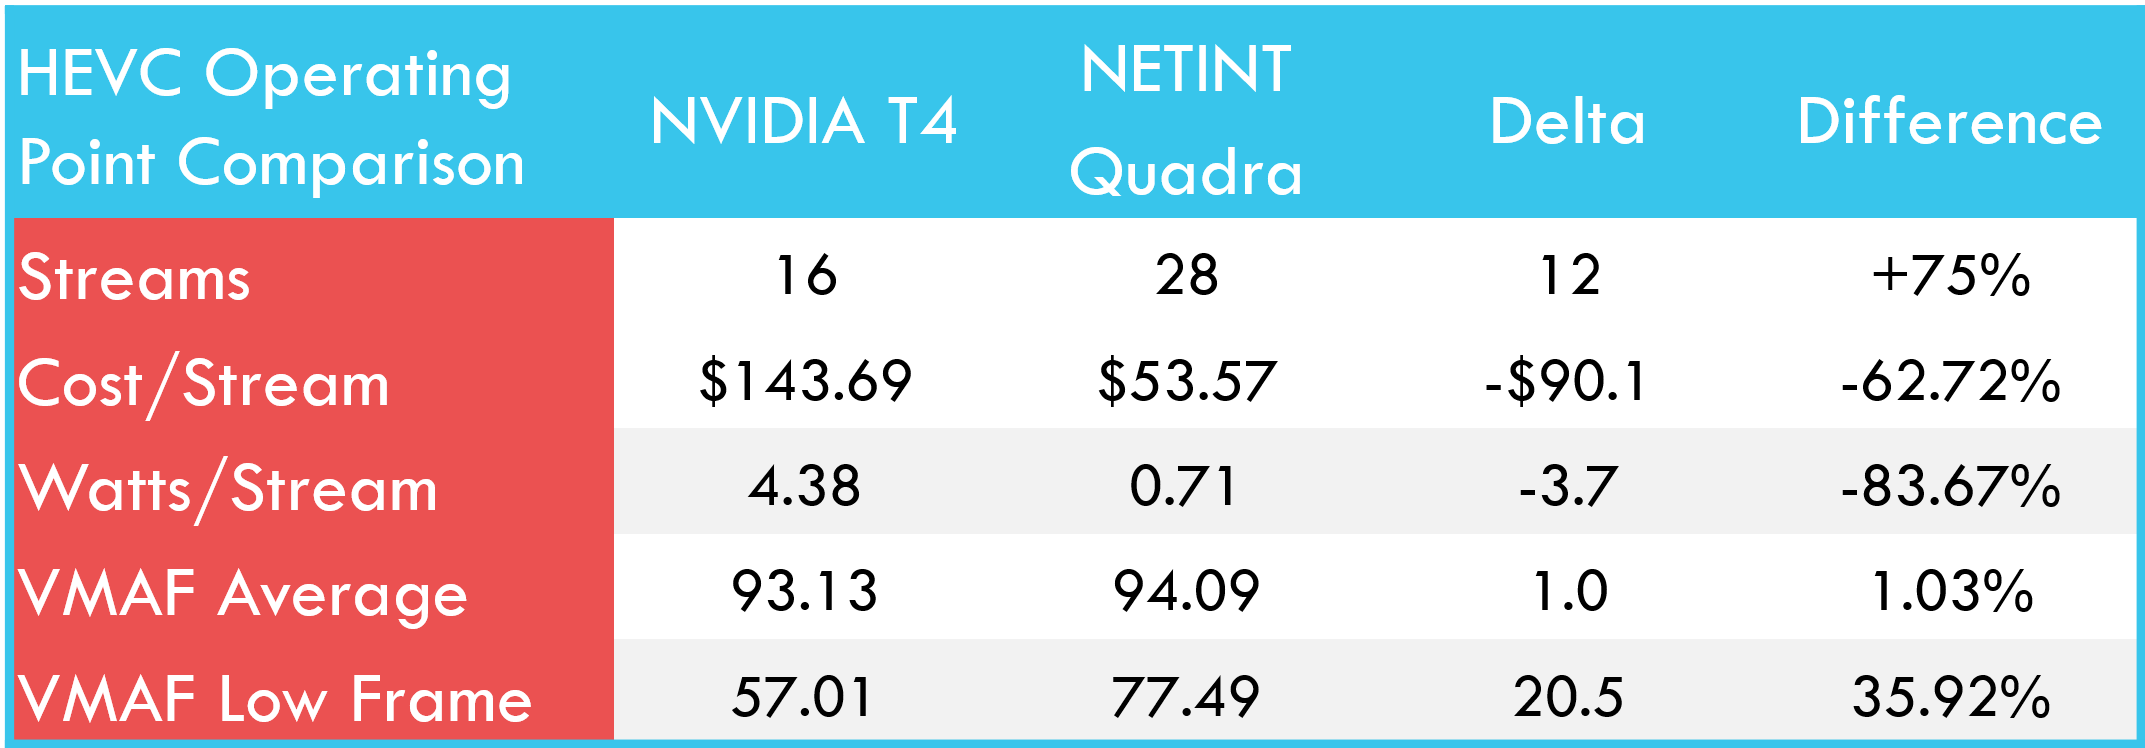
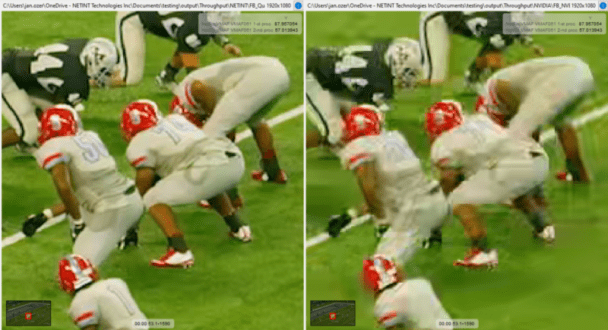
Figure 5 illustrates the low-frames and low-frame differential between the two files. It is the result plot from the Moscow State University Video Quality Measurement Tool (VQMT), which displays the VMAF score, frame-by-frame, over the entire duration of the two video files analyzed, with Quadra in red and the T4 in green. The top window shows the VMAF comparison for the entire two files, while the bottom window is a close-up of the highlighted region of the top window, right around the most significant downward spike at frame 1590.

 NETINT Quadra vs. NVIDIA T4 – Benchmarking Hardware Encoding Performance
FIGURE 5. THE DOWNWARD GREEN SPIKES REPRESENT THE LOW-FRAME SCORES IN THE T4 ENCODE.

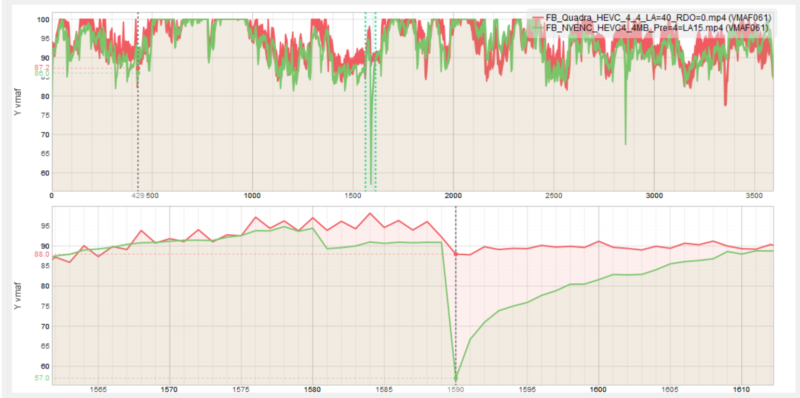
As you can see in the bottom window in Figure 5, the low-frame region extends for 2-3 frames, which might be borderline noticeable by a discerning viewer. Figure 6 shows a close-up of the lowest quality frame, Quadra on the left, T4 on the right, and the dramatic difference in VMAF score, 87.95 to 57, is certainly warranted. Not surprisingly, PSNR and SSIM measurements confirmed these low frames.

 NETINT Quadra vs. NVIDIA T4 – Benchmarking Hardware Encoding Performance
FIGURE 6. QUALITY COMPARISONS, NETINT QUADRA ON THE LEFT, T4 ON THE RIGHT.

It is useful to track low frames because if they extend beyond 2-3 frames, they become noticeable to viewers and can degrade viewer quality of experience. Mathematically, in a two-minute test file, the impact of even 10 – 15 terrible frames on the overall score is negligible. That is why it is always useful to visualize the metric scores with a tool like VQMT, rather than simply relying on a single score.

Summing Up

Overall, you should consider the procedure discussed in this and the previous article as the most important takeaway from these two articles. I am not an expert in encoding with NVIDIA hardware, and the results from a single or even a limited number of files can be idiosyncratic.

Do your own research, test your own files, and draw your own conclusions. As stated in the previous article, do not be impressed by quality scores without knowing the throughput, and expect that impressive throughput numbers may be accompanied by a significant drop in quality.

Whenever you test any hardware encoder, identify the most important quality/throughput configuration options, test over the relevant range, and choose the operating point that delivers the best combination of quality and throughput. This will give the best chance to achieve a meaningful apples vs. apples comparison between different hardware encoders that incorporates quality, cost per stream, and watts per stream.

About Jan Ozer

Avatar photo
I help companies train new technical hires in streaming media-related positions; I also help companies optimize their codec selections and encoding stacks and evaluate new encoders and codecs. I am a contributing editor to Streaming Media Magazine, writing about codecs and encoding tools. I have written multiple authoritative books on video encoding, including Video Encoding by the Numbers: Eliminate the Guesswork from your Streaming Video (https://amzn.to/3kV6R1j) and Learn to Produce Video with FFmpeg: In Thirty Minutes or Less (https://amzn.to/3ZJih7e). I have multiple courses relating to streaming media production, all available at https://bit.ly/slc_courses. I currently work as www.netint.com as a Senior Director in Marketing.

Check Also

Rating techniques that cut bandwidth costs.

Five Codec-Related Techniques to Cut Bandwidth Costs

The mandate for streaming producers hasn’t changed since we delivered RealVideo streams targeted at 28.8 …

Single-Pass vs Two-Pass VBR: Which is Better?

Let’s start this article with a quiz regarding how the quality and encoding speed of …

My FFmpeg-Related New Year’s Resolution: Document Before I Test

My typical workflow for testing-related articles and reports is to create the command string, run …

Leave a Reply

Your email address will not be published. Required fields are marked *