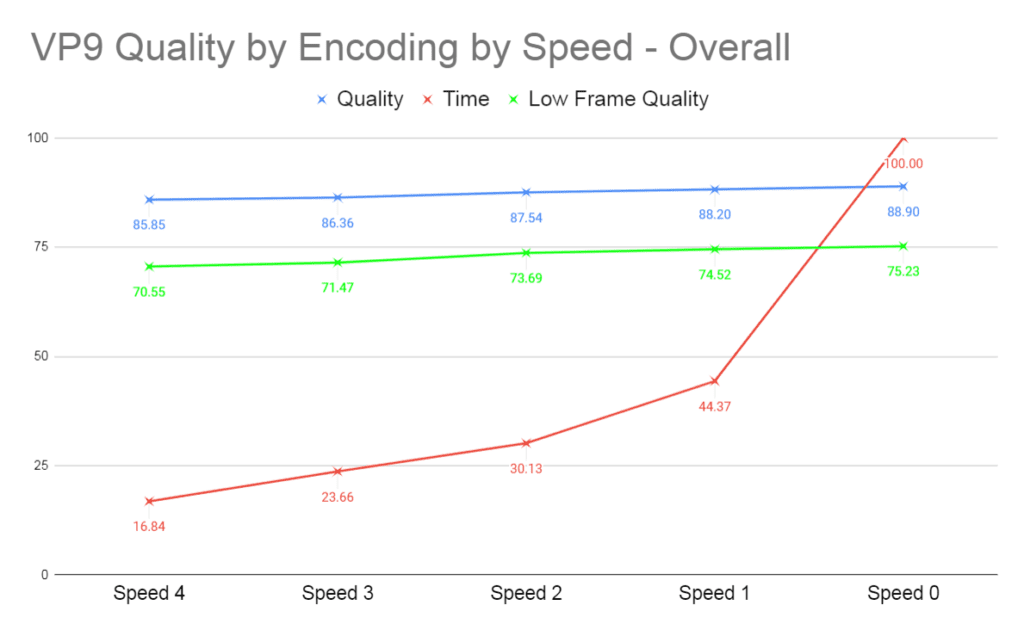
Producing the chart above involved encoding 35 files using 5 different presets and then recording start and stop times. Since the files were about 20-seconds long, seconds were important.
I’m sure a smarter compressionist than I could write a Python script to harvest the start and stop times but I do it by hand, which is complicated because Windows Explorer doesn’t show creation time by seconds, only by the hour and minute. You can access seconds by viewing the file properties, but this involves multiple clicks per file. For some reason, when you copy the information from the file properties window and paste it into Sheets, it’s not copied in as a number.
The answer? Open the folder in Google Chrome, which happily shows the files with easily copy-and-pastable hr:min:sec info. If you want to skip the video, you can access this view by typing what you see in the address bar in the screenshot below, but if you need additional help, check out the video below.
Here’s the video. This may sound trivial, but where you’re entering five data points for 35 files, any efficiency translates to lots of time savings.
This lesson has been added to the course, Computing and Using Video Quality Metrics: A Course for Encoding Professionals, which you can access here, or by clicking the course image below.
 Streaming Learning Center Where Streaming Professionals Learn to Excel


