 Streaming Learning Center Where Streaming Professionals Learn to Excel

Related Articles


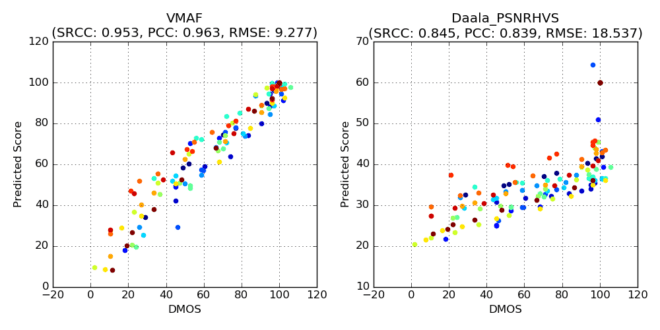
VMAF stands for Video Multimethod Assessment Fusion, but all you really need to know is that it’s the video quality metric co-invented by Netflix to replace the Peak Signal to Noise Ratio (PSNR) that used to fuel the company’s per-title encoding function. In the image above, which is courtesy of Netflix, you see how VMAF scores on the left more closely match subjective DMOS scores than Daala PSNR on the right. This makes VMAF the more accurate predictor of actual subjective ratings.
Netflix open-sourced VMAF so it’s starting to pop up in multiple tools, including the Hybrik cloud encoding service, which I use to compute many of my metrics, and it will be in the next version of the Moscow State University Video Quality Measurement Tool, which I use for the rest.
I’ve started using VMAF, but the scores have been opaque. For example, though we know that higher scores are better, what does a score of 55 mean? Will a viewer find the video good, bad, or indifferent? With PSNR, there are rough guidelines, as in 45 dB should mean very good quality, while under 35 dB could signal problems, though these typically only apply to full resolution comparisons. What do VMAF scores mean?
To explore these issues, I had a short conversation with a contact at Netflix. Here it is with slight editing for comprehension.
Me: I’m wondering if there are any rules of thumb for VMAF quality. With PSNR, I’m still using anything beyond 45 dB won’t be perceived by the viewer, anything under 35 dB will start to look ugly. Anything similar for VMAF? Any way to adjust for resolution (lower resolution is bound to look worse due to scaling artifacts and detail loss).
Netflix: VMAF has been trained using encodes spanning from CRF 22 @ 1080 (highest quality) to CRF 28 @ 240 (lowest quality). The former is mapped to score 100 and the latter is mapped to score 20. Anything in between is mapped in the middle (for example, SD encode at 480 is typically mapped to 40 ~ 70). Does this help?
Me: Thanks for this. It confirms the appropriate range of scores (and that the numbers Hybrik is providing are correct). For your uses, I guess you don’t care what is good or bad; the higher number is the better one. So, while I can draw comparative observations (this video should look better than that one) I can’t draw absolute (this score predicts that subjective ratings would be excellent).
Netflix: VMAF scores are relative, and say nothing about the quality of the source. But with respect to a source, VMAF can provide the 1-jnd increments for a bitrate ladder (6 VMAF points ~ 1 JND).
What Did We Learn?
Quite a lot.
First, VMAF scores should scale with resolution, which means lower resolution videos should score a lot worse than higher resolution videos. This makes sense, because lower resolution videos contain both compression artifacts and detail loss due to scaling. When zoomed to full screen (which is the correct assumption for Netflix’s application and most premium content distribution), the images will look softer.
Second, that a change of 6 VMAF points would be noticeable to a viewer. Both observations proved critical to a recent comparison I performed of per-title encoding technologies which I presented as a webinar here. Consider the data presented below.
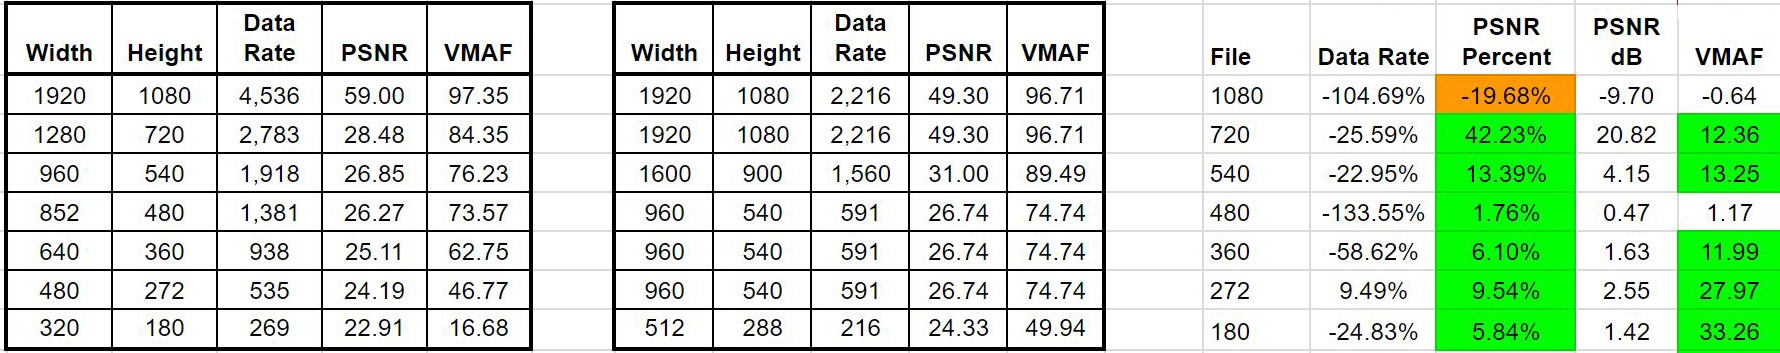
Per-title encoding data for a screencam video. Click to view the table at full resolution in another tab.
The data analyzes Brightcove’s Context-Aware Encoding (CAE) feature as applied to a Camtasia-based screencam video. On the left is encoding with the default encoding ladder, in the middle the ladder produced via CAE. As you can see on the left, VMAF scores ranged from 97.35 for the 1080p clip down to 16.68 for the 180p clip.
The CAE ladder is in the middle, and you see that CAE reduced the seven-rung encoding ladder down to four. On the right, I compare the quality and data rate of the original encoding ladder against the CAE ladder. Before you study the numbers, recognize that I compared streams based upon sustainable data rate.
That is, a viewer with a bandwidth of 1918 kbps would have played the 960×540 stream in the traditional ladder, but the 1600×900 stream of the CAE ladder, which was encoded at 1,560 kbps. A viewer with a bandwidth of 2,783 would watch the 720p stream with the traditional ladder, but the 1080p stream with the CAE ladder.
On the right, you see the change in data rate, PSNR percent, absolute PSNR dB and absolute VMAF score. Starting at the top, though CAE dropped the data rate of the 1080p file by 105% and 9.7 dB, the VMAF score only dropped by about .64, indicating no visible difference. This is confirmed by the 49.3 dB PSNR score, which would be visually indistinguishable from the original score of 59 dB.
Most lower rungs saw a very significant boost in PSNR score, but more importantly multiple VMAF improvements above the 6-point threshold. In this case, Brightcove’s CAE produced an encoding ladder that would have looked noticeably better than the original ladder.
Why was CAE so successful? Because with this low motion, synthetic video, it allowed Brightcove to deliver a higher resolution video to lower bitrate viewers than a traditional ladder. The result illustrates the key advantages of per-title encoding; happier viewers, lower bandwidth consumption, and lower storage and encoding costs from dropping from a seven rung ladder to four.
Back to VMAF, our primary concern as encoding professionals are differences that viewers will actually notice. In this regard, a reliable metric that can predict a just noticeable difference is an invaluable tool.


