 Streaming Learning Center Where Streaming Professionals Learn to Excel


Related Articles


Whether your business model is FAST or subscription-based premium content, your success depends upon your ability to deliver a high-quality viewing experience while relentlessly reducing costs. Transcoding is one of the most expensive production-related costs and the ultimate determinant of video quality, so obviously plays a huge role on both sides of this equation. This article identifies the most relevant metrics for ascertaining the true cost of transcoding and then uses these metrics to compare the relative cost of the available methods for live transcoding.
Contents
Cost Metrics
There are two potential cost categories associated with transcoding: capital costs and operating costs. Capital costs arise when you buy your own transcoding gear, while operating costs apply when you operate this equipment or use a cloud provider. Let’s discuss each in turn.
CAPEX
The simplest way to compare transcoders is to normalize capital and operating costs using the cost per stream or cost per ladder, which simplifies comparing disparate systems with different costs and throughput. The cost per stream applies to services inputting and delivering a single stream, while the cost per ladder applies to services inputting a single stream and outputting an encoding ladder.
We’ll present real-world comparisons once we introduce the available transcoding options, but for the purposes of this discussion, consider the simple example in Table 1. The top line shows that System B costs twice as much as System A, while line 2 shows that it also offers 250% of the capacity of System A. On a cost-per-stream basis, System B is actually cheaper.
| CAPEX | System A | System B |
| System cost | $10,000 | $20,000 |
| 1080p30 stream output | 50 | 320 |
| Cost per stream | $200 | $63 |
| Required streams | 640 | 640 |
| Required systems | 13 | 2 |
| Total CAPEX | $130,000 | $40,000 |
Table 1. A simple cost-per-stream analysis.
The next few lines use this data to compute the number of required systems for each approach and the total CAPEX. Assuming that your service needs 640 simultaneous streams, the total CAPEX for System A dwarfs that of System B. Clearly, just because a particular system costs more than another doesn’t make it the more expensive option.
For the record, the throughput of a particular server is also referred to as density, and it obviously impacts OPEX charges. System B delivers over six times the streams from the same 1RU rack as System A, so is much more dense, which will directly impact both power consumption and storage charges.
Details Matter
Several factors complicate the otherwise simple analysis of cost per stream. First, you should analyze using the output codec or codecs, current and future. Many systems output H.264 quite competently but choke considerably with the much more complex HEVC codec. If AV1 may be in your future plans, you should prioritize a transcoder that outputs AV1 and compare cost per stream against all alternatives.
The second requirement is to use consistent output parameters. Some vendors quote throughput at 30 fps, some at 60 fps. Obviously, you need to use the same value for all transcoding options. As a rough rule of thumb, if a vendor quotes 60 fps, you can double the throughput for 30 fps, so a system that can output 8 1080p60 streams and likely output 16 1080p30 streams. Obviously, you should verify this before buying.
If a vendor quotes in streams and you’re outputting encoding ladders, it’s more complicated. Encoding ladders involve scaling to lower resolutions for the lower-quality rungs. If the transcoder performs scaling on-board, throughput should be greater than systems that scale using the host CPU, and you can deploy a less capable (and less expensive) host system.
The last consideration involves the concept of “operating point,” or the encoding parameters that you would likely use for your production, and the throughput and quality at those parameters. To explain, most transcoders include encoding options that trade off quality vs throughput much like presets do for x264 and x265. Choosing the optimal setting for your transcoding hardware is often a balance of throughput and bandwidth costs. That is, if a particular setting saves 10% bandwidth, it might make economic sense to encode using that setting even if it drops throughput by 10% and raises your capital cost accordingly. So, you’d want to compute your throughput numbers and cost per stream at that operating point.
In addition, many transcoders produce lower throughput when operating in low latency mode. If you’re transcoding for low-latency productions, you should ascertain whether the quoted figures in the spec sheets are for normal or low latency.
For these reasons, completing a thorough comparison requires a two-step analysis. Use spec sheet numbers to identify transcoders that you’d like to consider and acquire them for further testing. Once you have them in your labs you can identify the operating point for all candidates, test at these settings, and compare them accordingly.
OPEX – Power
Now, let’s look at OPEX, which has two components: power and storage costs. Table 2 continues our example, looking at power consumption.
Unfortunately, ascertaining power consumption may be complicated if you’re buying individual transcoders rather than a complete system. That’s because while transcoding manufacturers often list the power consumption utilized by their devices, you can only run these devices in a complete system. Within the system, power consumption will vary by the number of units configured in the system and the specific functions performed by the transcoder.
Note that the most significant contributor to overall system power consumption is the CPU. Referring back to the previous section, a transcoder that scales onboard will require lower CPU contribution than a system that scales using the host CPU, reducing overall CPU consumption. Along the same lines, a system without a hardware transcoder uses the CPU for all functions, maxing out CPU utilization likely consuming about the same energy as a system loaded with transcoders that collectively might consume 200 watts.
Again, the only way to achieve a full apples-to-apples comparison is to configure the server as you would for production and measure power consumption directly. Fortunately, as you can see in Table 2, stream throughput is a major determinant of overall power consumption. Even if you assume that systems A and B both consume the same power, System B’s throughput makes it much cheaper to operate over a five year expected life, and much kinder to the environment.
| Power Costs | System A | System B |
| System power consumption (watts) | 400 | 500 |
| 1080p30 stream output | 50 | 320 |
| Watts per stream | 8 | 1.5625 |
| Required streams | 640 | 640 |
| Total watts | 5120 | 1000 |
| Kilowatts per year | 44851.2 | 8760 |
| FIve year cost @ $.08 | $17,940 | $3,504 |
Table 2. Computing the watts per stream of the two systems.
Storage Costs
Once you purchase the systems, you’ll have to house them. While these costs are easiest to compute if you’re paying for a third-party co-location service, you’ll have to estimate costs even for in-house data centers. Table 3 continues the five year cost estimates for our two systems, and the denser system B proves much cheaper to house as well as power.
| Co-location costs | System A | System B |
| Required output streams | 640 | 640 |
| Steams per system | 20 | 50 |
| Required systems | 13 | 2 |
| Five-year cost (@ $50/month per 1RU) | $39,000 | $6,000 |
Table 3. Computing the storage costs for the two systems.
Transcoding Options
These are the cost fundamentals, now let’s explore them within the context of different encoding architectures.
There are three general transcoding options: CPU-only, GPU, and ASIC-based. There are also FPGA-based solutions, though these will probably be supplanted by cheaper-to-manufacture ASIC-based devices over time. Briefly,
- CPU-based transcoding, also called software-based transcoding, relies on the host central processing unit, or CPU, for all transcoding functions.
- GPU-based transcoding refers to Graphic Processing Units, which are developed primarily for graphics-related functions but may also transcode video. These are added to the server in add-in PCIe cards.
- ASICs are Application-Specific Integrated Circuits designed specifically for transcoding. These are added to the server as add-in PCIe cards or devices that conform to the U.2 form factor.
Real-World Comparison
NETINT manufactures ASIC-based transcoders and video processing units. Recently, we published a case study where a customer, Mayflower, rigorously and exhaustively compared these three alternatives, and we’ll share the results here.
By way of background, Mayflower’s use case needed to input 10,000 incoming simultaneous streams and distribute over a million outgoing simultaneous streams worldwide at a latency of one to two seconds. Mayflower hosts a worldwide service available 24/7/365.
Mayflower started with 80-core bare metal servers and tested CPU-based transcoding, then GPU-based transcoding, and then two generations of ASIC-based transcoding. Table 4 shows the net/net of their analysis, with NETINT’s Quadra T2 delivering the lowest cost per stream and the greatest density, which contributed to the lowest co-location and power costs.
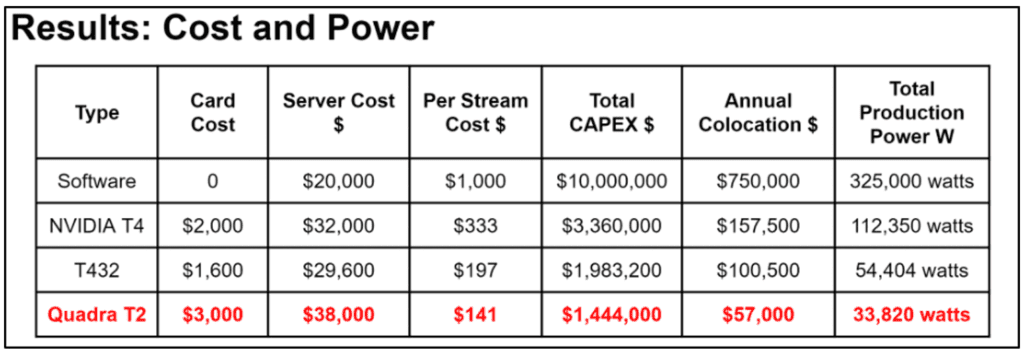
As you can see, the T2 delivered an 85% reduction in CAPEX with ~90% reductions in OPEX as compared to CPU-based transcoding. CAPEX savings as compared to the NVIDIA T4 GPU was about 57%, with OPEX savings around ~70%.
Table 5 shows the five-year cost of the Mayflower T-2 based solution using the cost per KWH in Cyprus of $0.335. As you can see, the total is $2,225,241, a number we’ll return to in a moment.
| CAPEX | $1,444,000 | |
| Five year co-location | $285,000 | |
| Kilowatts per year | 296,263 | |
| Five-year cost at $0.335 | $496,241 | |
| Total Mayflower five-year cost | $2,225,241 |
Table 5. Five-year cost of the Mayflower transcoding facility.
Just to close a loop, Tables 1, 2, and 3, compare the cost and performance of a Quadra Video Server equipped with ten Quadra T1U VPUs (Video Processing Units) with CPU-based transcoding on the same server platform. You can read more details on that comparison here.
Table 6 shows the total cost of both solutions. In terms of overall outlay, meeting the transcoding requirements with the Quadra-based System B costs 73% less than the CPU-based system. If that sounds like a significant savings, keep reading.
| Total cost | System A | System B |
| System | $130,000 | $40,000 |
| Power | $17,940 | $3,504 |
| Co-location | $39,000 | $6,000 |
| Total | $186,940 | $49,504 |
Table 6. Total cost of the CPU-based System A and Quadra T2-based System B.
Cloud Comparison
If you’re transcoding in the cloud, all of your costs are OPEX. With AWS, you have two alternatives: producing your streams with Elemental MediaLive or renting EC3 instances and running your own transcoding farm. We considered the MediaLive approach here, and it appears economically unviable for 24/7/365 operation.
Using Mayflower’s numbers, the CPU-only approach required 500 80-core Intel servers running 24/7. The closest CPU in the Amazon ECU pricing calculator was the 64-core c6i.16xlarge, which, under the EC2 Instance Savings plan, with a 3-year commitment and no upfront payment, costs 1,125.84/month.
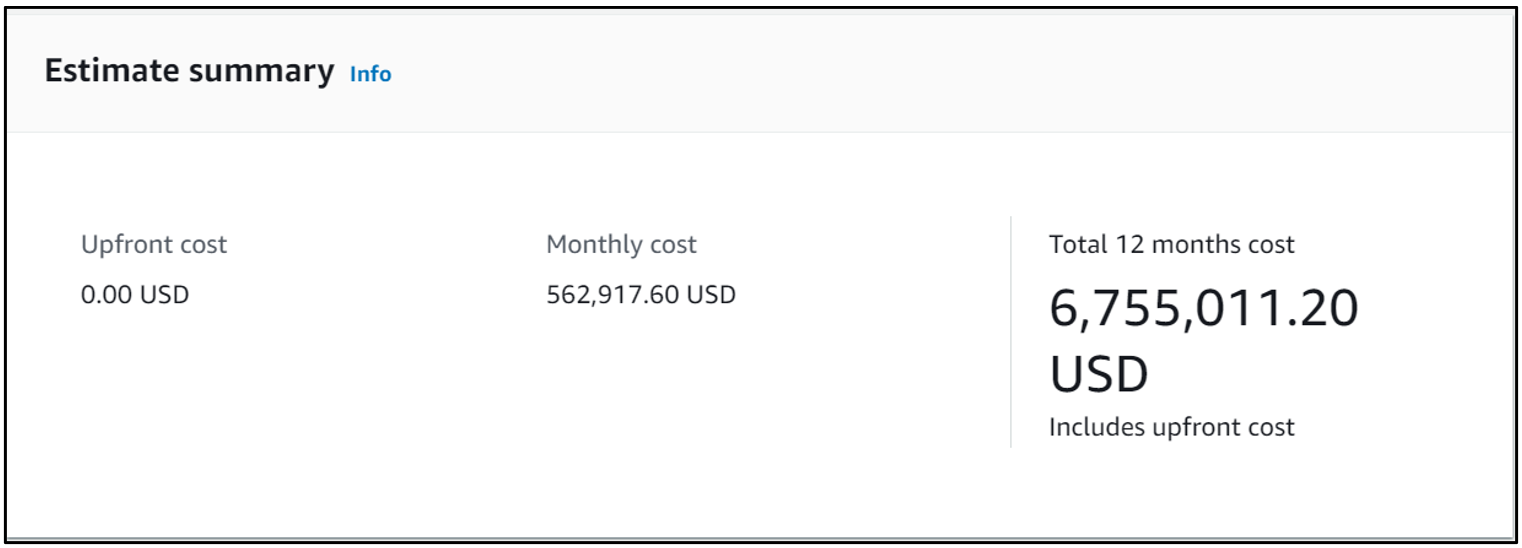
We used Amazon’s pricing calculator to roll these numbers out to 12 months and 500 simultaneous servers, and you see the annual result in Figure 1. Multiply this by five to get to the five-year cost of $33,775,056, which is 15 times the cost of the Quadra T2 solution, as shown in table 5.
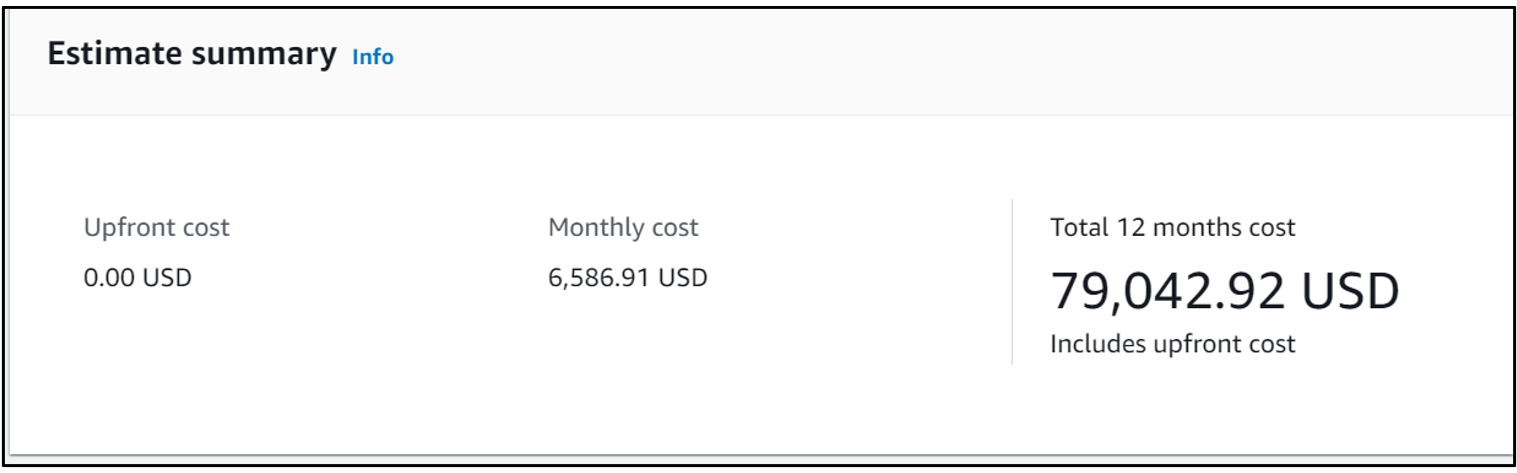
We ran the same calculation on the 13 systems required for the Quadra Video Server analysis shown in Tables 1-3 which was powered by a 32-core AMD CPU. Assuming a c6a.8xlarge CPU with a 3-year commitment and no upfront payment,, this produced an annual charge of $79,042.95, or $395,214.6 for the five-year period, which is about 8 times more costly than the Quadra-based solution.
Cloud services are an effective means for getting services up and running, but are vastly more expensive than building your own encoding infrastructure. Service providers looking to achieve or enhance profitability and competitiveness should strongly consider building their own transcoding systems. As we’ve shown, building a system based on ASICs will be the least expensive option.
In August, NETINT held a symposium on Building Your Own Live Streaming Cloud. The on-demand version is available for any video engineer seeking guidance on which encoder architecture to acquire, the available software options for transcoding, where to install and run your encoding servers, and progress made on minimizing power consumption and your carbon footprint.


