 Streaming Learning Center Where Streaming Professionals Learn to Excel

Related Articles


Whether you know it or not, many of the videos that you watch have been configured using video quality metrics. Oh, you disagree? Well, have you have watched Netflix recently? Over the last 2 years or so, Netflix’s encoding ladders have been driven by the company’s Video Multimethod Assessment Fusion (VMAF) metric and, before that, Peak Signal to Noise Ratio (PSNR). Not a Netflix customer? Well, how about YouTube? YouTube uses a neural network based upon constant rate factor encoding, which itself is driven by an internal video quality metric.
Simply stated, video quality metrics attempt to predict how a subjective viewer would rate a particular video, and metrics are comparatively rated based upon the accuracy of these predictions. Of course, there are many purists who insist that subjective comparisons are the only valid technique for gauging quality, and indeed, properly administered subjective tests are the gold standard.
However, when you consider that 400 hours of video are uploaded to YouTube each minute, you can appreciate that the service has a strong need to encode its streams as efficiently as possible and a total inability to deploy humans to make it happen. Even Netflix, with a comparatively paltry 1,000 hours of new content in 2017, can’t use human eyes to create the customized encoding ladders for each video. For both companies, and many others, objective quality metrics are essential.
The bottom line is that if you’re in charge of encoding for your organization, and you’re not using objective video quality metrics in one form or another, you’re behind the curve. Fortunately, you’re also in the right place. In this article, I’ll provide an overview of what video quality metrics are and how they work, introduce you to the most common tools for applying them, and tell you how to choose the best metric and tool for your needs.
Contents
What Metrics Measure (And How)
You’ve probably heard of metrics like PSNR, Structural Similarity index (SSIM), and perhaps even Netflix’s VMAF. To understand how they differ, it’s useful to understand how each came about and what each measures.
ERROR-BASED METRICS
The first class of metrics are error-based. They compare the compressed image to the original and create a score that mathematically represents the differences between the two images, also called noise or error. The PSNR ratio is a good example. Metrics based upon this approach are simple and easy to compute, but scores often don’t correlate well with subjective ratings because human eyes perceive errors differently.
As an example, I was once testing an encoding tool, and the output files produced a dismal PSNR score. I played the compressed video several times and couldn’t see why. Then I compared the encoded image to the original and noticed a slight color shift that accounted for the poor score. During real-time playback without the original to compare, no viewer would have noticed the shift, so in that case, PSNR was a poor predictor of subjective performance.
Why do companies, including Netflix and Mozilla (relating to the AV1 codec), continue to publish PSNR results? First, because it’s the best-known metric, so the scores are easy to understand. Second, despite its age, PSNR continues to provide very useful data in a number of scenarios, some of which I’ll discuss below.
PERCEPTUAL-BASED MODELS
At a high level, perceptual-based models like the SSIM attempt to incorporate how humans perceive errors, or “human visual system models,” to more accurately predict how humans will actually rate videos. For example, according to Wikipedia, while PSNR estimates absolute errors, “SSIM is a perception-based model that considers image degradation as perceived change in structural information, while also incorporating important perceptual phenomena, including both luminance masking and contrast masking terms.” In other words, perceptual-based metrics measure the errors and attempt to mathematically model how humans perceive them.
Perceptual-based models range from simple, like SSIM, to very complex, like SSIMWave’s SSIMPLUS metric, or Tektronix’s Picture Quality Rating (PQR) and Attention-weighted Difference Mean Opinion Score (ADMOS). All three of these ratings can incorporate display type into the scoring, including factors like size, brightness, and viewing distance, which obviously impact how errors are perceived.
ADMOS also offers attention weighting, which prioritizes quality in the frame regions that viewers will focus on while watching the video. So, a blurred face in the center of the screen would reduce the score far more than blurred edges, while a purely error-based model would likely rate them the same.
While these metrics take years of research, trial and error, and testing to formulate, at the end of the day, they are just math—formulas that compare two videos, crunch the numbers, and output the results. They don’t “learn” over time, as do those metrics in the next category. In addition, depending upon the metric, they may or may not incorporate temporal playback quality into the evaluation.
Similarly, most of these metrics were developed when comparisons were full resolution compressed frame to full resolution original frame. The invention of the encoding ladder, and the decisions relating thereto, create a new type of analysis. For example, when creating the encoding ladder for a 1080p source video, you may compare the quality of two 1.5Mbps streams, one at 540p, the other at 720p. All metrics can compute scores for both alternatives; you simply scale each video up to 1080p and compare it to the source. But few of these older metrics were designed for this analysis. (More on this in a moment.)
MACHINE LEARNING AND METRIC FUSION
The final category of metrics involves the concept of machine learning, which is illustrated in Figure 1 from a Tektronix presentation on TekMOS, the company’s new quality metric. Briefly, MOS stands for mean opinion score, or the results from a round of subjective testing, typically using a rating from 1 (unacceptable) to 5 (excellent).
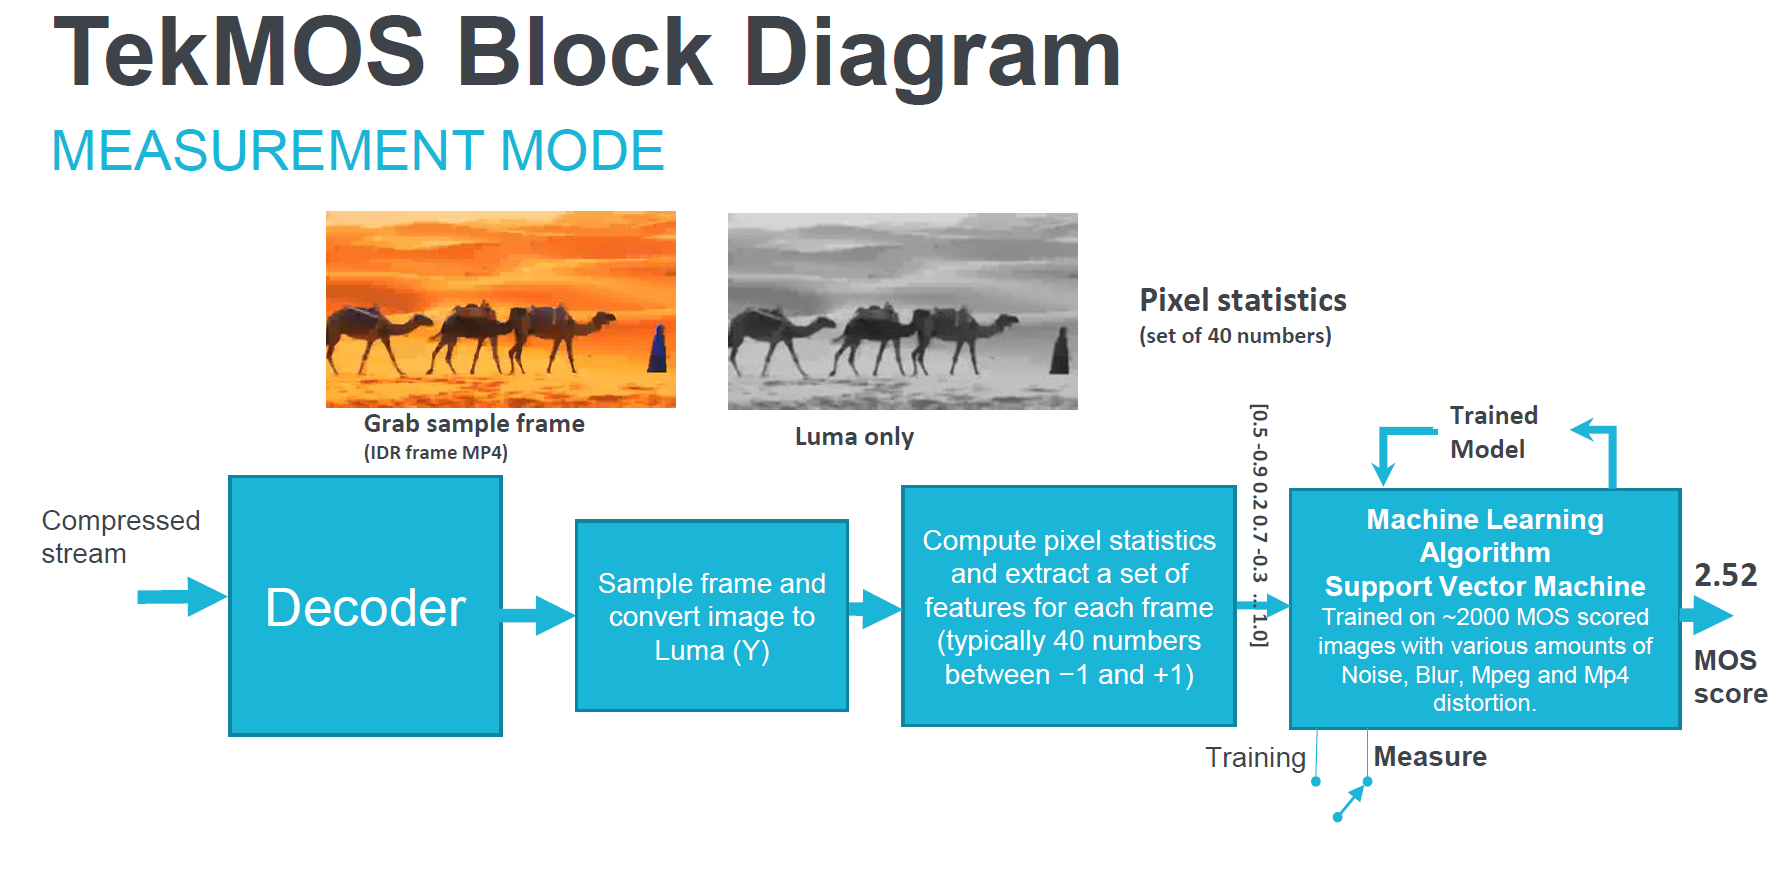 Figure 1. TekMOS metric and machine learning
In training mode, which is shown in the figure, the metric converts each frame into a set of numerical datapoints, representing multiple values such as brightness, contrast, and the like. Then it compares those values to over 2,000 frames with MOS scores from actual subjective evaluations, so that it “learns” the values that produce a good or bad subjective MOS score. In measurement mode, TekMOS takes what it learned from those 2,000-plus trials, inputs the numerical datapoints from the frame it’s analyzing, and outputs a MOS score.
Like the metrics discussed above, machine learning algorithms start with a mathematical model. However, it compares results with subjective MOS scores trains and fine-tunes the model so that it improves over time. Plus, the machine learning itself can be tuned, so one model could represent animations, another sports, and so on, allowing organizations to train the metric for videos most relevant to them.
Netflix’s VMAF is another metric that can be trained, using what’s called a support vector machine. Since the primary use for VMAF is to help Netflix produce encoding ladders for its per-title encoding, the Netflix training dataset includes clips ranging in resolution from 384×288 to 1080p at data rates ranging from 375Kbps to 20Mbps. Again, by correlating the mathematical result with subjective MOS scores, VMAF became much better at making the 540p vs. 720p decision mentioned above.
As the name suggests, VMAF is a fusion of three metrics, two that measure image quality and one that measures temporal quality, making it a true “video” metric. Similarly, Tektronix’s TekMOS metric includes a temporal decay filter that helps make the scoring more accurate for video. TekMOS also has a region of interest filter, which VMAF currently lacks. One huge benefit of VMAF is that Netflix chose to open source the metric, making it available on multiple platforms, as you’ll learn more about below.
Which Metric Is Best?
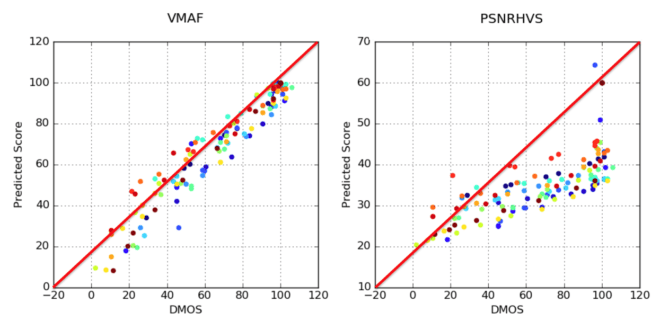
No article on metrics would be complete without scatter graphs like those shown in Figure 2, which were adopted slightly from Netflix’s blog post on VMAF. The scatter graph on the left compares the VMAF scores (left axis) with actual MOS scores (bottom axis). The graph on the right does the same for a different metric entitled PSNRHVS.
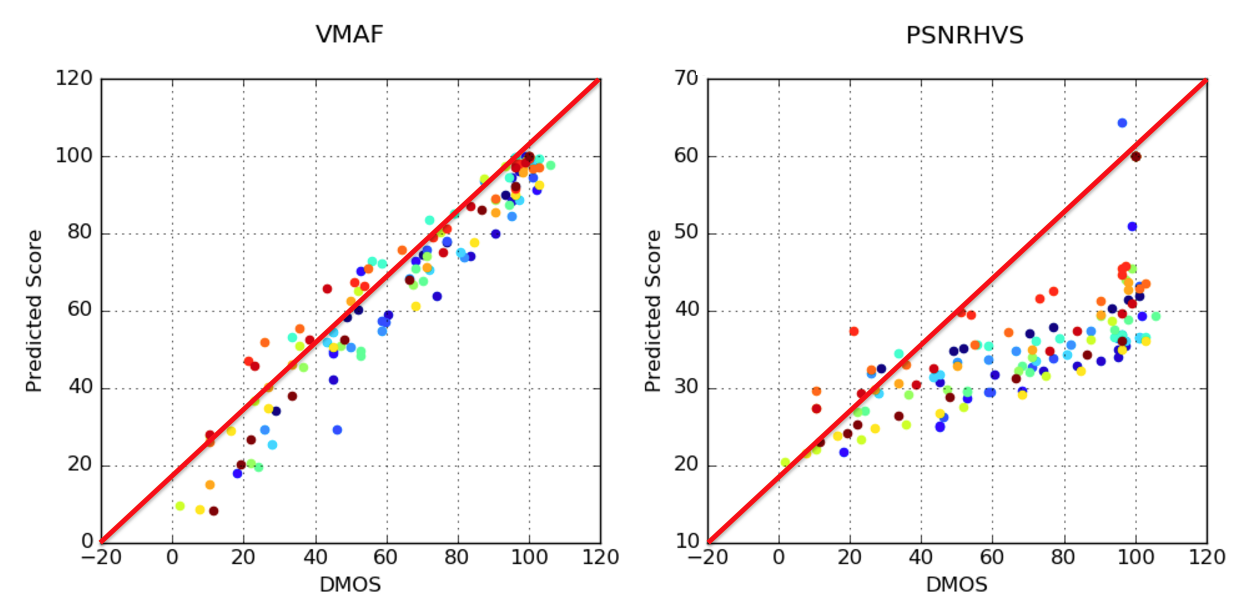 Figure 2. Scatter graphs comparing the metrics
If the scores corresponded exactly, they would all fit directly on the red diagonal line, though, of course, that never happens. Still, the closer to the line, and the tighter the pattern around the line, the more the metric accurately predicts human subjective scores. In this fashion, Figure 2 tells us that VMAF is a superior metric.
What’s interesting is that every time a metric is released, it comes with a scatter graph much like that shown on the left. SSIMPLUS has one, TekMOS has one, and Tektronix’s older metrics, PQR and ADMOS, had them as well. This is not to cast doubt on any of their results, but to observe that all of these metrics are highly functional and generally correlate with subjective ratings more accurately than PSNR.
However, accuracy is not the only factor to consider when choosing a metric. Let’s explore some of the others.
Referential vs. Non-Referential
One critical distinction between metrics is referential vs. non-referential. Referential metrics compare the encoded file to the original to measure quality, while non-referential metrics analyze only the encoded file. In general, referential metrics are considered more accurate, but obviously can be used in a much more limited circumstance since the source file must be available.
Non-referential metrics can be applied anywhere the compressed file lives. As an example, TekMOS is included in the Tektronix Aurora platform, an automated quality control package that can assess visual quality, regulatory compliance, packaging integrity, and other errors. Telestream subsidiary IneoQuest developed iQ MOS, a non-referential metric that can provide real-time quality assessments of multiple streams in the company’s line of Inspector products.
So when choosing a metric, keep in mind that it might not be available where you actually want to use it. Referential metrics are typically used where encoding takes place, where non-referential metrics can be applied anywhere the video on demand (VOD) file exists, or where a live stream can be accessed.
Metric Whispering
When choosing a metric, it’s important to understand exactly what the scores represent and what they don’t. For example, with the SSIMPLUS metric, which runs from 1–100, a score from 80–100 predicts that a subjective viewer would rate the video as excellent. These subjective ratings drop to good, fair, poor, and bad in 20-point increments. Most MOS-based metrics, including TekMOS, score like their subjective counterparts, on a scale from 1–5, with 5 being the best and 1 considered unacceptable. This type of scoring makes the results very easy to understand and communicate.
In contrast, PSNR measures decibels on a scale from 1–100. Though these numbers are not universally accepted, Netflix has posited that values in excess of 45dB yield no perceivable benefits, while values below 30 are almost always accompanied by visual artifacts. These observations have proven extremely useful for my work, but only when comparing full-resolution output to full-resolution source. When applied to lower rungs in an encoding ladder, higher numbers are better, but lose their ability to predict a subjective rating. For example, for 360p video compared to the original 1080p source, you’ll seldom see a PSNR score higher than 39dB, even if there are no visible compression artifacts.
Though SSIM, and particularly Multi-Scale SSIM (MS SSIM), are more accurate metrics than PSRN, it’s scoring system anticipates a very small range from -1 to +1, with higher scores better. Most high-quality video is around .98 and above, which complicates comparisons. While you can mathematically calculate how much better .985 is than .982, at the end of the day, it still feels irrelevant.
VMAF scores also rank from 1–100. While higher scores are always better, individual scores, like a rating of 55 for a 540p file, have no predictive value of subjective quality. You can’t tell if that means the video is perfect or awful. That said, when analyzing an encoding ladder, VMAF scores typically run from the low teens or lower for 180p streams, to 98+ for 1080p streams, which meaningfully distinguishes the scores. In addition, VMAF differences of 6 points or more equals a just-noticeable difference (JND), which is very useful for analyzing a number of encoding-related scenarios, including codec comparisons.
The scoring range of VMAF over the diverse rungs of the encoding ladder makes it attractive for choosing the best resolution/data rate streams in the ladder. In contrast, PSNR might range from 30–50dB, with the lower four rungs compressed between 30–37. This reduces its value as a predictor of the perceptible difference between these rungs.
Before choosing a metric, you should understand what the scores tell you, and make sure it tells you what you need to know.
Accessing the Metric
Don’t choose a metric without understanding how you’ll access it and how much it will cost to do so. In this section, I’ll briefly discuss the tools that can compute the metrics above, starting with FFmpeg, a free tool that can compute both PSRN and SSIM.
The Moscow State University (MSU) Video Quality Metric Tool (VQMT, $999 direct) supports a range of metrics like PSNR, SSIM, MS SSIM, and many others, including VMAF in version 10, which is now in beta. The top window in Figure 3 shows the VMAF score for two 1080p talking head files, one encoded at 4500Kbps, the other at 8500Kbps, with the top graph showing the entire file, the lower graph the highlight region on the left in the upper graph. The scores are very close, indicating that additional 4Mbps spent on the highest-quality stream is a waste.
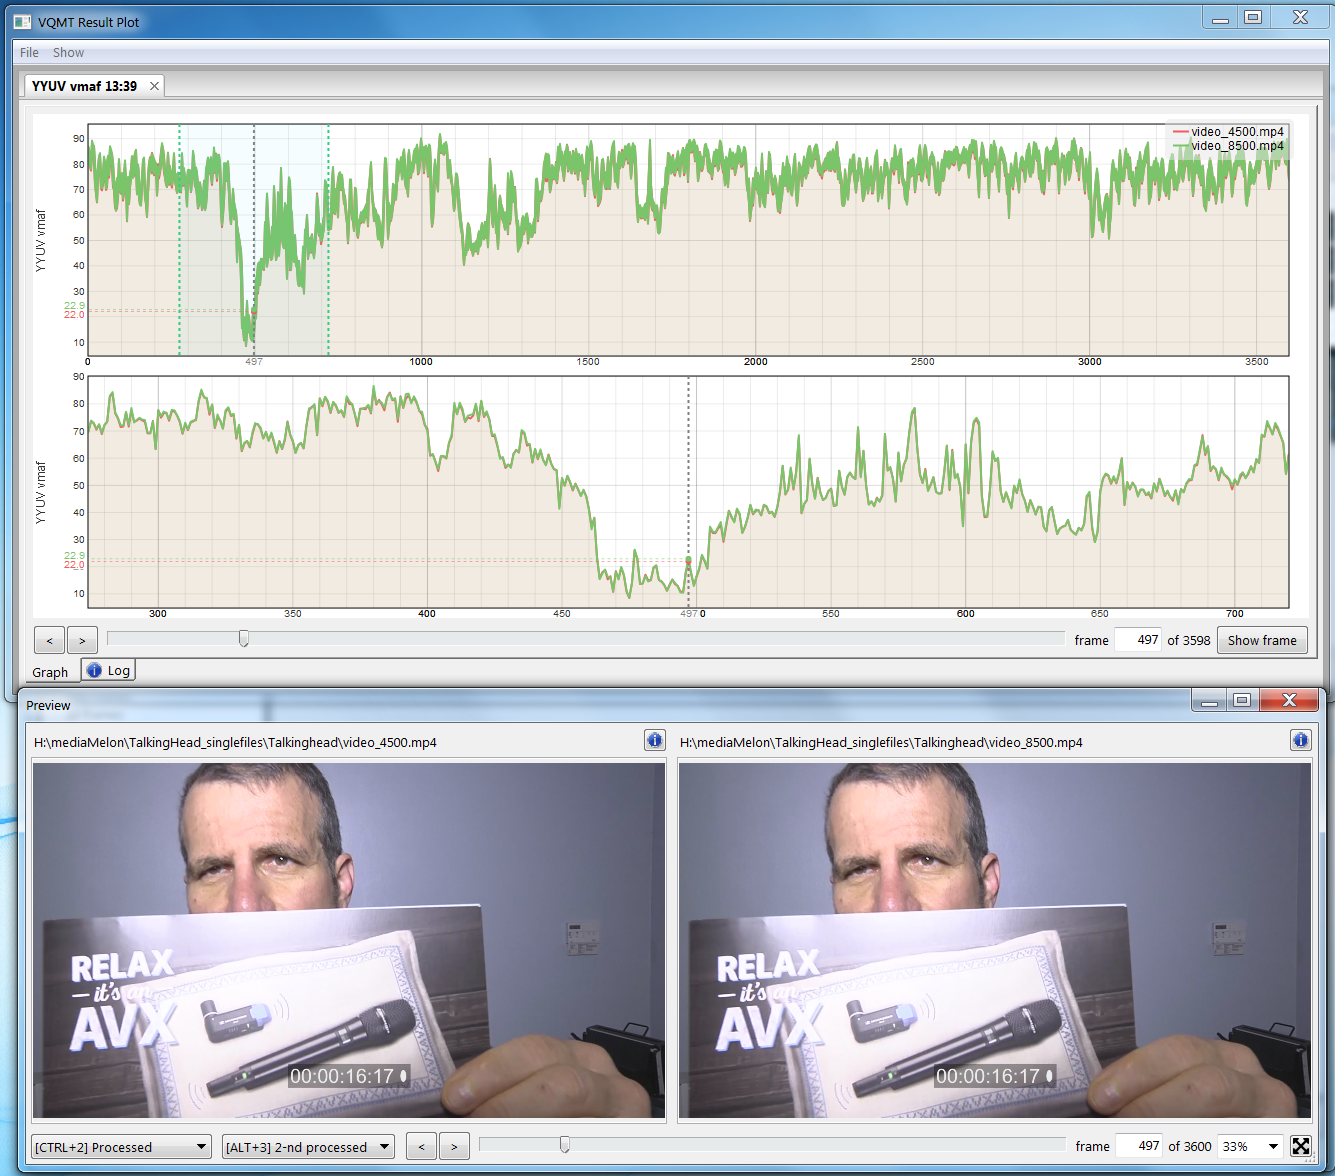 Figure 3. VMAF comparisons in the Moscow State University VQMT
You can drag the playhead and visualize any frame in the video, either side-by-side, as shown in the bottom of Figure 3, or one atop the other. This latter view makes it simple to switch between the two encoded files and the original, which is better for visualizing minor differences like the color shift mentioned above. VQMT offers perhaps the best interface of any tool for making A/B comparisons between two encoded files (Figure 3), and its batch operation is very flexible.
On the downside, VQMT can only compare files of identical resolution, so if you’re analyzing lower-resolution rungs on your encoding ladder, you’ll have to manually scale them to full resolution first, which takes time and lots of hard disk space. In the beta, the implementation of VMAF is painfully slow, literally using only one core of my 40-core HP Z840 workstation, though hopefully this will improve in the final shipping product. MSU offers a free trial that only works with files smaller than 720p, but it’s a great way to get familiar with the program. We reviewed an older version of VQMT.
Hybrik Media Analyzer
For high-volume analysis, the Hybrik Media Analyzer (Figure 4), which can compute PSNR, SSIM, and VMAF, is hard to beat. As an example, for a recent talk at Streaming Media West, I evaluated four per-title technologies with 15 test files and a seven-rung encoding ladder. I had to run each system twice, once to find the baseline, the other to deploy per-title encoding. This means I had to compute PSNR and VMAF about 840 times each and get the results copied into a spreadsheet.
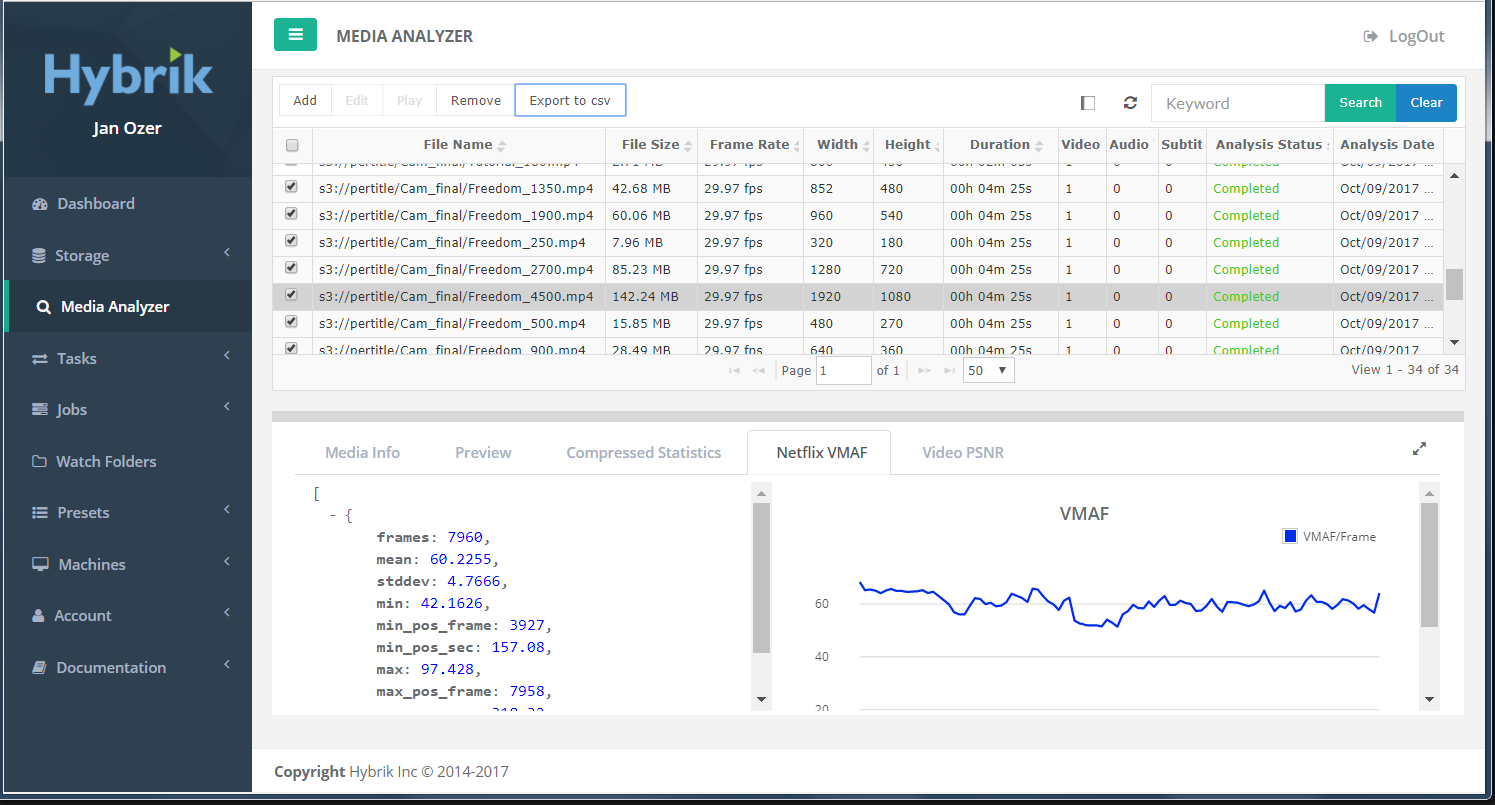 Figure 4. Hybrik Media Analyzer
You can drive operation via the JSON API, of course, but the UI is even simpler. You load the seven encoded files at once, choose the source file and the tests to run, and the cloud encoder takes it from there, performing all necessary scaling automatically. That’s one input task, seven outputs. Once the analysis is complete, you can export the results into a CSV file and import that into your spreadsheet, reducing 30 or so copy-and-paste operations (resolution, data rate, PSNR, VMAF score for each rung) into three or four, saving time and reducing the potential for errors. Hybrik is also much more CPU efficient than MSU VQMT when running VMAF, so it can make more efficient use of all cloud instances.
The only problem is that Hybrik doesn’t offer analysis-only pricing, and the minimum charge for accessing the system is $1,000/month for up to 10 simultaneous cloud instances running the AWS-based system. If this cost isn’t prohibitive, or if Hybrik ever decides to offer analysis-only pricing, the service could be a lifesaver for compressionists on a deadline or those running high-volume tests.
Proprietary Tools
Most of the other metrics are available only in proprietary tools like the aforementioned Aurora, which offers far more than video quality metrics and is available in several editions ranging in price from $4,850 to $33,000. For all versions, TekMOS is a $4,000 option. The software runs on Windows Server 2012 R2 or later.
You can run Aurora via the API or UI. Either way, to analyze a file, you choose the file and a template with selected checks and verifications. TekMOS results are given in both numerical and graphic format as you can see in Figure 5, and tiling, noise, and blurriness can be shown separately to assist in score interpretation.
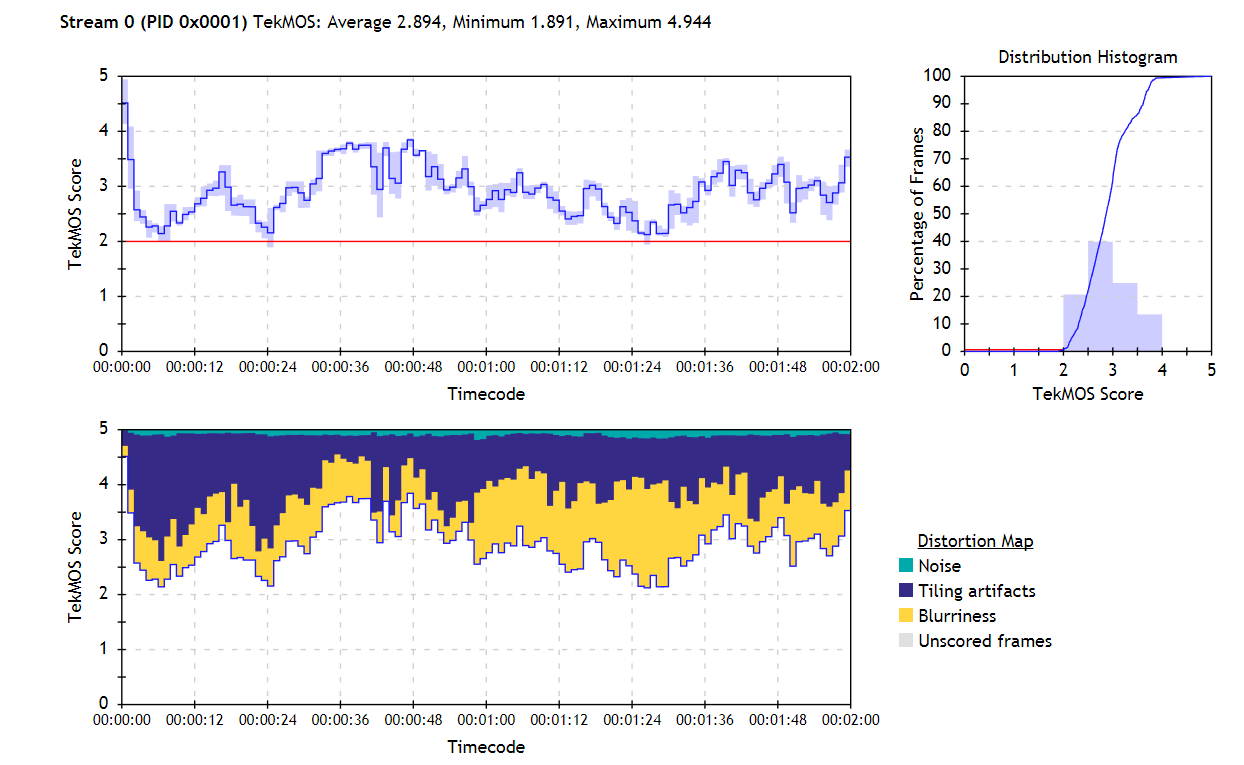 Figure 5. TekMOS results show an average score of 2.894, with blurriness and tiling the most significant issues.
Tektronix also sells a line of full-reference picture-quality analyzers with the PQR and ADMOS metrics discussed above, as well as others. Prices for these systems start at around $18,400, though you’ll need to spend another $9,180 for essential features like batch operation.
The SSIMPLUS algorithm is used throughout the SSIMWave product line, with the SSIMPLUS Analyzer providing the broadest analysis functions. The Analyzer is a very flexible product that can measure files with different resolutions and frame rates than the original, and you can compute scores for multiple devices simultaneously. In addition to text-based output files, the software outputs quality maps that you can use to compare different files. In addition to a Windows GUI for both batch and single file operation, the Analyzer is available as Linux, Mac, and Windows SDKs and command line interfaces. The company didn’t respond to our request for pricing information. We reviewed an older version of the Analyzer.
Finally, though I’ve never personally tested its products, Video Clarity sells a range of hardware, software, and cloud-based analysis tools with both full reference and non-reference video quality metrics. If you’re considering an investment in video quality control, be sure to check out Video Clarity as well.
Summing Up
In my experience, the more expensive the tool, the more idiosyncratic it is to operate. It’s impossible to get a sense for a tool or a metric by reading a spec sheet; you have to spend hours working with the metric and verify its results subjectively, many, many times, until you have confidence that the numerical scores represent real results. This may change depending upon the nature of the task. I would never spend big dollars on any video-quality analysis tool without a trial.
You may also find that different metrics call to you and that your preferences evolve over time or change by the project. In my journey with objective metrics, I started with an affinity for the Video Quality Metric (VQM), a basic metric that proved superior to PSNR and SSIM for identifying differences between the codecs I was analyzing for a consulting project. However, the raw score conveyed nothing about how a subjective user would rate the video. Plus, it was relatively unknown, so a VQM score meant nothing to clients or readers.
For more general work, I migrated to PSNR, which has easy-to-interpret scores and was universally known. Let’s face it, PSNR is still useful in some applications, as evidenced by Netflix using PSNR in its per-title encoding engine until replaced by VMAF in mid-2016, and continuing to cite PSNR results in most codec comparisons, along with VMAF, of course.
A later project involved choosing configurations for mobile devices, making SSIMPLUS a natural, since it has very easy-to-use device specific presets. Finally, once I started analyzing encoding ladders for clients, I began using and liking VMAF more and more; it’s accessible and was designed specifically for working with encoding ladders. Certainly the fact that it was developed by Netflix gives VMAF tremendous technical credibility.
Regarding VQM, better is always better, though something is almost always better than nothing. So if you have access to VMAF or some of the higher-quality, perceptual-based metrics, use those. If not, PSNR, SSIM, or MS SSIM should perform well for tasks such as evaluating encoding parameters like encoding preset, keyframe interval, bitrate control technique, and the like, or comparing the quality of like resolution rungs on your encoding ladder, as shown in Figure 3 with VMAF. I would be less confident in these metrics when comparing encoding tools and wouldn’t use them without confirming numbers from another metric when comparing codecs.
[This article appears in the November/December 2017 issue of Streaming Media Magazine as “Choosing and Using Objective Quality Benchmarks.”]


