Streaming Learning Center Where Streaming Professionals Learn to Excel

Related Articles


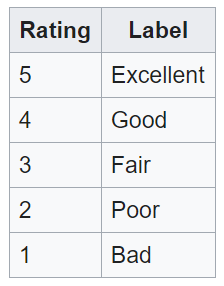
There are many quality metrics that use a variety of scoring mechanisms. One of the most frequently used metrics for subjective testing is called Mean Opinion Score, or MOS. The MOS rating is on a scale from 1-5 as shown below (from Wikipedia). You can use a variety of techniques to compute MOS, but typically they involve showing a viewer the source clip, then the compressed clip, and asking them to rate it on a scale from 1-5, or 1-10, or some other rating that’s easily convertible to the 1-5 MOS score.
In addition to subjective tests, some objective metrics use algorithms and/or machine learning to compute a MOS score, which again is presented on a scale from 1-5. Recently, I was working with such an objective metric and observed that the difference between two delivery techniques was a MOS difference of 0.3. The obvious question was, “would anyone notice this difference?” Or, more technically, what difference in MOS score would represent a Just Noticeable Difference?.
According to a Tektronix document you can download here, “The JND unit of measure is functionally defined such that 1 JND corresponds to a 75% probability than an observer viewing two images multiple times would be able to see the difference.”

So, I started Googling and quickly found a 2018 article entitled, “Interpreting MOS scores, when can users see a difference? Understanding user experience differences for photo quality. The opening line of the abstract succinctly defines the paper’s focus. “The use of no-reference image quality evaluation tools that produce MOS scores, like the VIQET tool which was released by the Video Quality Expert Group, raises the question of whether the produced MOS differences between images correspond to noticeable differences in quality by the consumers.”
So, we’re talking still images rather than video. Still, some related guidance is better than none, and here’s the paper’s conclusion – “Following this procedure, it was concluded that a MOS difference of 0.4661±0.0143 is required in order for 75% of the people to be able to detect the higher quality image.”
Again, in my case, I saw a MOS difference of 0.30 between the two techniques which was well under this threshold. This provided at least some support for the conclusion that this difference would not be perceived by a majority of viewers.
If anyone is aware of any video-related studies of this issue, please pass them along to me at [email protected]. Thanks!