Streaming Learning Center Where Streaming Professionals Learn to Excel


Related Articles


Editor’s Note: This article was rewritten to incorporate answers posed in the original article and answered by David Ronca, Director, Encoding Technology at Netflix, and Anne Aaron, Manager, Video Algorithms at Netflix. The author would like to express his appreciation to David and Anne for sharing their expertise with Streaming Media readers.
The Netflix blog post entitled Per-Title Encode Optimization boldly declares that “to deliver the best quality video to our members, each title should receive a unique bitrate ladder, tailored to its specific complexity characteristics.” In a world where many companies simply deploy Apple’s recommendations from TN2224 without modification, it’s a breath of fresh air. The blog post goes on to detail how Netflix creates its per-title encoding ladders.
While the Netflix post provides some valuable universal truths since Netflix is a subscription service there are some caveats that should be considered by companies that aren’t in similar businesses. After a quick overview, I’ll discuss these truths and caveats.
(Featured image courtesy of Beamr).
Contents
Overview: Per-Title Optimization
The encoding world has long been dominated by one-size-fits-all encoding “ladders,” or resolution/bitrate pairs. In its blog post, Netflix shared that it had previously used the following combinations to produce “good quality encodes” for most content.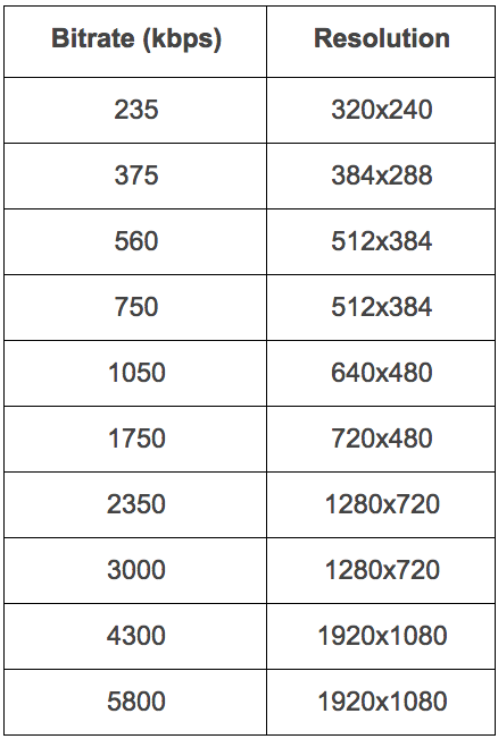
Table 1. Netflix’s traditional one-size-fits-all bitrate ladder.
Netflix then described the problem with this approach, which is that for some challenging videos, “the highest 5800kbps stream would still exhibit blockiness.” At the other end of the spectrum, “for simple content like cartoons, 5800 kbps is far more than needed to produce excellent 1080p encodes. In addition, a customer whose network bandwidth is constrained to 1750 kbps might be able to watch the cartoon at HD resolution, instead of the SD resolution specified by the ladder above.” In short, each video has a unique complexity, and a single encoding ladder can’t optimize the efficiency or viewing experience for all viewers.
To represent this “very high diversity in signal characteristics” of the videos the Netflix encodes, the blog presented the following graph, which showed 100 files encoded using x264’s constant QP (quantization parameter), which encodes each file to a consistent quality. At a high level, QP encoding seeks to deliver a certain quality level and varies the data rate to achieve this. Netflix is measuring the quality using the Peak Signal-to-Noise ratio, where higher scores indicate better quality.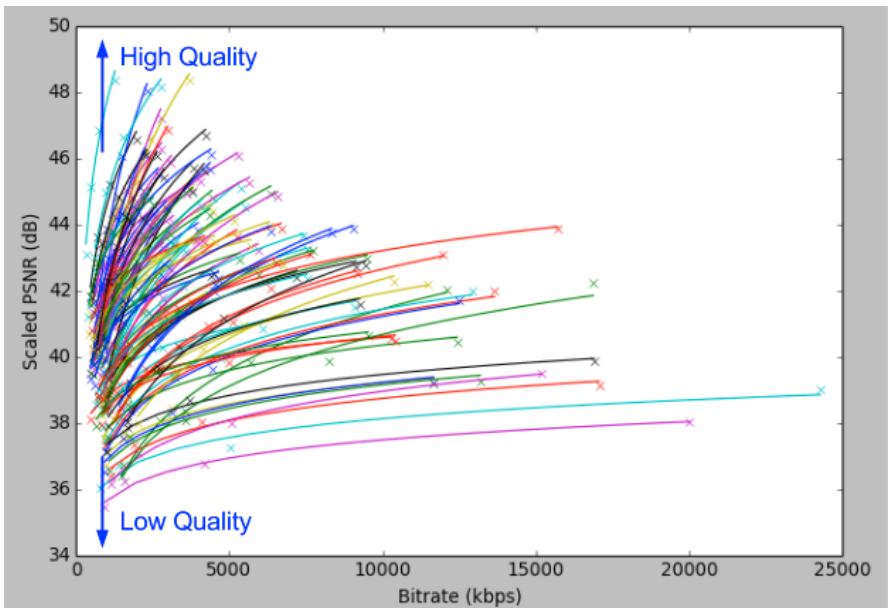
Figure 1. A representation of the bitrate/PSNR of 100 Netflix titles.
To create the graph, Netflix encoded all files at four different QP levels, as you can see by the four points on the bottom lavender-colored line. Looking at that plot, plus the aqua line immediately above it, you can see that even though the QP encoding delivered a high data rate, the quality level, which was around 38 dB for both files, was comparatively low. This indicates that these files are challenging to encode.
At the other end of the spectrum, the aqua line pointing nearly vertical at the top of the graph topped out at over 48 dB at 2Mbps, despite using the same QP value as the two encodes at the bottom. That’s dramatically higher quality at less than 10 percent of the data rate, indicating that that the top aqua line represents an easy to encode file. As it relates to the compression ladder, these results prove that a one-size-fits-all solution either applies too high a data rate to the file on top of the graph or too low a data rate to the files on the bottom.
Okay, you get it; some files are hard to compress, some files are easy to compress, so you should encode them using different bitrate ladders. Before moving on, I wanted to tie PSNR scores to subjective ratings, which Netflix is obviously qualified to do. Specifically, for that hard-to-compress file at the bottom of the graph, a PSNR level of 38 dB is “acceptable.” At other points in the discussion, Netflix says that scores under 35 dB will show encoding artifacts, while scores above 45 dB produce no perceptible quality improvements. While I don’t favor PSNR (as explained below), these are all useful data points for those who use the metric.
Those readers familiar with x.264 probably know that there’s an alternative to QP encoding called Constant Rate Factor (CRF) encoding, that adjusts the quality to scene content. We asked Netflix if it had considered using CRF encoding to gauge the encoding complexity of the file, and Ronca responded, “We started with QP and recently migrated to CRF. The results are about the same.”
Speaking of x.264, it’s long been speculated that Netflix is using some kind of pre- or post-processing function to optimize quality, so we asked about this. Ronca responded that Netflix was using Plain x.264, and continued, “But the techniques we describe should apply to any codec. The point that gets lost sometimes is that our work is really a pre-encode step to determine the best recipe for the encoder. In the past, an expert encodist would have made these decisions. We just got it to work at a very large scale.”
Plotting the Convex Hull
After establishing that all files needed different encoding ladders, the blog post goes on to describe how Netflix produces the ladder. At a high level, Netflix runs a number of test encodes at different resolutions and QP values to plot the PSNR quality at each data rate/resolution pair, and uses that to identify the optimum encoding ladder.
One observation made in the post is that while increasing the data rate at the same resolution consistently increases stream quality, these quality increases flatten out once the bitrate goes above a certain threshold. You can see this for the low, mid, and high-resolution plots in Figure 2. If you plot a line that includes the peak quality/bitrate efficiency points from all resolutions, you get a “convex hull,” a term describing the shape that most efficiently bounds all data points.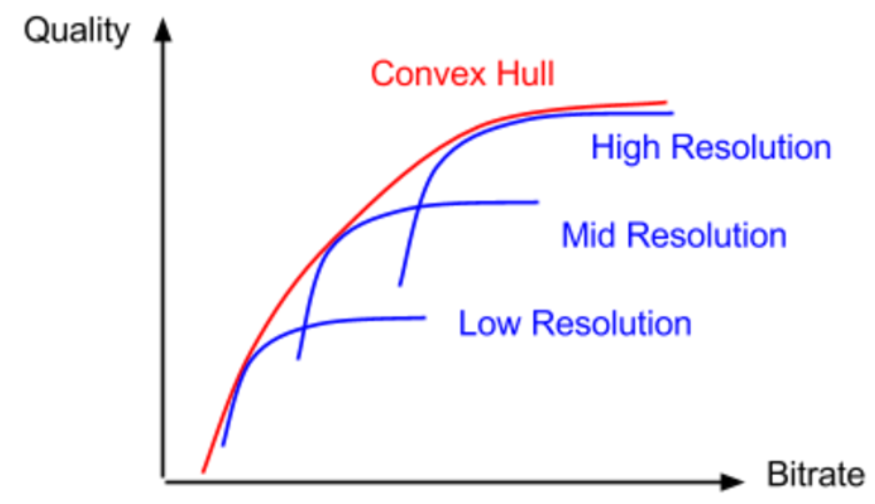
Figure 2. Plotting the convex hull, where each resolution or resolutions delivers maximum quality.
Here my grasp of the math and technique described in the post becomes strained. It seems obvious that for each resolution, the data rate selected would be the point on the convex hull. And Netflix is clear that it produces with a finite set of resolutions. What’s unclear is if each resolution gets a single encode, or if Netflix encodes at multiple data rates at the same resolutions.
This statement causes my confusion: “The bitrate selection is also limited to a finite set, where the adjacent bitrates have an increment of roughly 5%.” Does this mean that there are multiple encodes at bitrates roughly 5% apart, or if these are the bitrates for which Netflix tried to ascertain the highest quality resolution, in essence, the test targets?
Note that this is a critical issue. The procedure detailed in the blog post focuses solely on optimizing quality, not on whether or not the encoding ladder performs well in the context of an adaptive group. In this regard, Apple Tech Note TN2224 advises producers to keep “adjacent bit rates at a factor of 1.5 to 2 apart.” A seminal Adobe white paper on the topic explains why: “Too many bit rates too close to one another could result in too many stream switches, even with smaller bandwidth fluctuations. Besides the slight overhead in switching, the viewer’s experience with too-frequent quality fluctuations may not be pleasant.” So one big question is how many adaptive variants are produced for each source file, and how that changes with different content.
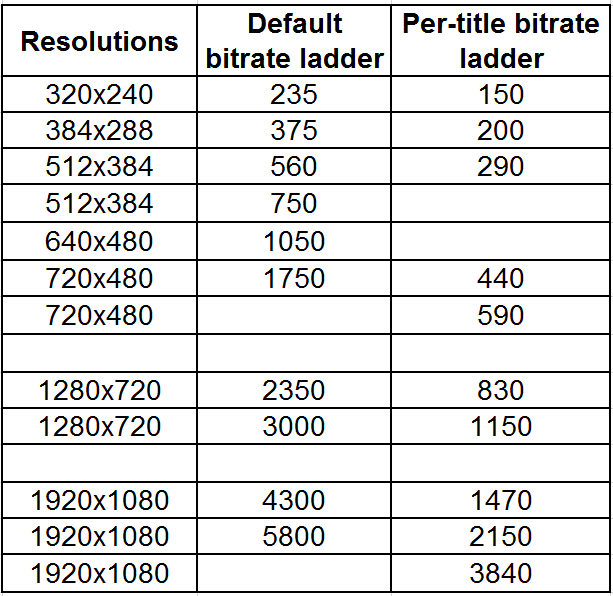
We asked Netflix how many bitrates were in the final group, and if they ware 5 percent apart, or more spaced out. Netflix provided the sample ladder shown in Table 2, and responded, “The total number of bitrates is dependent on the title. Ideally, there is one JND [just noticeable difference] between each bitrate. The sample below is the CBE for an animated original. This is representative but would vary per-title.”
 Table 2: Old and new encoding ladder for animated footage.
Note the significant data rate savings at 720×480 and above.
Another critical question is the encoding technique actually used for Netflix’s production encodes. Specifically, while Netflix clearly uses QP encoding as a tool to identify the optimal data rate target for each file, we were curious as to the technique used to encode the final video, particularly in view of the 10 percent variability threshold dictated in Apple Technote TN2224. Ronca advised that it uses two-pass VBR, with limited encoder parameters to maintain compatibility with legacy devices. As an example, Ronca related that the maximum buffer used was around 200 percent of the average target bitrate.
The Mystery of Netflix’s Comparisons
Upon first reading, the biggest mystery was how Netflix computed PSNR on files with varying resolutions since most objective quality tools like the Moscow University Video Quality Measurement Tool can’t perform cross-resolution testing of any kind (read the review). To be clear, the source file for all encodes is (presumably) a 1080p original. To compute PSNR, however, you need a pixel-by-pixel comparison. So how did Netflix computer PSNR on a lower-resolution variant like the 720×480 file?
The only tool I’m aware of that can perform cross-resolution and device aware testing is the SSIMWave Video Quality-of-Experience Monitor (SQM), which can deliver an SSIMplus rating (see the review), but that’s only for its proprietary SSIMplus algorithm, not PSNR, which the tool can also calculate. Here’s an excerpt from the SQM manual on the topic.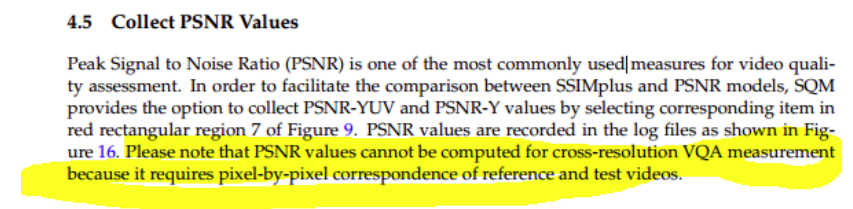
Figure 3. The only cross-resolution test tool I know can’t produce cross-resolution PSNR values.
When we asked about this, Ronca responded, “We use scaled PSNR for all quality metrics so the encoded video would be scaled back to the original resolution.” Essentially, this means that Netflix scales lower resolution files, like the 720×480 variant, back up to 1080p to compare to the original 1080p file. After a bit of research, and some input from some compressionists with experience in this area (thanks Fabio), I learned that this is pretty standard fare. A commenter to the original article also shared this explanation. Mystery solved.
Why PSNR?
At this point, I should probably also express my bias against the PSNR test as the basis for making compression-related decisions. I explain part of this in my post, “Why I like VQM better than PSNR or SSIM,” and confess to a growing appreciation for the SSIMplus metric, which ties to anticipated viewer ratings, can perform cross-resolution testing, and is device specific. To be fair, Netflix acknowledges PSNR’s deficits by stating:
Although PSNR does not always reflect perceptual quality, it is a simple way to measure the fidelity to the source, gives good indication of quality at the high and low ends of the range (i.e. 45 dB is very good quality, 35 dB will show encoding artifacts), and is a good indication of quality trends within a single title.
I agree that PSNR is a good indication of quality trends in a file, but if it doesn’t “always reflect perceptual quality,” why not base this analysis on a different metric like VQM (scaled as Netflix is scaling PSNR) or SSIMplus? You can browse through some test results that compared PSNR, SSIM, VQM, and SSIMplus in a post titled, The SSIMplus Index for Video Quality-of-Experience Assessment. Note that it was produced by employees of SSIMWave, the developer of SSIMplus.
Interestingly, in its paper the Optimal Set of Video Representations in Adaptive Streaming, a dense work mentioned in a comment on the Netflix blog, researchers stated that, “we model the satisfaction function as a Video Quality Metric (VQM) score [19], which is a full-reference metric that has a higher correlation with human perception than other MSE-based metrics.” MSE means mean square error, and PSNR is such a metric.
In short, if SSIMplus is better, and VQM is better, why use PSNR, particularly if you’re drawing quality-related conclusions from the scores, not just quality trends? Interestingly, in the blog post, Netflix referenced the VMAF quality metric, which it is co-developing. So we asked whether Netflix was using PSNR, or VMAF, to dictate their quality decisions. Ronca responded, “We use both VMAF and PSNR. VMAF is still in development and the bitrate resolution decisions are made using PSNR. VMAF will get promoted when we have confidence.”
As a follow-up, we asked, “Why PSNR as opposed to VQM or SSIM or SSIMplus? Ronca commented, “Good question, and other metrics may have provided better results.” Then he continued, “PSNR was already built into our tools so we get the data [computationally] free and it required minimal dev. Thus far, it appears to be working well, with VMAF and internal subjective tests confirming our recipe. Also, we limit use to a prediction metric to drive some codec recipe decisions, where some of the issues with PSNR maybe not so important. As I mentioned, we will eventually use VMAF to drive codec decisions.”
The Caveats
The caveats are fairly clear. First, Netflix is a subscription service, so all bandwidth related to file delivery is fully funded. When ascertaining the highest bitrate, quality is the critical factor for most files.
But what about non-subscriptions services? Of course, all videos are funded one way or another, whether by advertising or by dipping into the marketing or training budget. In most of these non-subscription cases, the maximum data rate is dictated by bandwidth cost, not quality. When cost determines the maximum bitrate, the analysis becomes which resolution delivers the best quality at that data rate, which is why effective cross-resolution testing is so essential. That is, you say 3Mbps is the limit, and the analysis becomes if 1080p, 720p, or 540p delivers the best quality.
Also, as an OTT service, Netflix displays most videos at full screen. In contrast, most producers delivering shorter content produce for a smaller display window. This is why Apple’s TN2224 has two bitrates at the 640×360 window, while Netflix has none. The first rule of producing for adaptive streaming is to have at least one stream for each window size on your website, and many producers use two or more.
So while the Netflix blog post breaks new ground in justifying content-aware encoding, few producers should apply the whole cloth.
Conclusion
Overall, the Netflix post marks a bold line in the sand that a single encoding ladder is insufficient for companies distributing disparate types of videos. As mentioned above, even if you’re distributing relatively homogenous videos, if you’re using an encoding ladder not customized for your video type then it’s almost certainly suboptimal.
In short, TN2224 is dead (at least for broad-brush implementations). Welcome to the new era of content-aware encoding.